. 2019 Jan 14;9(1):88.
doi: 10.1038/s41598-018-36435-8.

An MR technique for simultaneous quantitative imaging of water content, conductivity and susceptibility, with application to brain tumours using a 3T hybrid MR-PET scanner

Affiliations

An MR technique for simultaneous quantitative imaging of water content, conductivity and susceptibility, with application to brain tumours using a 3T hybrid MR-PET scanner

Yupeng Liao et al. Sci Rep. .

Abstract

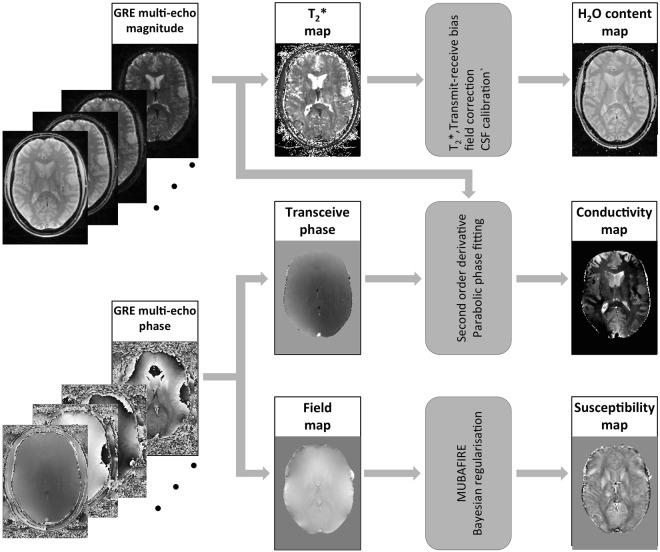
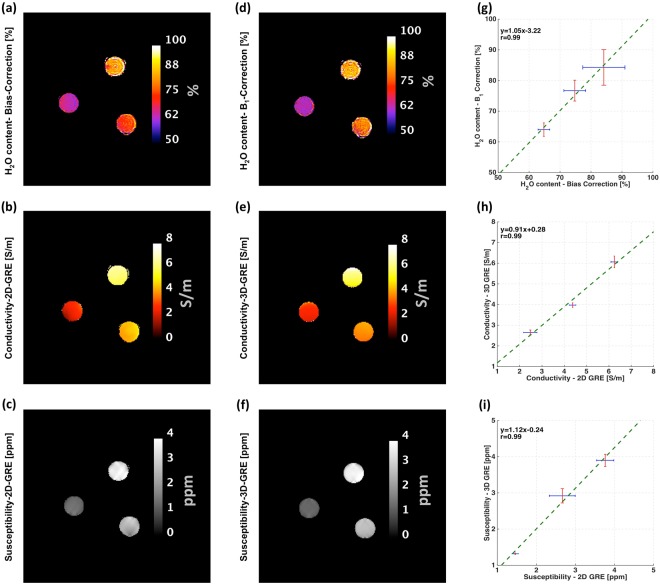
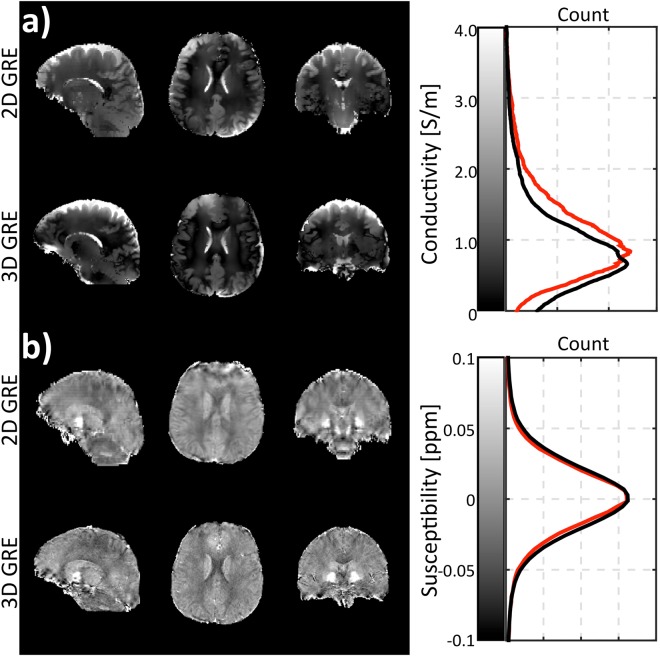
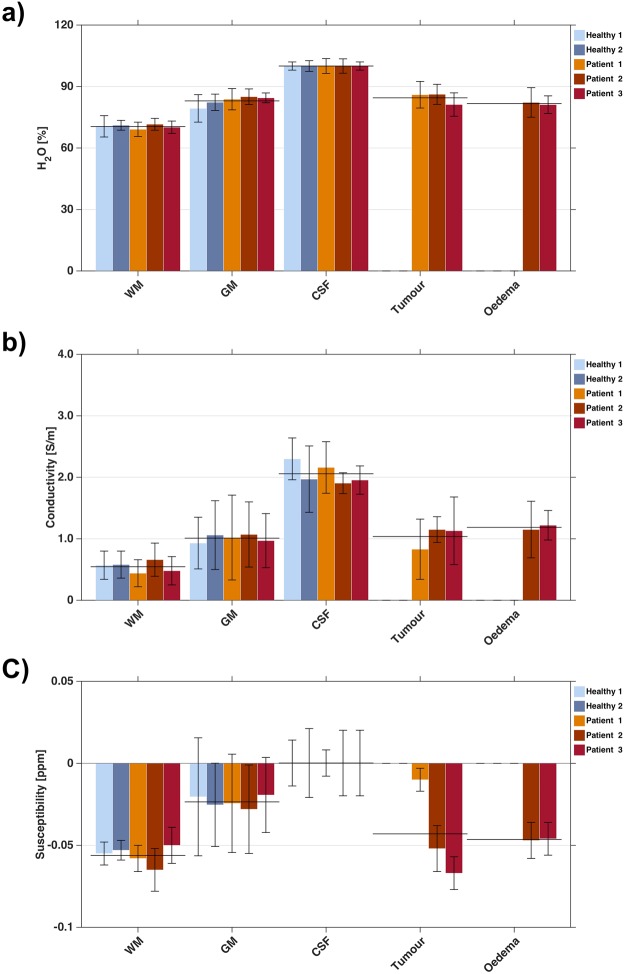
Approaches for the quantitative mapping of water content, electrical conductivity and susceptibility have been developed independently. The purpose of this study is to develop a method for simultaneously acquiring quantitative water content, electrical conductivity and susceptibility maps based on a 2D multi-echo gradient echo sequence. Another purpose is to investigate the changes in these properties caused by brain tumours. This was done using a 3T hybrid magnetic resonance imaging and positron emission tomography (MR-PET) scanner. Water content maps were derived after performing T2* and transmit-receive field bias corrections to magnitude images essentially reflecting only the H2O content contrast. Phase evolution during the multi-echo train was used to generate field maps and derive quantitative susceptibility, while the conductivity maps were retrieved from the phase value at zero echo time. Performance of the method is demonstrated on phantoms and two healthy volunteers. In addition, the method was applied to three patients with brain tumours and a comparison to maps obtained from PET using O-(2-[18 F]fluoroethyl)-L-tyrosine and clinical MR images is presented. The combined information of the water content, conductivity and susceptibility may provide additional information about the tissue viability. Future studies can benefit from the evaluation of these contrasts with shortened acquisition times.


Conflict of interest statement

The authors declare no competing interests.

Figures

Figure 1
Figure 1
Schematic representation of the quantitative multi-parametric mapping workflow with data from a brain tumour patient: the gradient multi-echo phase is unwrapped and separated into field and transceiver (TE = 0) components, from which susceptibility and conductivity maps are reconstructed. The M0-weighted magnitude images are utilised for H2O quantification after a series of corrections including T1, T2* and RF field inhomogeneity bias correction. Moreover, the magnitude profiles additionally serve for the identification of tissue boundaries information required in the reconstruction of conductivity.
Figure 2
Figure 2
Phantom experiments with varying H2O content, susceptibility and conductivity. Part one: phantom H2O content obtained from 2D-multi-echo GRE magnitude images using different RF bias correction methods: (a) SPM8 based RF bias correction (d) B1+ based RF correlation (g) correlation between RF bias correction methods; Part two: Phantom conductivity obtained from 2D and 3D multi-echo GRE phase images: (b) 2D method conductivity (e) 3D method conductivity (h) comparison between 2D and 3D method; Part three: phantom susceptibility calculated from 2D and 3D multi-echo GRE images: (c) 2D method susceptibility (f) 3D method susceptibility, i) correlation between 2D and 3D method. The length of the error bars represents twice the standard deviation of the parametric map in the ROI.
Figure 3
Figure 3
In vivo reconstructed images obtained using the proposed method in comparison to the results from a 3D protocol. Sagittal, transverse and coronal slices of the estimated (a) susceptibility (b) conductivity maps. For each parameter, the first row contains the results of the proposed method, while the second row displays the 3D protocol results. The corresponding histograms are demonstrated on the right of each parametric map. The red line and black line represent the proposed 2D protocol and 3D protocol, respectively.
Figure 4
Figure 4
MR and PET images from three tumour patients. Sagittal, transverse and coronal slices through the tumours. (a) T1-weighted MPRAGE (b) proton FLAIR (c) FET-PET (d) quantitative water content (e) electrical conductivity and (f) quantitative susceptibility images. The colour bar indicates the water content in percentage, susceptibility in ppm and conductivity in S/m in the images.
Figure 5
Figure 5
Mean values with standard deviations of (a) the water content (b) conductivity and (c) relative susceptibility with respect to CSF parameters in different segmented tissue groups for five in vivo datasets, including two healthy controls and three patients affected by brain tumours. In addition, the overall measured tissue group mean values are indicated.
Figure 6
Figure 6
Images of the ratio of fitted zero echo time value to its uncertainty: |ϕ(r0,TE=0)|/Δϕ(r0,TE=0) in one representative healthy volunteer. The average value is around 40 within all brain regions.

Similar articles

Cited by

References

    1. Neeb H, Zilles K, Shah NJ. Fully-automated detection of cerebral water content changes: study of age- and gender-related H2O patterns with quantitative MRI. NeuroImage. 2006;29:910–922. doi: 10.1016/j.neuroimage.2005.08.062. - DOI - PubMed
    1. Christiansen P, et al. MR-visible water content in human brain: a proton MRS study. Magn. Reson. Imaging. 1994;12:1237–1244. doi: 10.1016/0730-725X(94)90088-9. - DOI - PubMed
    1. Brix G, Schad LR, Lorenz WJ. Evaluation of proton density by magnetic resonance imaging: phantom experiments and analysis of multiple component proton transverse relaxation. Phys. Med. Biol. 1990;35:53–66. doi: 10.1088/0031-9155/35/1/006. - DOI - PubMed
    1. Liu C, et al. Quantitative Susceptibility Mapping: Contrast Mechanisms and Clinical Applications. Tomogr. J. Imaging Res. 2015;1:3–17. - PMC - PubMed
    1. Gabriel C, Gabriel S, Corthout E. The dielectric properties of biological tissues: I. Literature survey. Phys. Med. Biol. 1996;41:2231–2249. doi: 10.1088/0031-9155/41/11/001. - DOI - PubMed

Publication types