. 2019 Jan 14;9(1):94.
doi: 10.1038/s41598-018-36993-x.

Altered spinogenesis in iPSC-derived cortical neurons from patients with autism carrying de novo SHANK3 mutations

Affiliations

Altered spinogenesis in iPSC-derived cortical neurons from patients with autism carrying de novo SHANK3 mutations

Laura Gouder et al. Sci Rep. .

Abstract

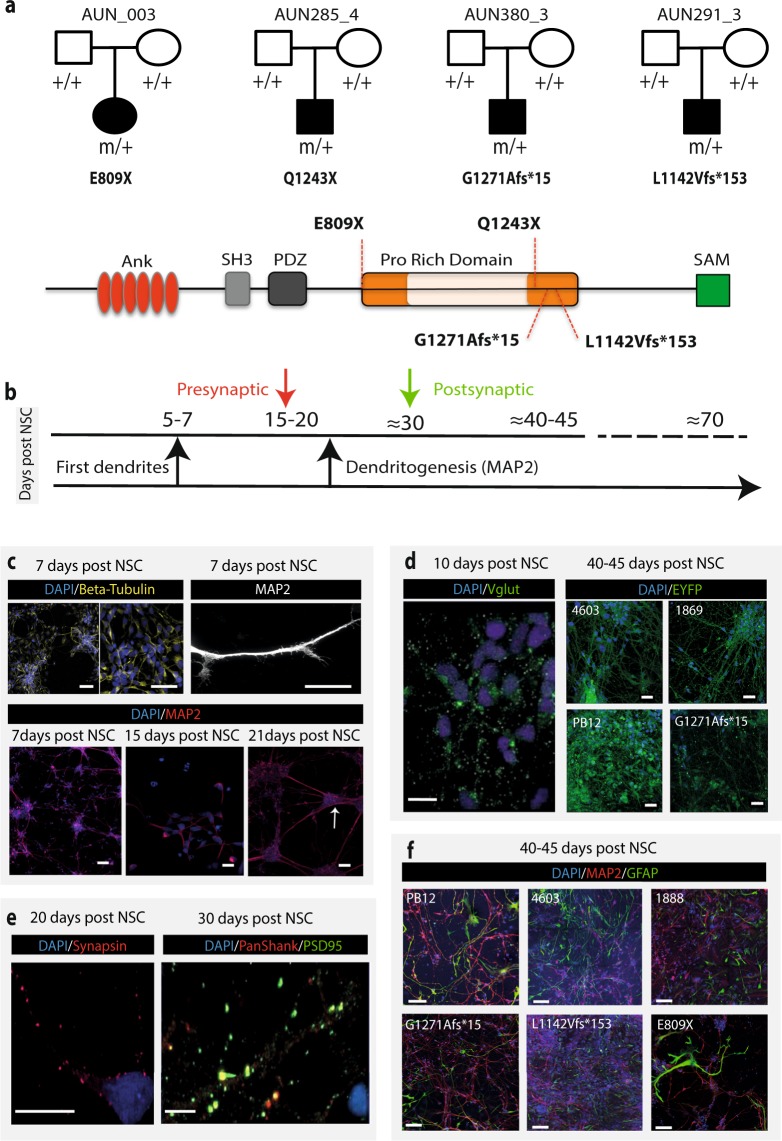
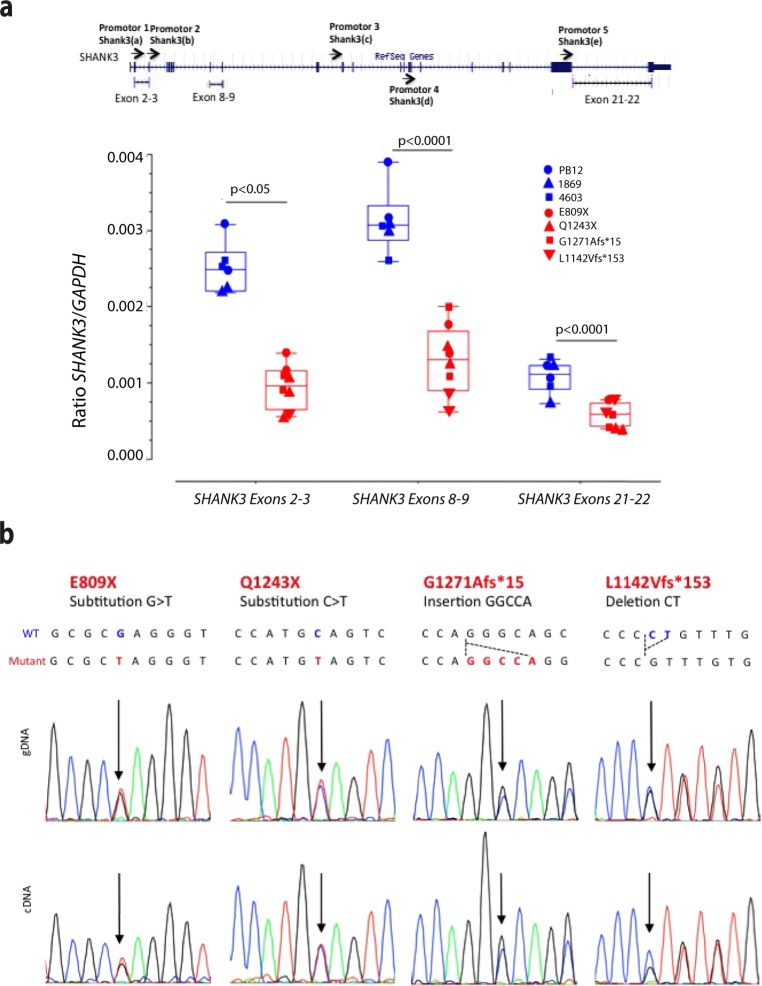
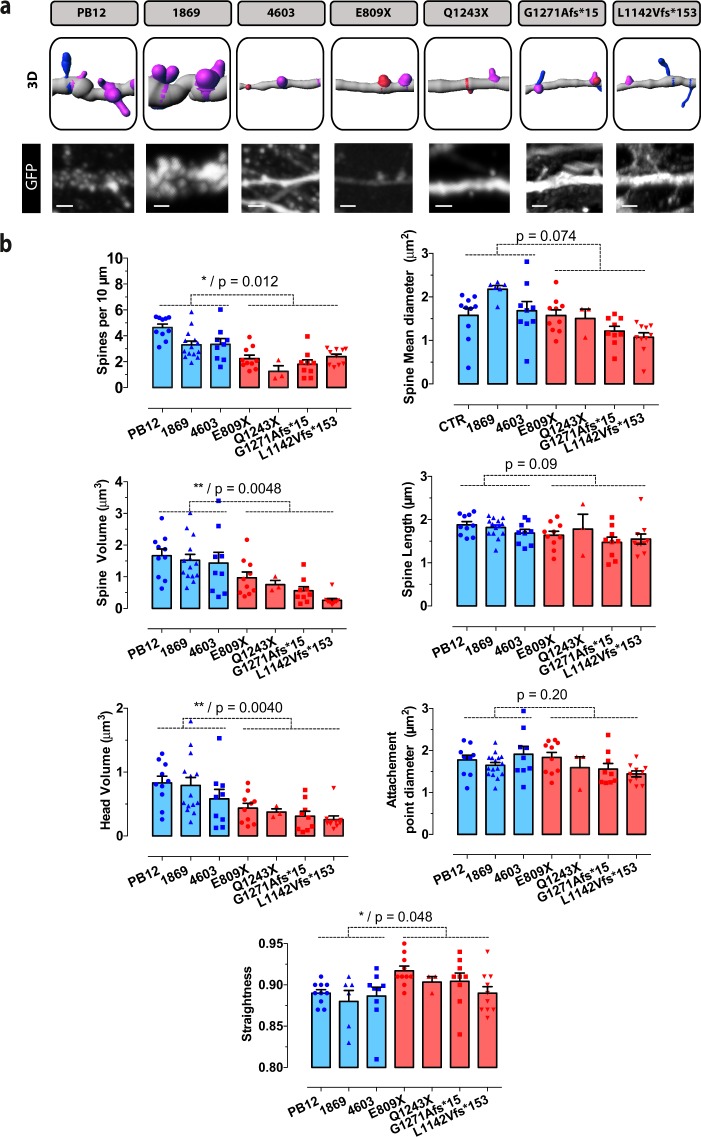
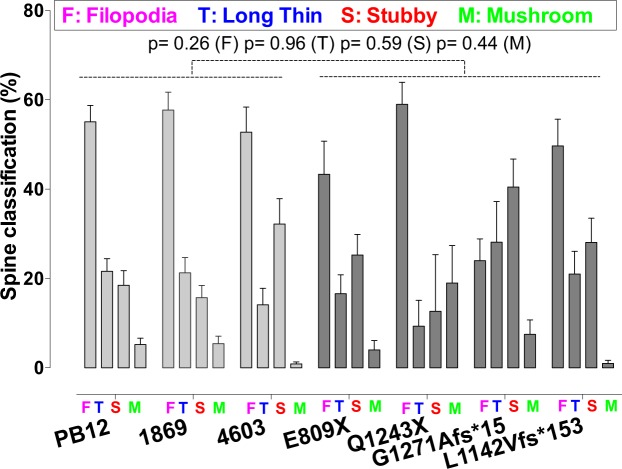
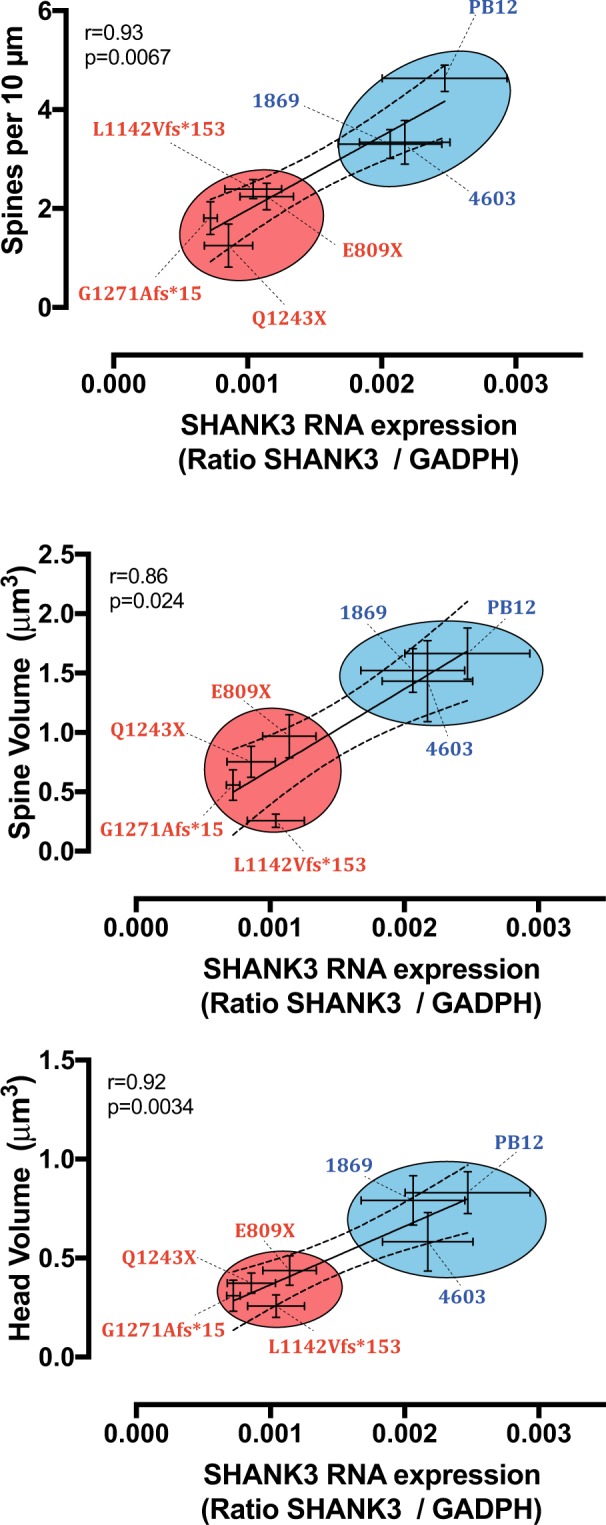
The synaptic protein SHANK3 encodes a multidomain scaffold protein expressed at the postsynaptic density of neuronal excitatory synapses. We previously identified de novo SHANK3 mutations in patients with autism spectrum disorders (ASD) and showed that SHANK3 represents one of the major genes for ASD. Here, we analyzed the pyramidal cortical neurons derived from induced pluripotent stem cells from four patients with ASD carrying SHANK3 de novo truncating mutations. At 40-45 days after the differentiation of neural stem cells, dendritic spines from pyramidal neurons presented variable morphologies: filopodia, thin, stubby and muschroom, as measured in 3D using GFP labeling and immunofluorescence. As compared to three controls, we observed a significant decrease in SHANK3 mRNA levels (less than 50% of controls) in correlation with a significant reduction in dendritic spine densities and whole spine and spine head volumes. These results, obtained through the analysis of de novo SHANK3 mutations in the patients' genomic background, provide further support for the presence of synaptic abnormalities in a subset of patients with ASD.


Conflict of interest statement

The authors declare no competing interests.

Figures

Figure 1
Figure 1
Pedigrees of the families carrying de novo SHANK3 mutations and neuronal characterization. (a) Upper, the four patients probands carry de novo truncating mutations in SHANK3 gene (two « STOP » and two « frameshift » mutations leading to a premature STOP codon). (a) Lower, A schematic representation of the multidomain SHANK3 protein with the location of the four mutated aminoacids is provided. Conserved domains are indicated by filled rectangles. The mutations are located within the Proline-rich structure of SHANK3, between the PDZ and the SAM domains, and within exon 21 of SHANK3 gene. (b) Schematic representation of neuron maturation at different time periods. (c) Upper left, Immunofluorescence staining of human control iPSC cells-derived neurons by beta III tubulin at 7 days post NSC differentiation. (c) Upper right, labeling of a single dendrite using the MAP2 marker showing dendritic growth cones at early stages of culture. (c) Lower, Immunofluorescence staining of human iPSC cells-derived neurons by MAP2 at different intervals of time post NSC differentiation. The target shows neurite elongation and established connectivity between cell clusters. (d) VGlut1 marker at 10 days post NSC differentiation stained glutamatergic neurons.  Labeling of control (1869, 4603, PB12) and ASD (G1271Afs*15) mature neurons at 40–45 days post NSC differentiation using the pAAV-CaMKIIa-hChR2-EYFP-WPRE lentivirus are also illustrated. (e) Immunofluorescence staining using presynaptic (synapsin) and postsynaptic (PSP95 and PanSHANK) markers. No staining was detectable before the indicated days post NSC differentiation (20 days for Synapsin, 10 days for VGlut1 and 30 days for PSD95). Data are from at least two control individuals (PB12 and 4603) (f) Immunofluorescence GFAP staining of cultures from iPSC-derived neurons showing the presence of astrocytes in 3 controls individuals (PB12, 4603, 1888) and 3 patients (G1271Afs*15, L1142Vfs*153, E809X). Scale bars: 10 μm (a-e); 100 μm (f).
Figure 2
Figure 2
Analysis of SHANK3 gene expression in iPSC-derived neurons from controls and ASD patients. (a) Quantification of SHANK3 mRNA in iPSC-derived neurons (40 days post NSC) using RT-ddPCR. Data are mean ± SEM. Statistical analysis was performed using a two-way Anova. *p < 0.05 ***p < 0.001 (b) Sequencing diagrams showing the presence of the four mutations in the genomic and cDNA extracted from iPSC-derived neurons.
Figure 3
Figure 3
Quantitative analysis of the morphological parameters of primary dendritic spines between control and ASD neurons. (a) Primary spine segments with corresponding 3D reconstructions. Scale bar = 2 μm. Dendrite segments (grey color) are endowed with four categories of spines: Filopodia (pink color), Thin (blue), Stubby (pink) and Muschroom (green). (b) Spine morphological parameters were quantified using the Imaris sofware as described in Materials and Methods. Numbers of neuronal dendrites are indicated in the graph. Data are presented as mean ± SEM. Statistical analysis was performed using unpaired Student t-test in order to analyze the significance between mean values from combined controls and combined patients. Equality of variances was checked using the Fisher’s F-test. P values are directly indicated in the graph. *p < 0.05, **p < 0.01.
Figure 4
Figure 4
Morphological classification of primary dendritic spines between control and ASD neurons. Morphological parameters of the four spine categories were quantified using the Imaris sofware as described in Materials and Methods. Data are presented as mean ± SEM. Statistical analysis was performed using unpaired Student t-test. Equality of variances was checked using the Fisher’s F-test. P values are directly indicated in the graph. Combined mean values for Filopodia were significantly increased as compared to combined values from all other spine categories (p < 0.0001). Statistical analysis was performed as described above.
Figure 5
Figure 5
Correlation analysis between SHANK3 expression and alterations in dendritic spine parameters in iPSC-derived neurons from control individuals and patients with ASD. Upper graph, Correlation between SHANK3 mRNA and spine densities. Middle graph, Correlation between SHANK3 mRNA and total spine volume. Lower graph, Correlation between SHANK3 mRNA and head spine volume. Statistical analysis was performed using GraphPad Prism Version 6 software (GraphPad, sand Diego, California, USA). Data are mean ± SEM. Coefficients were calculated using Spearman correlation method and are indicated in the graphs with statistical significance.

Similar articles

Cited by

References

    1. Gillberg C. The ESSENCE in child psychiatry: early symptomatic syndromes eliciting neurodevelopmental clinical examinations. Rev. Disabil. 2010;31:1543–1551. doi: 10.1016/j.ridd.2010.06.002. - DOI - PubMed
    1. Bourgeron T. From the genetic architecture to synaptic plasticity in autism spectrum disorder. Nat. Rev. Neurosci. 2015;16:551–563. doi: 10.1038/nrn3992. - DOI - PubMed
    1. Leblond CS, et al. Meta-analysis of SHANK Mutations in Autism Spectrum Disorders: a gradient of severity in cognitive impairments. PLoS Genet. 2014;10:e1004580. doi: 10.1371/journal.pgen.1004580. - DOI - PMC - PubMed
    1. Tabet A-C, et al. A framework to identify contributing genes in patients with Phelan-McDermid syndrome. NPJ Genomic Medecine. 2017;2:32. doi: 10.1038/s41525-017-0035-2. - DOI - PMC - PubMed
    1. Durand CM, et al. Mutations in the gene encoding the synaptic scaffolding protein SHANK3 are associated with autism spectrum disorders. Nat. Genet. 2007;39:25–27. doi: 10.1038/ng1933. - DOI - PMC - PubMed

Publication types

Substances