. 2019 Jan 14;9(1):96.
doi: 10.1038/s41598-018-36471-4.

Astrocytoma progression scoring system based on the WHO 2016 criteria

Affiliations

Astrocytoma progression scoring system based on the WHO 2016 criteria

Zhen-Hang Li et al. Sci Rep. .

Abstract

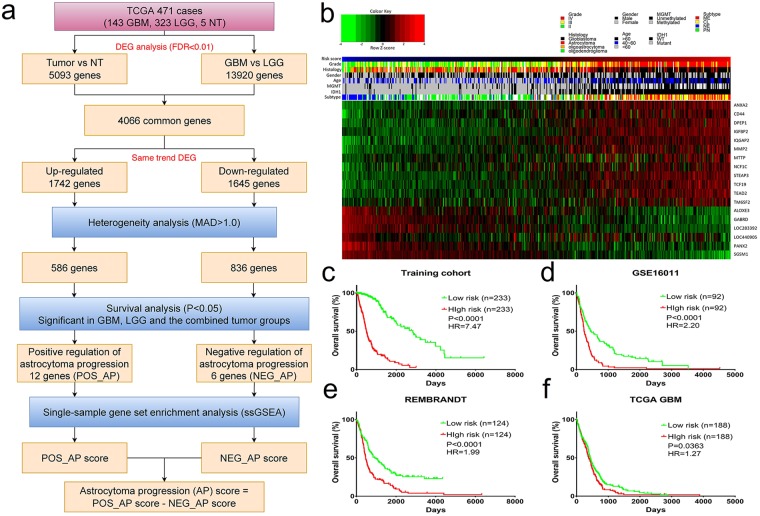
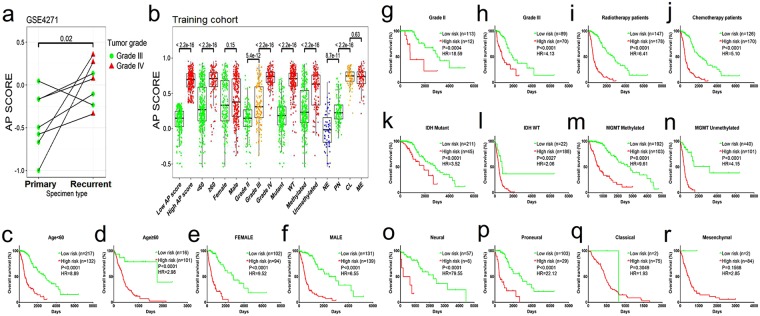
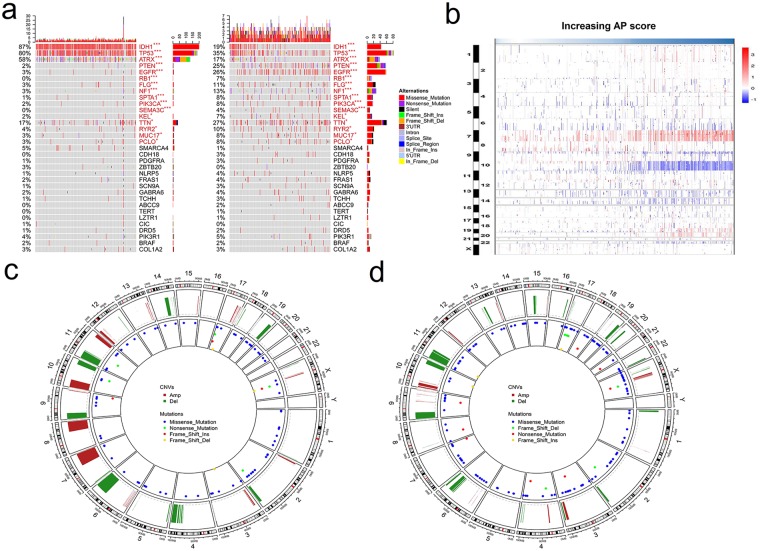
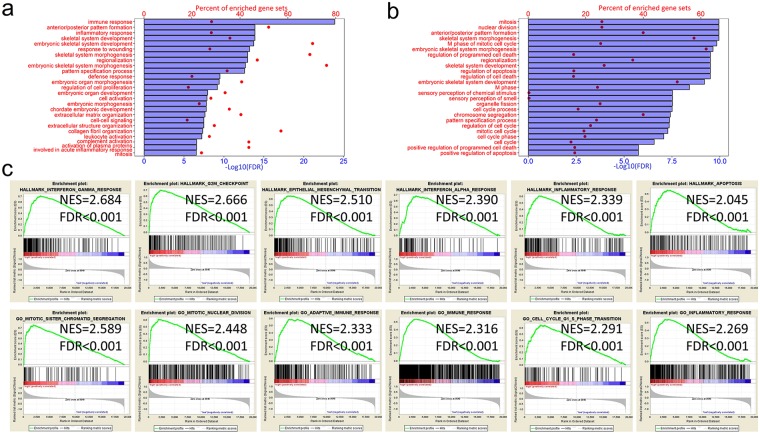
Diffuse astrocytoma (including glioblastoma) is morbid with a worse prognosis than other types of glioma. Therefore, we sought to build a progression-associated score to improve malignancy and prognostic predictions for astrocytoma. The astrocytoma progression (AP) score was constructed through bioinformatics analyses of the training cohort (TCGA RNA-seq) and included 18 genes representing distinct aspects of regulation during astrocytoma progression. This classifier could successfully discriminate patients with distinct prognoses in the training and validation (REMBRANDT, GSE16011 and TCGA-GBM Microarray) cohorts (P < 0.05 in all cohorts) and in different clinicopathological subgroups. Distinct patterns of somatic mutations and copy number variation were also observed. The bioinformatics analyses suggested that genes associated with a higher AP score were significantly involved in cancer progression-related biological processes, such as the cell cycle and immune/inflammatory responses, whereas genes associated with a lower AP score were associated with relatively normal nervous system biological processes. The analyses indicated that the AP score was a robust predictor of patient survival, and its ability to predict astrocytoma malignancy was well elucidated. Therefore, this bioinformatics-based scoring system suggested that astrocytoma progression could distinguish patients with different underlying biological processes and clinical outcomes, facilitate more precise tumour grading and possibly shed light on future classification strategies and therapeutics for astrocytoma patients.


Conflict of interest statement

The authors declare no competing interests.

Figures

Figure 1
Figure 1
Development of the AP score and its prognostic value across cohorts. (a) An overview of the AP score algorithm. The AP score algorithm uses gene expression data to output the combined degree of positive and negative regulation of astrocytoma progression. (b) Heatmap depicting the Z-score expression values of the 18 genes in the training cohort. Columns represent each sample and are labelled with their clinical characteristics, and rows represent genes and are divided into two groups representing POS_AP and NEG_AP. (c) Kaplan-Meier survival analyses based on the median cutoff AP score in the training dataset. (d) Kaplan-Meier survival analyses based on the median cutoff AP score in the GSE16011 dataset. (e) Kaplan-Meier survival analyses based on the median cutoff AP score in the REMBRANDT dataset. (f) Kaplan-Meier survival analyses based on the median cutoff AP score in TCGA GBM dataset. Mutant: IDH1 mutant, WT: IDH1 wild type; NE: Neural, PN: Pro-neural, CL: Classical, ME: Mesenchymal.
Figure 2
Figure 2
The AP score in the longitudinal dataset and the prognostic value of the AP score across different subgroups of the training cohort. (a) The AP score in subgroups of primary-recurrent paired astrocytomas in the GSE4271 cohort. (b) Distribution of the AP score among astrocytoma subgroups in the training cohort. ANOVA p < 0.001 in the grade and subtype subgroups. (cr) Kaplan-Meier survival analyses based on the dichotomized AP score in the supergroups defined by clinicopathological factors of the training cohort.
Figure 3
Figure 3
Different mutation and copy number variation patterns of the AP score. (a) Summary of well-known individual regulators of glioma from 460 samples from the training cohort. Columns are sorted by samples with increasing AP scores. Top histogram, the sum of mutations in each sample category is indicated by the legend; Right histogram, the sum of mutations in each gene is indicated by the legend. (b) The overall copy number variation (CNV) profile in order of increasing AP score. (c,d) A distinct CNV and recurrent mutation profile is observed between astrocytomas with low and high AP scores. *P < 0.05; **P < 0.01; ***P < 0.001.
Figure 4
Figure 4
Biological function of the AP score. (a) The top 25 GO terms for upregulated DEGs [Log10(FC) > 1.5] enriched based on the AP score. (b) The top 25 GO terms of highly correlated (r > 0.6) genes enriched based on the AP score. (c) GSEA results based on the increasing AP score.

Similar articles

Cited by

References

    1. Louis DN, et al. The 2016 World Health Organization Classification of Tumors of the Central Nervous System: a summary. Acta Neuropathologica. 2016;131:803–820. doi: 10.1007/s00401-016-1545-1. - DOI - PubMed
    1. Xing Z, You RX, Li J, Liu Y, Cao DR. Differentiation of primary central nervous system lymphomas from high-grade gliomas by rCBV and percentage of signal intensity recovery derived from dynamic susceptibility-weighted contrast-enhanced perfusion MR imaging. Clin Neuroradiol. 2014;24:329–336. doi: 10.1007/s00062-013-0255-5. - DOI - PubMed
    1. Liang R, et al. Role of rCBV values derived from dynamic susceptibility contrast-enhanced magnetic resonance imaging in differentiating CNS lymphoma from high grade glioma: a meta-analysis. Int J Clin Exp Med. 2014;7:5573–5577. - PMC - PubMed
    1. Verhaak RG, et al. Integrated genomic analysis identifies clinically relevant subtypes of glioblastoma characterized by abnormalities in PDGFRA, IDH1, EGFR, and NF1. Cancer cell. 2010;17:98–110. doi: 10.1016/j.ccr.2009.12.020. - DOI - PMC - PubMed
    1. Kuo LT, et al. Multiplexed methylation profiles of tumor suppressor genes and clinical outcome in oligodendroglial tumors. Cancer Med. 2016;5:1830–1839. doi: 10.1002/cam4.762. - DOI - PMC - PubMed