

The bile salt glycocholate induces global changes in gene and protein expression and activates virulence in enterotoxigenic Escherichia coli
- PMID: 30643184
- PMCID: PMC6331568
- DOI: 10.1038/s41598-018-36414-z
The bile salt glycocholate induces global changes in gene and protein expression and activates virulence in enterotoxigenic Escherichia coli
Abstract
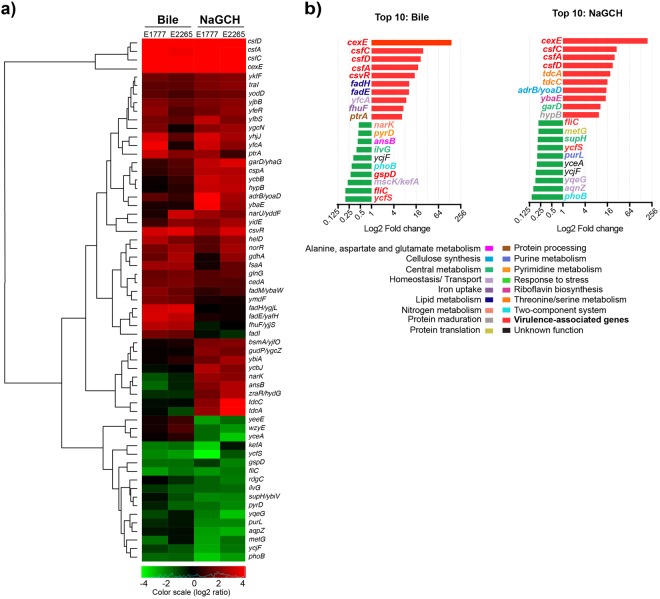
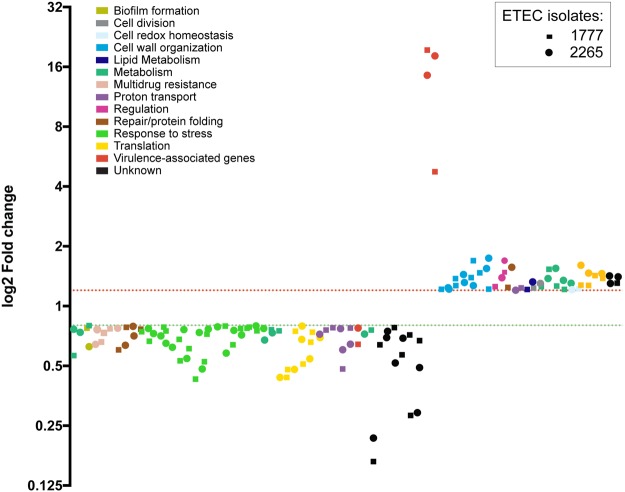
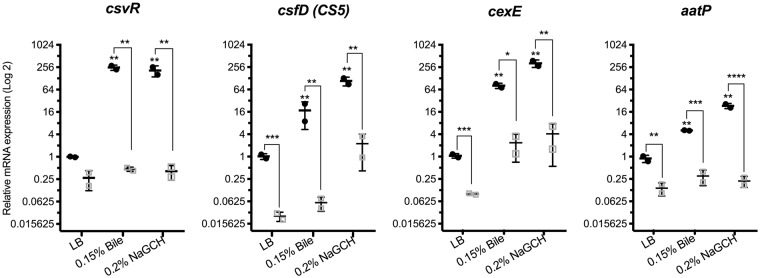
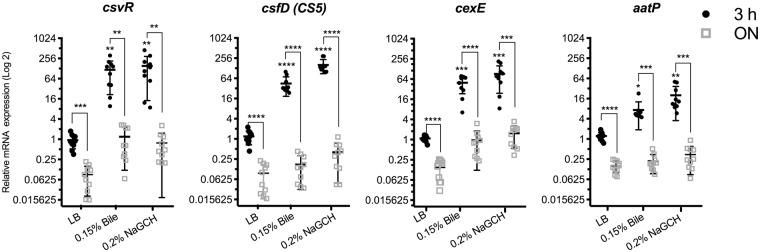
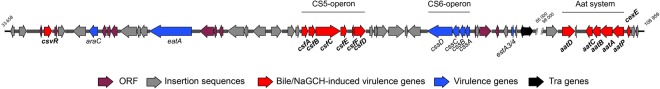
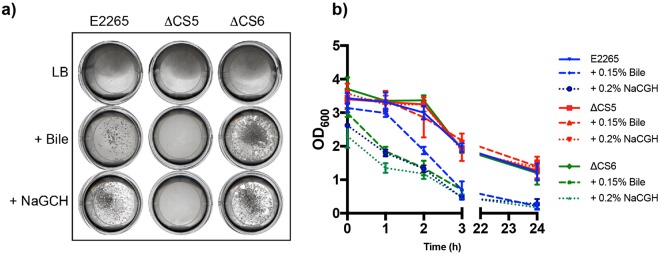
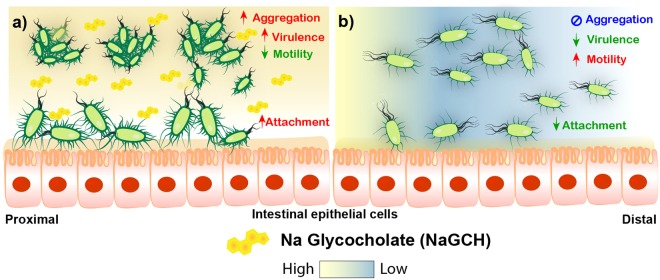
Pathogenic bacteria use specific host factors to modulate virulence and stress responses during infection. We found previously that the host factor bile and the bile component glyco-conjugated cholate (NaGCH, sodium glycocholate) upregulate the colonization factor CS5 in enterotoxigenic Escherichia coli (ETEC). To further understand the global regulatory effects of bile and NaGCH, we performed Illumina RNA-Seq and found that crude bile and NaGCH altered the expression of 61 genes in CS5 + CS6 ETEC isolates. The most striking finding was high induction of the CS5 operon (csfA-F), its putative transcription factor csvR, and the putative ETEC virulence factor cexE. iTRAQ-coupled LC-MS/MS proteomic analyses verified induction of the plasmid-borne virulence proteins CS5 and CexE and also showed that NaGCH affected the expression of bacterial membrane proteins. Furthermore, NaGCH induced bacteria to aggregate, increased their adherence to epithelial cells, and reduced their motility. Our results indicate that CS5 + CS6 ETEC use NaGCH present in the small intestine as a signal to initiate colonization of the epithelium.
Conflict of interest statement
The authors declare no competing interests.
Figures

Similar articles
-
Expression of colonization factor CS5 of enterotoxigenic Escherichia coli (ETEC) is enhanced in vivo and by the bile component Na glycocholate hydrate.PLoS One. 2012;7(4):e35827. doi: 10.1371/journal.pone.0035827. Epub 2012 Apr 30. PLoS One. 2012. PMID: 22563407 Free PMC article.
-
The colonization factor CS6 of enterotoxigenic Escherichia coli contributes to host cell invasion.Microb Pathog. 2024 May;190:106636. doi: 10.1016/j.micpath.2024.106636. Epub 2024 Mar 29. Microb Pathog. 2024. PMID: 38556103
-
HldE Is Important for Virulence Phenotypes in Enterotoxigenic Escherichia coli.Front Cell Infect Microbiol. 2018 Aug 7;8:253. doi: 10.3389/fcimb.2018.00253. eCollection 2018. Front Cell Infect Microbiol. 2018. PMID: 30131942 Free PMC article.
-
Colonization factors of enterotoxigenic Escherichia coli.Adv Appl Microbiol. 2015;90:155-97. doi: 10.1016/bs.aambs.2014.09.003. Epub 2014 Nov 12. Adv Appl Microbiol. 2015. PMID: 25596032 Review.
-
Review on pathogenicity mechanism of enterotoxigenic Escherichia coli and vaccines against it.Microb Pathog. 2018 Apr;117:162-169. doi: 10.1016/j.micpath.2018.02.032. Epub 2018 Feb 21. Microb Pathog. 2018. PMID: 29474827 Review.
Cited by
-
Identification, Characterization, and Virulence Gene Expression of Marine Enterobacteria in the Upper Gulf of Thailand.Microorganisms. 2022 Feb 26;10(3):511. doi: 10.3390/microorganisms10030511. Microorganisms. 2022. PMID: 35336087 Free PMC article.
-
Evaluation of Bile Salts on the Survival and Modulation of Virulence of Aliarcobacter butzleri.Antibiotics (Basel). 2023 Aug 30;12(9):1387. doi: 10.3390/antibiotics12091387. Antibiotics (Basel). 2023. PMID: 37760684 Free PMC article.
-
Long-read-sequenced reference genomes of the seven major lineages of enterotoxigenic Escherichia coli (ETEC) circulating in modern time.Sci Rep. 2021 Apr 29;11(1):9256. doi: 10.1038/s41598-021-88316-2. Sci Rep. 2021. PMID: 33927221 Free PMC article.
-
Exploring Biofilm-Related Traits and Bile Salt Efficacy as Anti-Biofilm Agents in MDR Acinetobacter baumannii.Antibiotics (Basel). 2024 Sep 13;13(9):880. doi: 10.3390/antibiotics13090880. Antibiotics (Basel). 2024. PMID: 39335053 Free PMC article.
-
The Controlled Human Infection Model for Enterotoxigenic Escherichia coli.Curr Top Microbiol Immunol. 2024;445:189-228. doi: 10.1007/82_2021_242. Curr Top Microbiol Immunol. 2024. PMID: 34669040 Review.
References
Publication types
MeSH terms
Substances
Grants and funding
LinkOut - more resources
Full Text Sources
