. 2019 Mar;3(3):363-373.
doi: 10.1038/s41559-018-0769-y. Epub 2019 Jan 14.

A systems approach reveals urban pollinator hotspots and conservation opportunities

Affiliations

A systems approach reveals urban pollinator hotspots and conservation opportunities

Katherine C R Baldock et al. Nat Ecol Evol. 2019 Mar.

Abstract

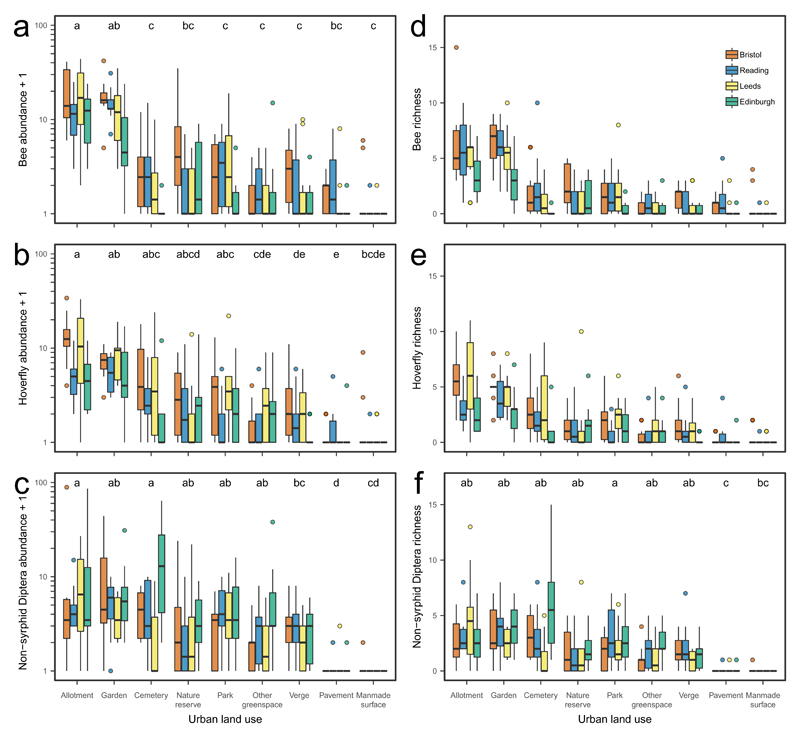
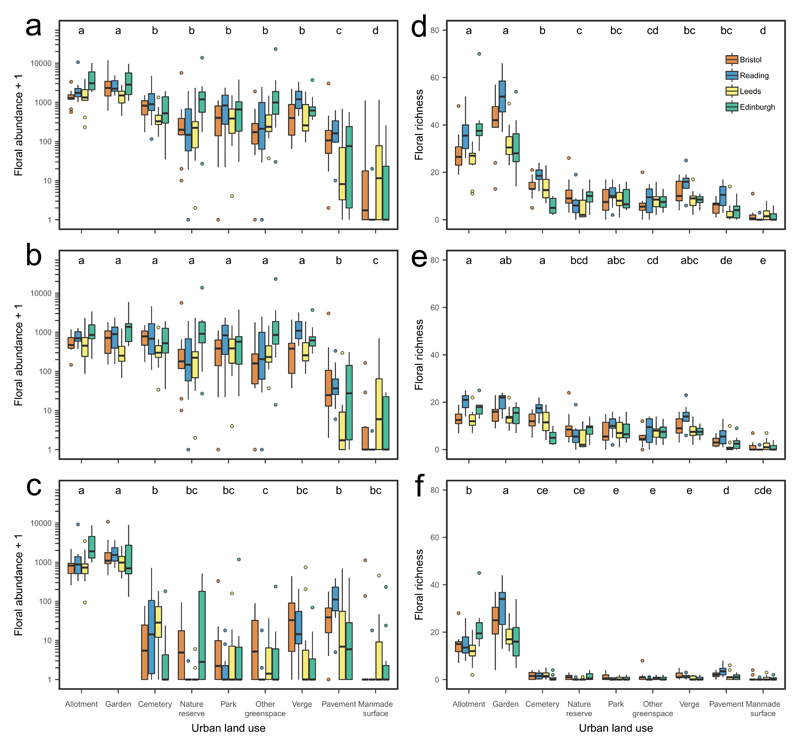
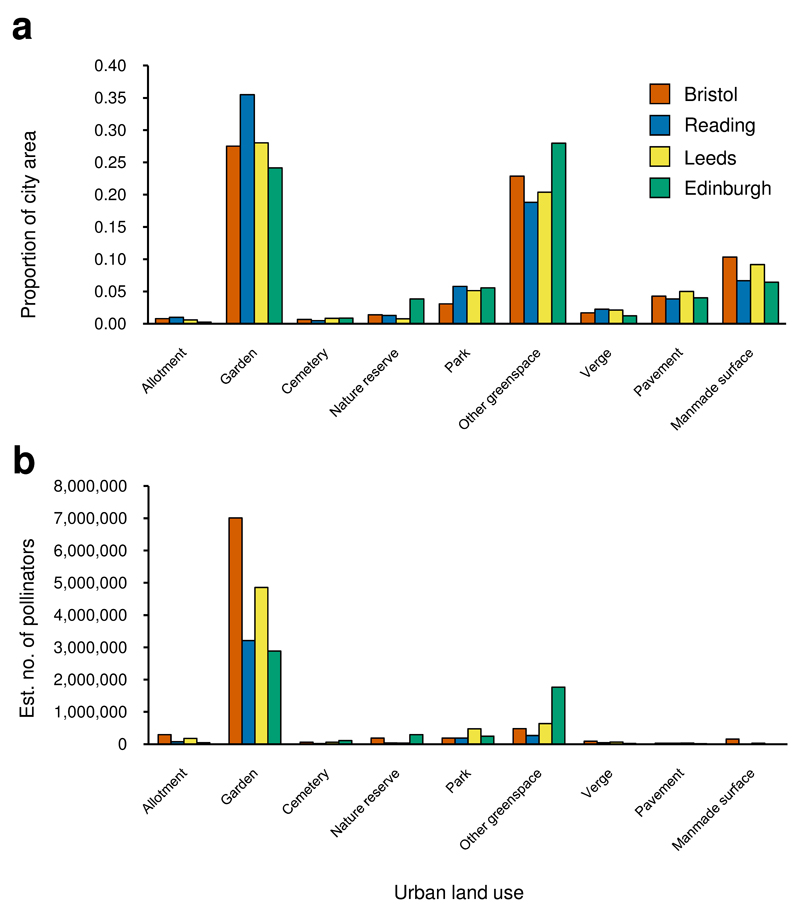
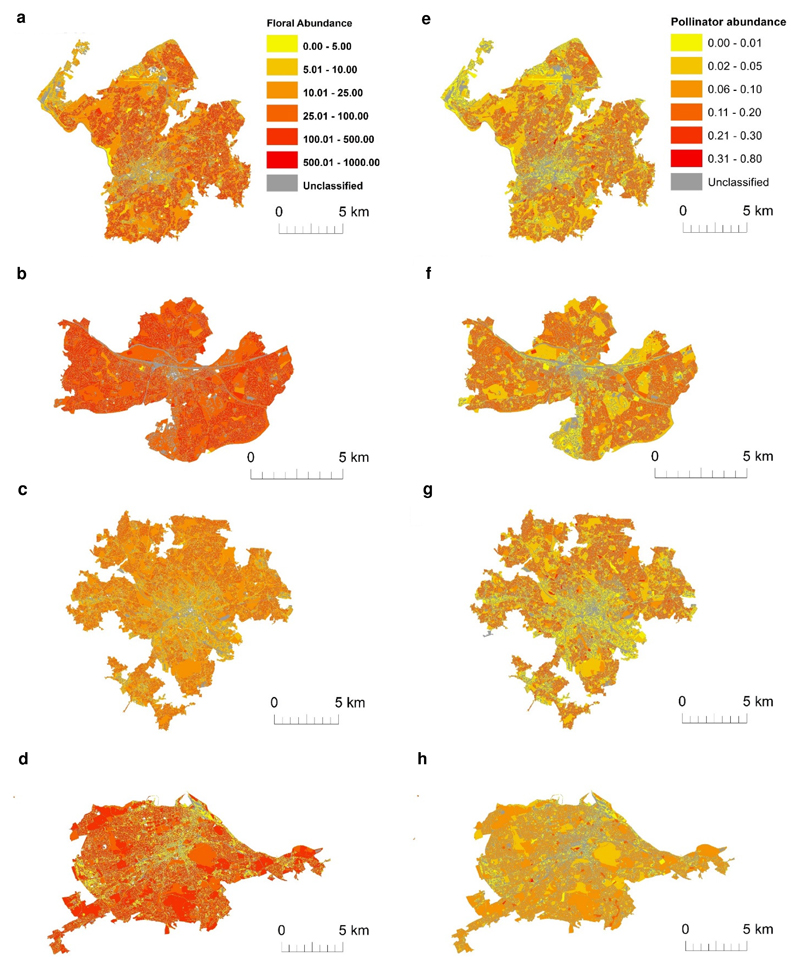
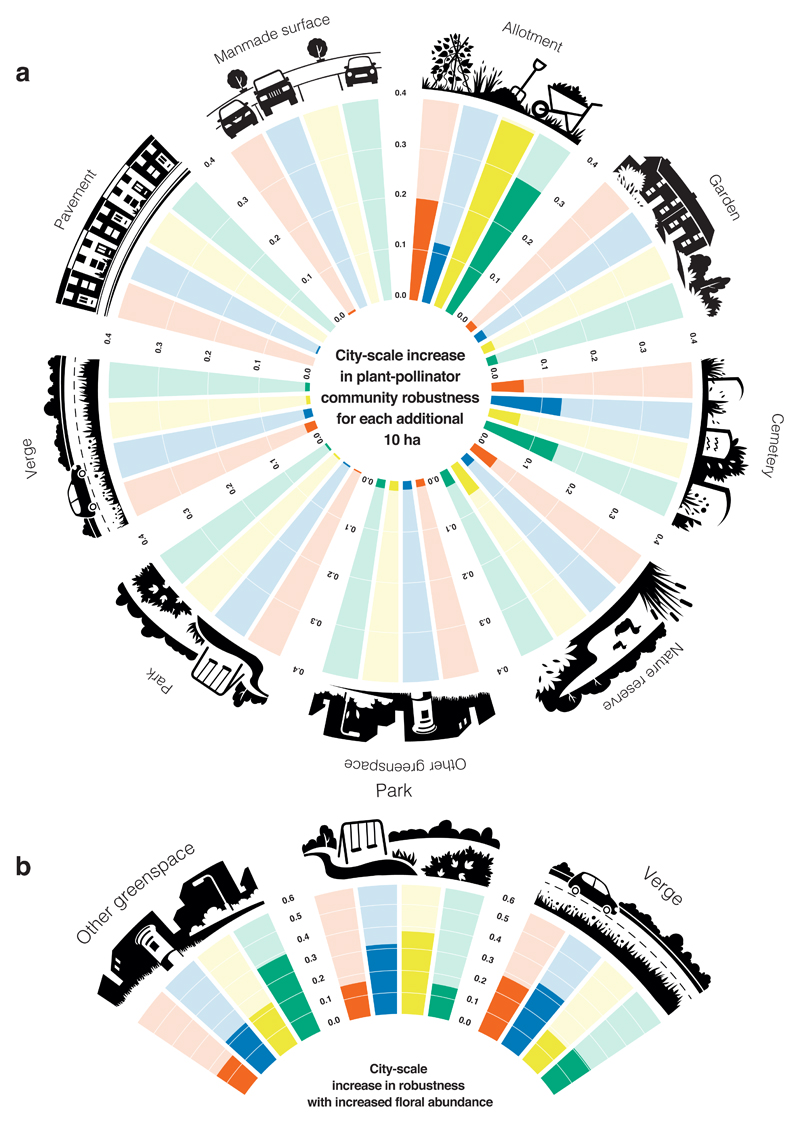
Urban areas are often perceived to have lower biodiversity than the wider countryside, but a few small-scale studies suggest that some urban land uses can support substantial pollinator populations. We present a large-scale, well-replicated study of floral resources and pollinators in 360 sites incorporating all major land uses in four British cities. Using a systems approach, we developed Bayesian network models integrating pollinator dispersal and resource switching to estimate city-scale effects of management interventions on plant-pollinator community robustness to species loss. We show that residential gardens and allotments (community gardens) are pollinator 'hotspots': gardens due to their extensive area, and allotments due to their high pollinator diversity and leverage on city-scale plant-pollinator community robustness. Household income was positively associated with pollinator abundance in gardens, highlighting the influence of socioeconomic factors. Our results underpin urban planning recommendations to enhance pollinator conservation, using increasing city-scale community robustness as our measure of success.


Conflict of interest statement

Competing interests

The authors declare no competing financial interests.

Figures

Figure 1
Figure 1. Pollinator abundance and richness for the nine urban land uses in four cities.
Box and whisker plots of the raw data for a-c log10 (x+1) pollinator abundance, d-f pollinator richness for (a, d) bees, (b, e) hoverflies and (c, f) non-syrphid Diptera. Significantly different land uses are indicated by different letters (Tukey multiple comparisons tests). See Supplementary Tables 3-5 for GLMM results and Tukey post hoc pairwise comparisons for all pollinator groups. Plots show the median, 25th and 75th percentiles (lower and upper hinges), trimmed ranges that extend from the hinges to the lowest and highest values within 1.5× inter-quartile range of the hinge (lower and upper whiskers) plus outliers (filled circles).
Figure 2
Figure 2. Floral abundance and richness for the nine urban land uses in four cities.
Box and whisker plots of the raw data for a-c log10 (x+1) floral abundance, d-f floral richness for all plant taxa (a, d), native plant taxa (b, e) and non-native plant taxa (c, f). Significantly different land uses are indicated by different letters (Tukey multiple comparisons tests). See Supplementary Table 6 for GLMM results and Tukey post hoc pairwise comparisons for all analyses. Plots show the median, 25th and 75th percentiles (lower and upper hinges), trimmed ranges that extend from the hinges to the lowest and highest values within 1.5× inter-quartile range of the hinge (lower and upper whiskers) plus outliers (filled circles).
Figure 3
Figure 3. Land use proportions and estimated numbers of pollinators per land use at a city scale for four cities.
a, Proportions of sampled land uses and b, estimated numbers of pollinators per land use at a city scale. See Supplementary Fig. 5 for equivalent graphs for bees, hoverflies and non-syrphid Diptera. Note that in a proportions for each city do not sum to 1.00 as other non-sampled land uses (buildings, roads, railways, water) were also present; for proportions of all sampled and non-sampled land uses in each city see Supplementary Table 1.
Figure 4
Figure 4. Heat maps of estimated city-scale floral and pollinator abundances.
Estimated a-d floral abundances (measured as floral units per m2) and e-h pollinator abundances (individuals per m2) across the four cities. ‘Unclassified’ denotes land uses that were not sampled and comprises roads, buildings, railways and water. High resolution versions of these maps are available for download as Supplementary files (Supplementary Figs. 3 & 4). Crown copyright and database rights 2018 Ordnance Survey (100025252).
Figure 5
Figure 5. Predicted increase in city-scale plant-pollinator network robustness for two management strategies.
a, City-scale network robustness increase per 10 ha of additional land area when each land use is increased by 25% of its original area. See Supplementary Table 9 for equivalent robustness values for land use area increases of 50% and 75%. b, Maximum increase in city-scale network robustness following simulated increases in floral abundances of Bellis perennis, Taraxacum spp. and Trifolium repens for parks, other greenspaces and road verges. Bristol: red, Reading: blue, Leeds: yellow, Edinburgh: green

References

    1. Dicks LV, et al. Ten policies for pollinators. Science. 2016;354:975–976. - PubMed
    1. Potts SG, et al. Safeguarding pollinators and their values to human well-being. Nature. 2016;540:220–229. - PubMed
    1. Potts SG, Imperatriz-Fonseca VL, Ngo HT, editors. IPBES. The Assessment Report of the Intergovernmental Science-Policy Platform on Biodiversity and Ecosystem Services on Pollinators, Pollination and Food Production. Secretariat of the Intergovernmental Science-Policy Platform on Biodiversity and Ecosystem Services; 2016.
    1. Ollerton J, Erenler H, Edwards M, Crockett R. Extinctions of aculeate pollinators in Britain and the role of large-scale agricultural changes. Science. 2014;346:1360–1362. - PubMed
    1. Knop E, et al. Artificial light as a new threat to pollination. Nature. 2017;548:206. - PubMed

Publication types