Meta-Analysis
. 2019 Feb;51(2):237-244.
doi: 10.1038/s41588-018-0307-5. Epub 2019 Jan 14.

Association studies of up to 1.2 million individuals yield new insights into the genetic etiology of tobacco and alcohol use

Mengzhen Liu  1 Yu Jiang  2   3 Robbee Wedow  4   5   6 Yue Li  7   8 David M Brazel  4   9   10 Fang Chen  2   3 Gargi Datta  1 Jose Davila-Velderrain  7   8 Daniel McGuire  2   3 Chao Tian  11 Xiaowei Zhan  12   13 23andMe Research TeamHUNT All-In PsychiatryHélène Choquet  14 Anna R Docherty  15   16 Jessica D Faul  17 Johanna R Foerster  18 Lars G Fritsche  18 Maiken Elvestad Gabrielsen  19 Scott D Gordon  20 Jeffrey Haessler  21 Jouke-Jan Hottenga  22 Hongyan Huang  23   24 Seon-Kyeong Jang  1 Philip R Jansen  25   26 Yueh Ling  2   9 Reedik Mägi  27 Nana Matoba  28 George McMahon  29 Antonella Mulas  30 Valeria Orrù  30 Teemu Palviainen  31 Anita Pandit  18 Gunnar W Reginsson  32 Anne Heidi Skogholt  19 Jennifer A Smith  17   33 Amy E Taylor  29 Constance Turman  23   24 Gonneke Willemsen  22 Hannah Young  1 Kendra A Young  34 Gregory J M Zajac  18 Wei Zhao  33 Wei Zhou  35 Gyda Bjornsdottir  32 Jason D Boardman  4   5   6 Michael Boehnke  18 Dorret I Boomsma  22 Chu Chen  21 Francesco Cucca  30 Gareth E Davies  36 Charles B Eaton  37 Marissa A Ehringer  4   38 Tõnu Esko  8   27 Edoardo Fiorillo  30 Nathan A Gillespie  15   20 Daniel F Gudbjartsson  32   39 Toomas Haller  27 Kathleen Mullan Harris  40   41 Andrew C Heath  42 John K Hewitt  4   43 Ian B Hickie  44 John E Hokanson  34 Christian J Hopfer  4   45 David J Hunter  23   24   46 William G Iacono  1 Eric O Johnson  47 Yoichiro Kamatani  28 Sharon L R Kardia  33 Matthew C Keller  4   43 Manolis Kellis  7   8 Charles Kooperberg  21 Peter Kraft  23   24   48 Kenneth S Krauter  4   9 Markku Laakso  49   50 Penelope A Lind  51 Anu Loukola  31 Sharon M Lutz  52 Pamela A F Madden  42 Nicholas G Martin  20 Matt McGue  1 Matthew B McQueen  4   38 Sarah E Medland  51 Andres Metspalu  27 Karen L Mohlke  53 Jonas B Nielsen  54 Yukinori Okada  28   55 Ulrike Peters  21   56 Tinca J C Polderman  25 Danielle Posthuma  25   57 Alexander P Reiner  21   56 John P Rice  58 Eric Rimm  24   59 Richard J Rose  60 Valgerdur Runarsdottir  61 Michael C Stallings  4   43 Alena Stančáková  49 Hreinn Stefansson  32 Khanh K Thai  14 Hilary A Tindle  62 Thorarinn Tyrfingsson  61 Tamara L Wall  63 David R Weir  17 Constance Weisner  14 John B Whitfield  20 Bendik Slagsvold Winsvold  64 Jie Yin  14 Luisa Zuccolo  29   65 Laura J Bierut  58 Kristian Hveem  19   66   67 James J Lee  1 Marcus R Munafò  65   68 Nancy L Saccone  69 Cristen J Willer  35   54   70 Marilyn C Cornelis  71 Sean P David  72 David A Hinds  11 Eric Jorgenson  14 Jaakko Kaprio  31   73 Jerry A Stitzel  4   38 Kari Stefansson  32   74 Thorgeir E Thorgeirsson  32 Gonçalo Abecasis  18 Dajiang J Liu  75   76 Scott Vrieze  77
Collaborators, Affiliations
Meta-Analysis

Association studies of up to 1.2 million individuals yield new insights into the genetic etiology of tobacco and alcohol use

Mengzhen Liu et al. Nat Genet. 2019 Feb.

Abstract

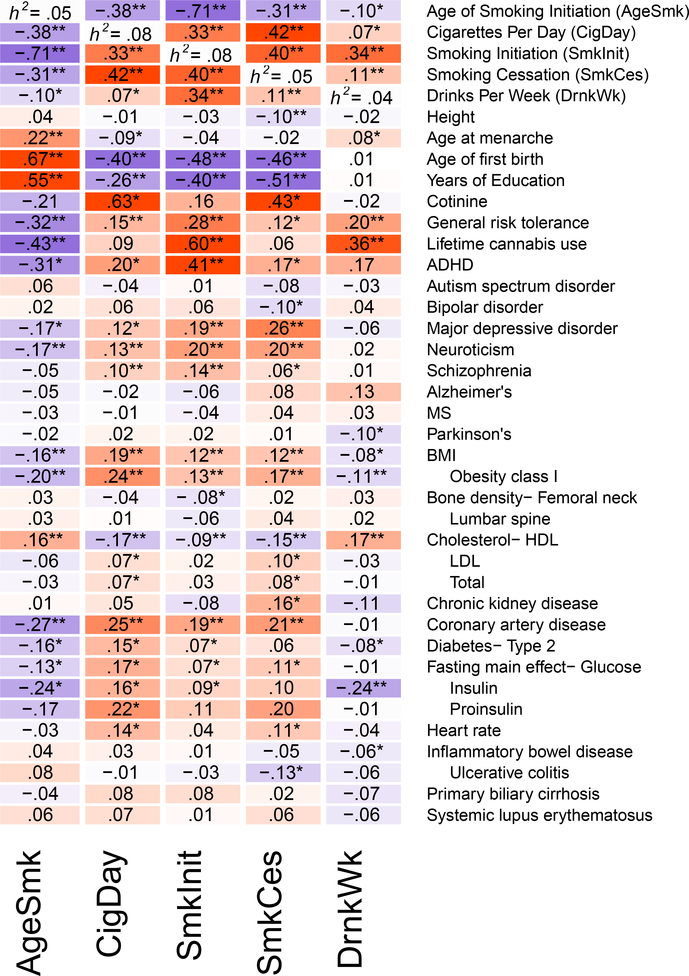
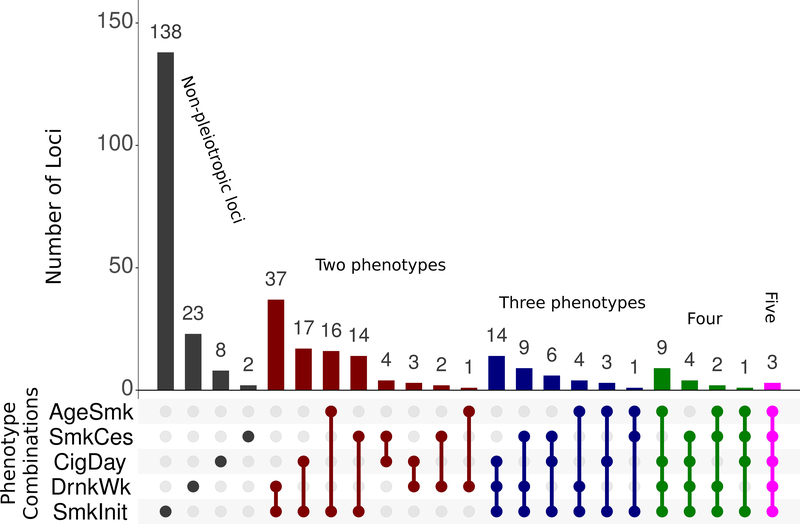
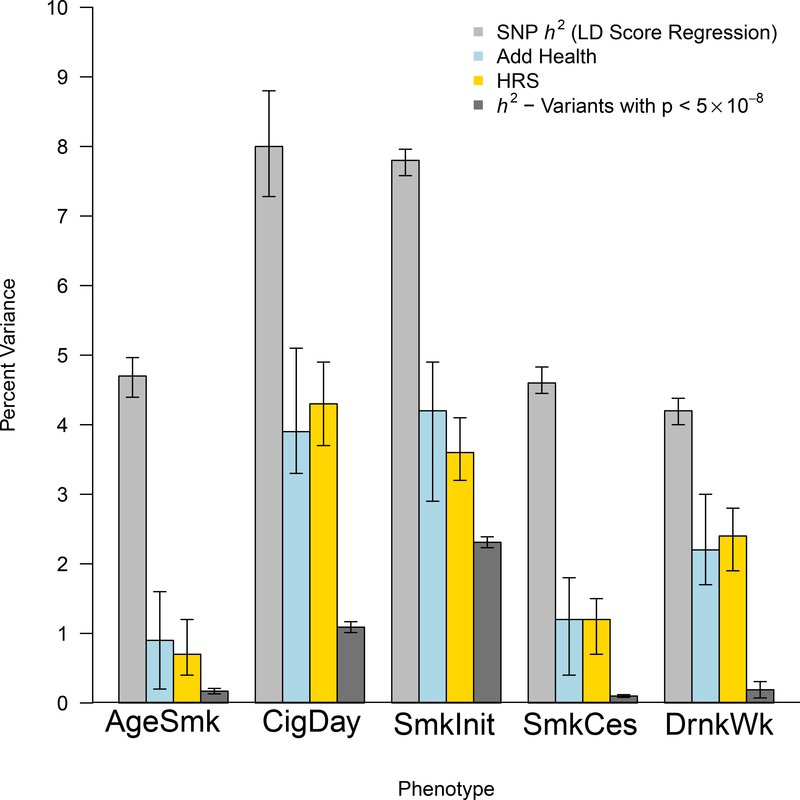
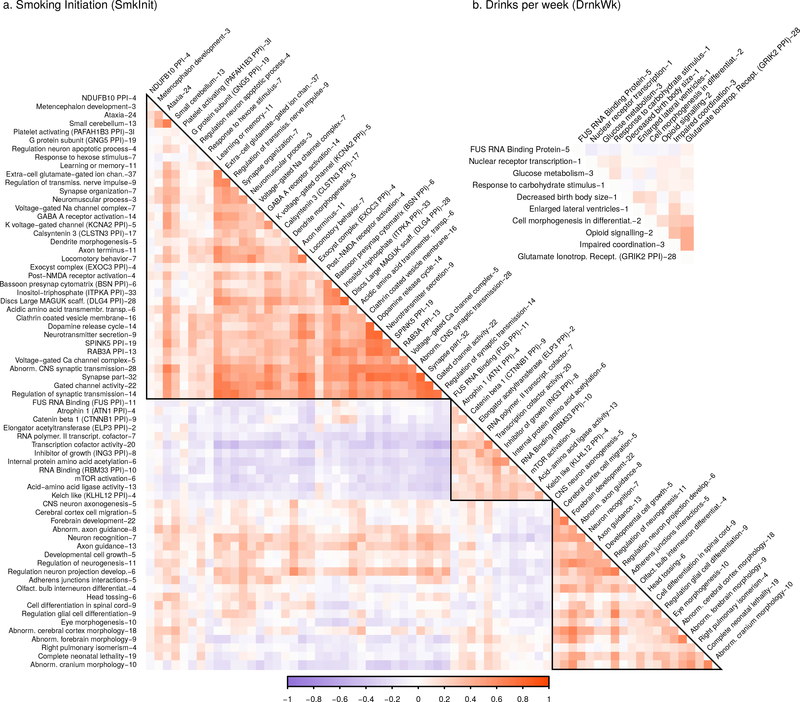
Tobacco and alcohol use are leading causes of mortality that influence risk for many complex diseases and disorders1. They are heritable2,3 and etiologically related4,5 behaviors that have been resistant to gene discovery efforts6-11. In sample sizes up to 1.2 million individuals, we discovered 566 genetic variants in 406 loci associated with multiple stages of tobacco use (initiation, cessation, and heaviness) as well as alcohol use, with 150 loci evidencing pleiotropic association. Smoking phenotypes were positively genetically correlated with many health conditions, whereas alcohol use was negatively correlated with these conditions, such that increased genetic risk for alcohol use is associated with lower disease risk. We report evidence for the involvement of many systems in tobacco and alcohol use, including genes involved in nicotinic, dopaminergic, and glutamatergic neurotransmission. The results provide a solid starting point to evaluate the effects of these loci in model organisms and more precise substance use measures.


Conflict of interest statement

COMPETING INTERESTS STATEMENT: Laura J. Bierut and the spouse of Nancy L. Saccone are listed as inventors on Issued U.S. Patent 8,080,371, “Markers for Addiction” covering the use of certain SNPs in determining the diagnosis, prognosis, and treatment of addiction. Sean David is a scientific advisor to BaseHealth, Inc. Gyda Bjornsdottir, Daniel F. Gudbjartsson, Gunnar W. Reginsson, Hreinn Stefansson, Kari Stefansson, and Thorgeir E. Thorgeirsson are employees of deCODE Genetics/AMGEN, Inc. Chao Tian and David Hinds are employees of 23andMe, Inc.

Figures

Figure 1.
Figure 1.. Genetic correlations between substance use phenotypes and phenotypes from other large genome-wide association studies.
Genetic correlations between each of the phenotypes are shown in the first 5 rows, with heritability estimates displayed down the diagonal. All genetic correlations and heritability estimates were calculated using LD Score Regression. Blue shading represents negative genetic correlations, and red shading represents positive correlations, with increasing color intensity reflecting increasing strength of a correlation. A single asterisk reflects significant genetic correlations at the p<.05 level. Double asterisks reflect significant genetic correlations at the Bonferroni-correction p<.000278 level (corrected for 180 independent tests). Note that SmkCes was oriented such that higher scores reflected current smoking, and for AgeSmk lower scores reflect earlier ages of initiation, both of which are typically associated with negative outcomes. AgeSmk=Age of Initiation of Smoking; CigDay=Cigarettes per Day; SmkInit=Smoking Initiation; SmkCes=Smoking Cessation; DrnkWk=Drinks per Week.
Figure 2.
Figure 2.. Pleiotropy.
Depicted here are results from the multivariate analysis of pleiotropy. For each locus, the method returns the best fitting solution of which phenotypes were associated with that locus. All loci with one or more associated phenotypes are shown here. For example, every locus associated with AgeSmk was found to be pleiotropic for other phenotypes (green, blue, red, purple, and fuchsia bars), and no locus showed association with only AgeSmk (no dark grey bar for AgeSmk). When sample sizes are unequal across phenotypes, the method also improves power for those phenotypes with smaller samples. The total number of loci associated with each trait (whether pleiotropic or not) from these analyses was 40 (AgeSmk), 48 (SmkCes), 72 (CigDay), 111 (DrnkWk), and 278 (SmkInit). Full information is in Supplementary Table 11.
Figure 3.
Figure 3.. Heritability and polygenic prediction.
The light gray bars reflect SNP heritability, estimated with LD Score Regression. The light blue and gold bars reflect the predictive power of polygenic risk scores in Add Health and the Health and Retirement Study (HRS), respectively. Despite the 41-year generational gap between participants from these two studies, and major tobacco-related policy changes during that time, the polygenic scores are similarly predictive in both samples. Error bars are 95% confidence intervals estimated with 1000 bootstrapped repetitions. Dark gray bars represent the total phenotypic variance explained by only genome-wide significant SNPs. H2=heritability.
Figure 4.
Figure 4.. Correlations among exemplary DEPICT gene sets.
There were 68 clusters available for Smoking initiation and 10 for Drinks Per Week (CigDay, AgeSmk, and SmkCes did not have > 1 exemplary sets.) Blue shading represents positive correlations, and red shading represents negative correlations, with increasing color intensity reflecting increasing strength of a correlation. Cluster names are truncated for space, with a full list of all names in Supplementary Table 18. The number after each name is the number of gene sets in each cluster. The matrix naturally falls into three blue superclusters along the diagonal. The largest supercluster contains primarily gene sets related to neurotransmitter receptors, ion channels (sodium, potassium, calcium), learning/memory, and other aspects of CNS function. The middle supercluster includes gene sets defined by regulation of transcription and translation, including RNA binding and transcription factor activity. The final supercluster is composed primarily of gene sets related to development of the nervous system.

References

    1. Ezzati M et al. Selected major risk factors and global and regional burden of disease. Lancet 360, 1347–1360 (2002). - PubMed
    1. Hicks BM,Schalet BD, Malone SM,Iacono WG & McGue M Psychometric and genetic architecture of substance use disorder and behavioral disinhibition measures for gene association studies. Behavior Genetics 41, 459–75 (2011). - PMC - PubMed
    1. Polderman TJ et al. Meta-analysis of the heritability of human traits based on fifty years of twin studies. Nat Genet (2015). - PubMed
    1. Kendler KS, Schmitt E, Aggen SH & Prescott CA Genetic and environmental influences on alcohol, caffeine, cannabis, and nicotine use from early adolescence to middle adulthood. Arch Gen Psychiatry 65, 674–82 (2008). - PMC - PubMed
    1. Kendler KS, Prescott CA, Myers J & Neale MC The structure of genetic and environmental risk factors for common psychiatric and substance use disorders in men and women. Archives of General Psychiatry 60, 929–937 (2003). - PubMed

METHODS ONLY REFERENCES

    1. Das S et al. Next-generation genotype imputation service and methods. Nat Genet (2016). - PMC - PubMed
    1. Howie B, Fuchsberger C, Stephens M, Marchini J & Abecasis GR Fast and accurate genotype imputation in genome-wide association studies through pre-phasing. Nature Genetics 44, 955−+ (2012).f - PMC - PubMed
    1. Zhan X, Hu Y, Li B, Abecasis GR & Liu DJ RVTESTS: an efficient and comprehensive tool for rare variant association analysis using sequence data. Bioinformatics 32, 1423–6 (2016). - PMC - PubMed
    1. Kang HM et al. Variance component model to account for sample structure in genome-wide association studies. Nat Genet 42, 348–54 (2010). - PMC - PubMed
    1. Price AL et al. Principal components analysis corrects for stratification in genome-wide association studies. Nature Genetics 38, 904–909 (2006). - PubMed

Publication types

Grants and funding