. 2019 Feb;20(2):218-231.
doi: 10.1038/s41590-018-0280-2. Epub 2019 Jan 14.

Regulatory T cells mediate specific suppression by depleting peptide-MHC class II from dendritic cells

Affiliations

Regulatory T cells mediate specific suppression by depleting peptide-MHC class II from dendritic cells

Billur Akkaya et al. Nat Immunol. 2019 Feb.

Abstract

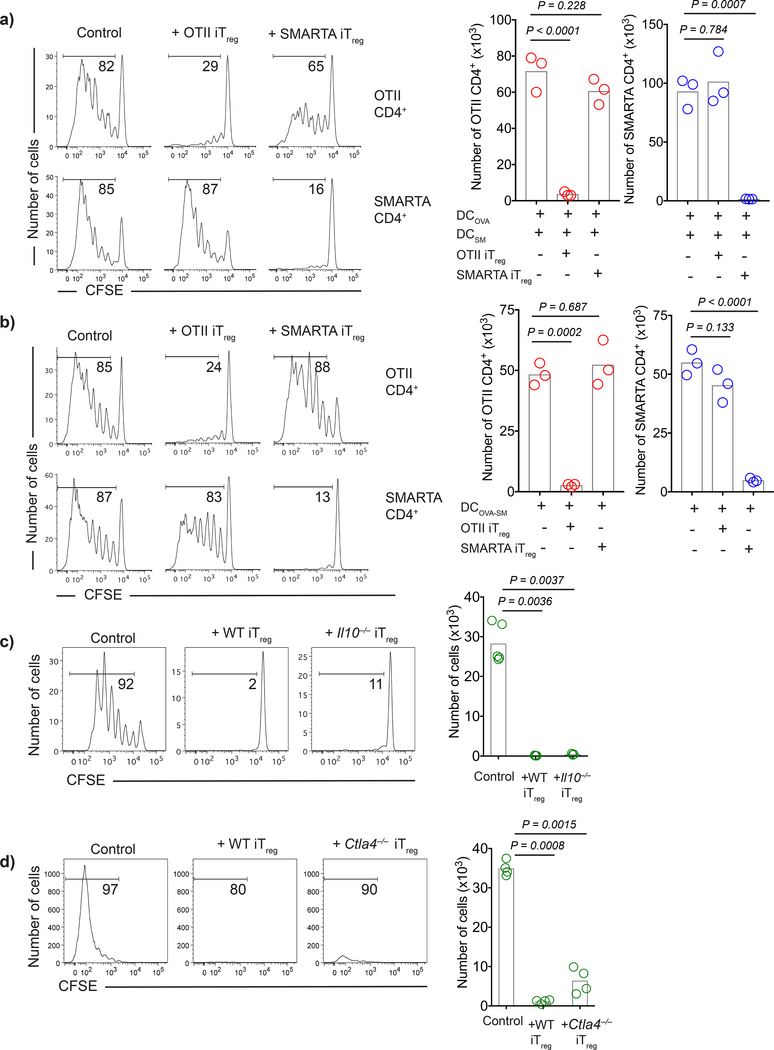
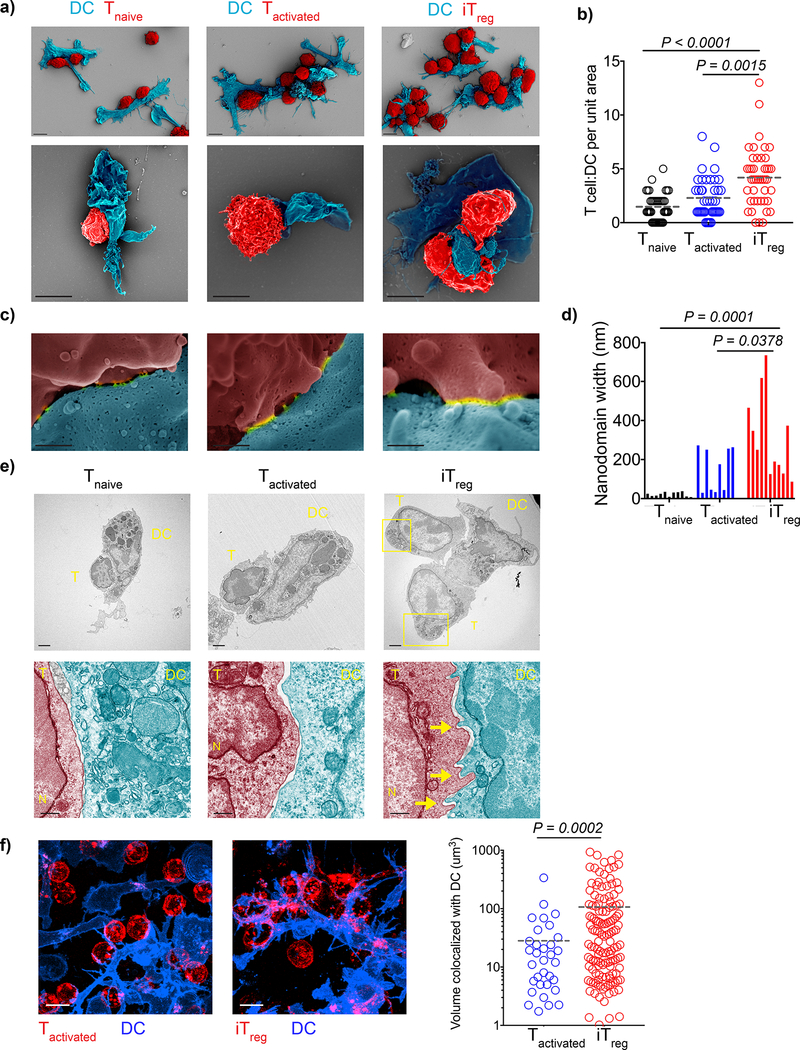
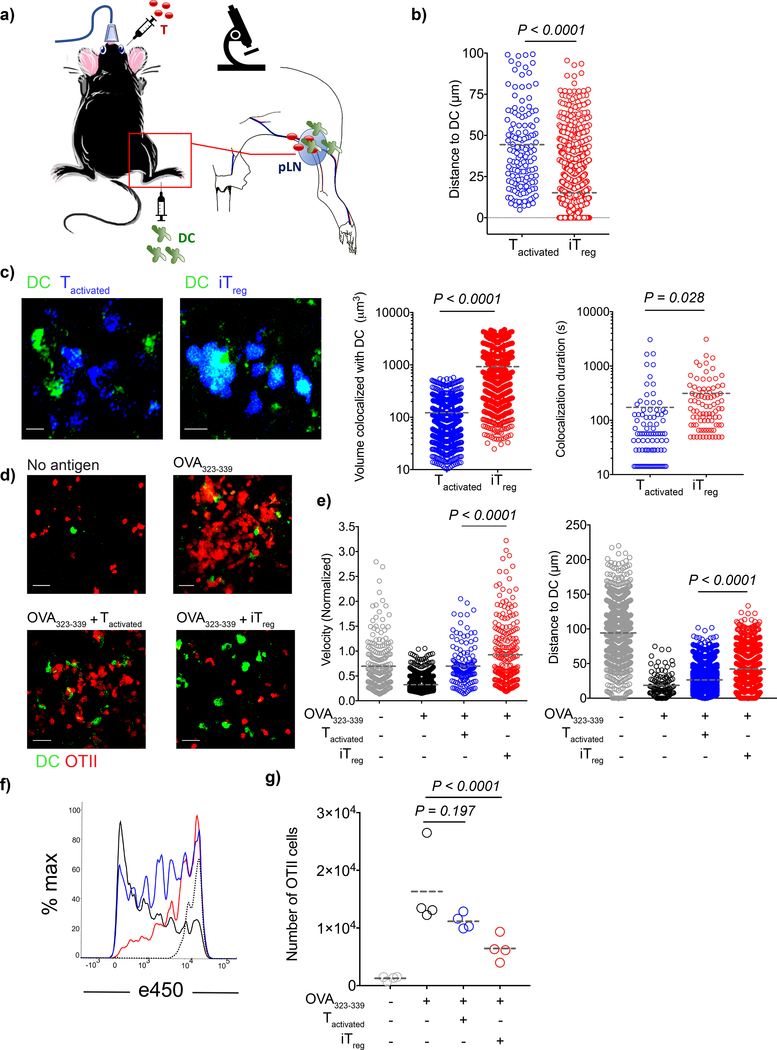
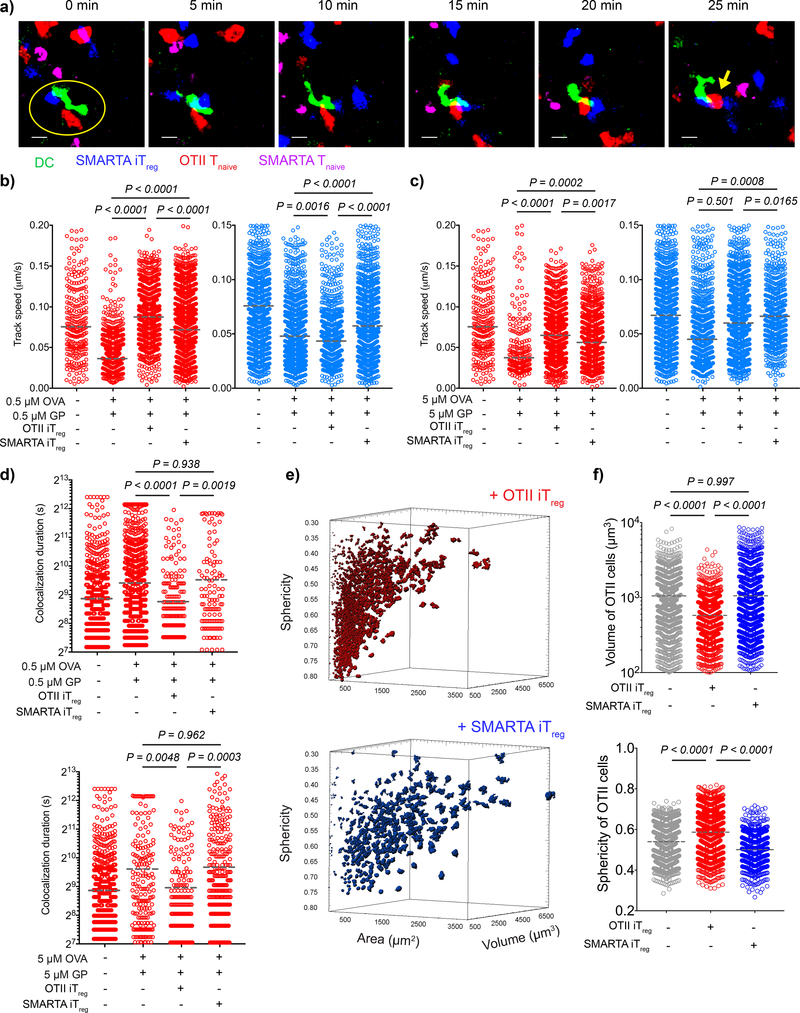
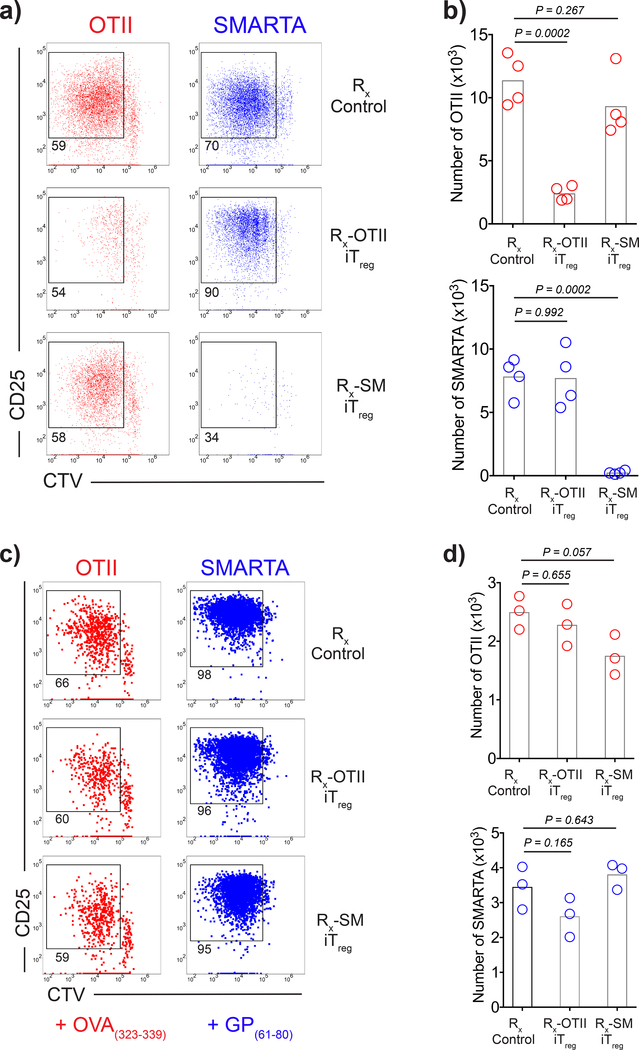
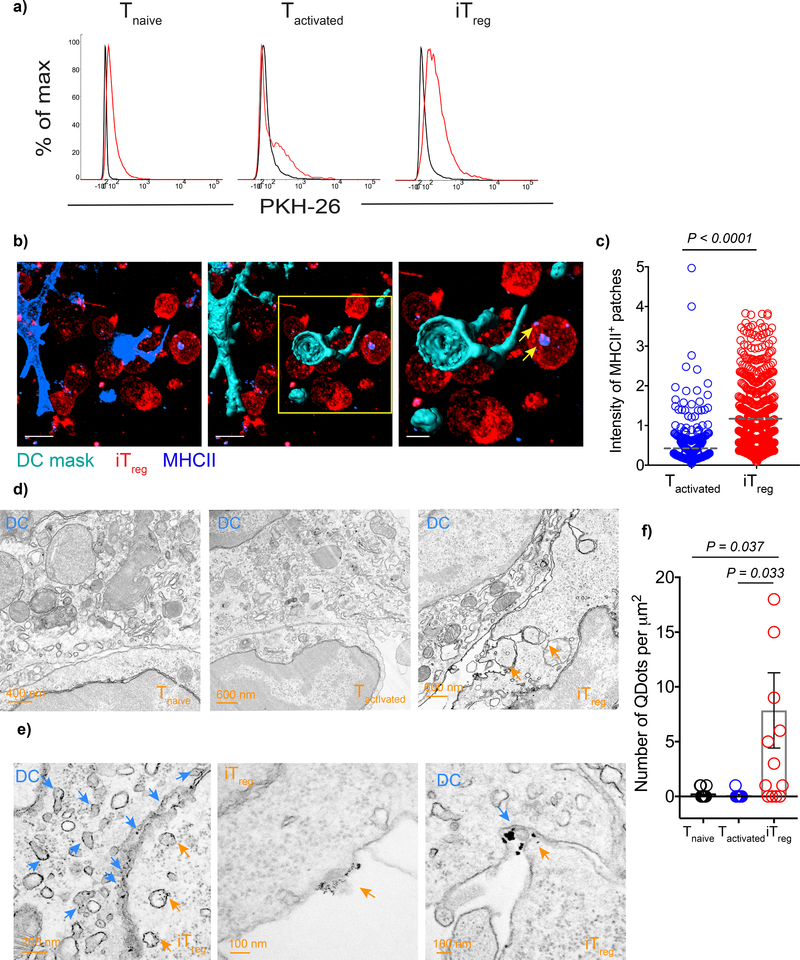
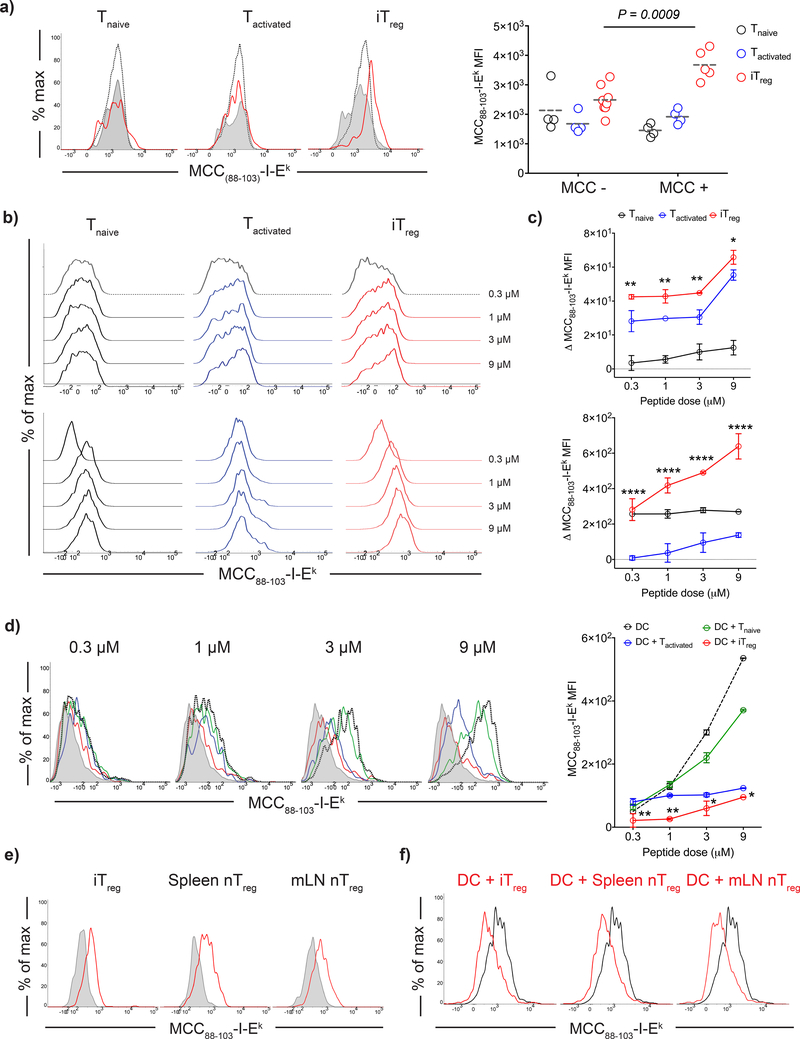
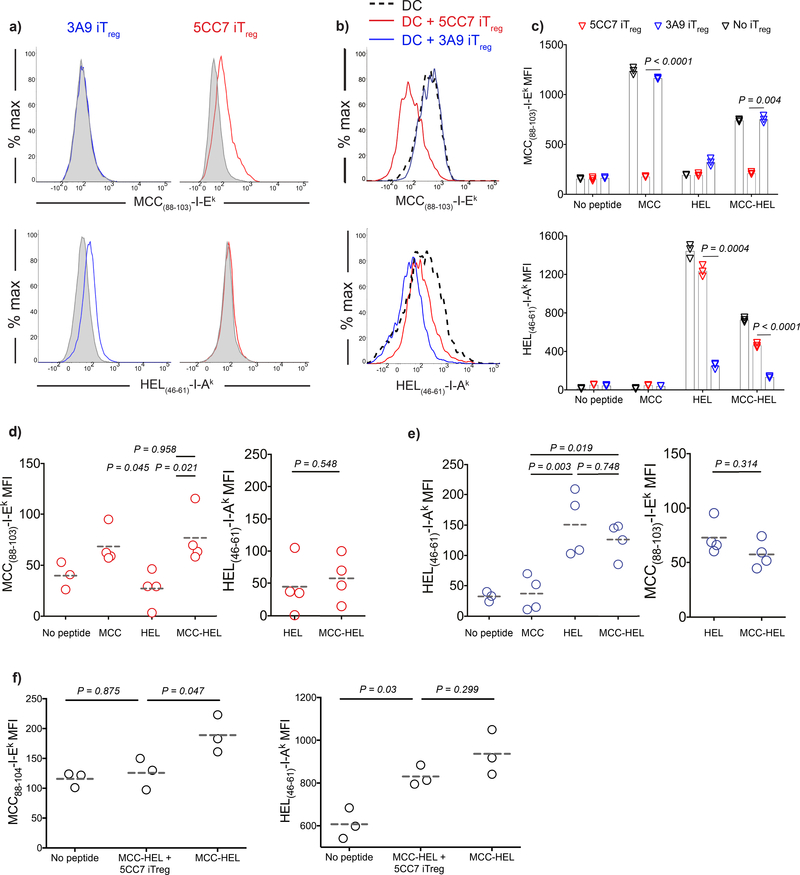
Regulatory T cells (Treg cells) can activate multiple suppressive mechanisms in vitro after activation via the T cell antigen receptor, resulting in antigen-independent suppression. However, it remains unclear whether similar pathways operate in vivo. Here we found that antigen-specific Treg cells activated by dendritic cells (DCs) pulsed with two antigens suppressed conventional naive T cells (Tnaive cells) specific for both cognate antigens and non-cognate antigens in vitro but suppressed only Tnaive cells specific for cognate antigen in vivo. Antigen-specific Treg cells formed strong interactions with DCs, resulting in selective inhibition of the binding of Tnaive cells to cognate antigen yet allowing bystander Tnaive cell access. Strong binding resulted in the removal of the complex of cognate peptide and major histocompatibility complex class II (pMHCII) from the DC surface, reducing the capacity of DCs to present antigen. The enhanced binding of Treg cells to DCs, coupled with their capacity to deplete pMHCII, represents a novel pathway for Treg cell-mediated suppression and may be a mechanism by which Treg cells maintain immune homeostasis.


Conflict of interest statement

Competing interests

The authors declare no competing interests

Figures

Figure 1:
Figure 1:
Antigen-specific iTregs suppress Tnaive cells with identical antigen specificity regardless of CTLA-4 expression or IL-10 production. a-b) C57BL/6 DCs were loaded with 3 μM OVA323–339 (DCOVA), LCMV GP61–80 (DCGP) or both peptides (DCOVA-GP). CFSE labeled naive OT-II (1×10⁶) and SMARTA (1×10⁶) cells were transferred i.v. into CD45.1 mice with DCs (5×10⁵) and iTregs (2×10⁶). Histograms demonstrate day 3 post-transfer proliferation status of Thy1.1 OT-II and Thy1.1+ SMARTA cells upon co-transfer with 1:1 mixture of DCOVA and DCGP (a) or DCOVA-GP (b). Graphs show the number of CFSElow proliferating cells. c-d) B10.A DCs were pulsed with 3 μM PCC88–104. CD45.1+ CFSE labeled 5CC7 Tnaive (1×10⁶) were transferred i.v. into B10.A mice together with DCs (5×10⁵) and WT, Il10–/– or Ctla4–/– 5CC7 iTregs (2×10⁶). Histograms demonstrate the day 3 post-transfer proliferation states, graphs show the number of CFSElow 5CC7 T cells. Bars indicate the means of n=3 mice, data are representative of two (c,d) or three (a,b) independent experiments. P values were calculated using one-way ANOVA with Dunnett’s multiple comparison test.
Figure 2:
Figure 2:
Antigen-specific iTregs have unique binding morphology and stoichiometry. a-d) OVA323–339 pulsed splenic DCs (4 × 10⁴) were co-cultured 1:1 with OT-II Tnaive, OT-II Tactivated or OT-II iTregs for 3 h and visualized by SEM. a) Representative images of T-DC clusters (Scale bar: 5 μm). b) Images were collected from a total of 40 DCs, graph shows the number of T cells bound per DC. Lines mark the means of n=40 DCs obtained from n=2 biological replicates per experiment. Data are representative of two independent experiments. c) SEM images of the DC-T cell binding sites which reveal membrane fusion domains (nanodomains) (Scale bar: 300 nm). d) n=2 biological replicates were screened to collect images of 9–11 fusion sites per group. Bars demonstrate individual measurements pooled from the replicates, data represent three independent experiments. e) OVA323–339 pulsed DCs (2 × 10⁵) were co-cultured 1:1 with OT-II Tnaive, OT-II Tactivated or OT-II iTreg on for 3 h and imaged with TEM. Yellow rectangles and arrows mark the uropods and filopodia respectively. Scale bars for images are upper: 2 μm, lower: 500 nm. Images are representative of three independent experiments with similar results. f) OVA323–339 pulsed DCs (2 × 10⁵) were co-cultured 1:1 with OT-II Tactivated or OT-II iTreg for 3h and imaged for real time interactions (CD4: Red, CD11c: Blue). Graph shows the 3D volume of T-DC contact site that was derived from time dependent colocalization analysis. Lines mark the mean of individual data points pooled from n=2 biological replicates. Data are representative of five independent experiments with similar results. P values were calculated using Kruskal-Wallis (b), one-way ANOVA (d), two-sided Welch’s t-test (f).
Figure 3:
Figure 3:
Antigen specific iTregs, but not Tactivated, form compact clusters around DCs and inhibit Tnaive cell priming. a-e) CD11c-YFP DCs (2 × 10⁶) were loaded with 5 μM OVA323–339 and adoptively transferred into C57BL/6 mice via the footpad. Popliteal lymph nodes of the recipient mice were imaged with intravital two photon microscopy at 18–20 h post-transfer. a) Schematic representation of the experiment. b-c) e450-labeled OT-II Tactivated or iTregs (4 × 10⁶) were adoptively transferred. b) Graph shows distance of T cells to the closest DC. Lines mark the means of the cells from one recipient, data are representative of n=4 independent experiments with similar results. c) Images demonstrate the in vivo interaction of Tactivated and iTregs with DCs 18–20 h post-transfer. Graphs are derived from the time dependent colocalization analysis for the dynamic T-DC contact at 20–22 h post-transfer. Lines mark the means of the cells from one recipient, data are representative of n=4 independent experiments with similar results. d-e) C57BL/6 mice received naive OT-II-DsRed cells (5 × 10⁶), naive e670-labeled polyclonal CD4+ T cells (107) with or without e450-labeled OT-II Tactivated or iTreg (107). d) Images demonstrate the position and clustering of naive OT-II-DsRed cells around DCs. e) Tracks of the naive OT-II-DsRed cells and polyclonal CD4+ T cells were analyzed and calculations were performed as described in methods. Lines mark the means of the cells from one recipient, data are representative of n=3 independent experiments with similar results. f-g) DCs were loaded with 5 μM OVA323–339 ex-vivo. DCs (3 × 10⁵) were adoptively transferred into C57BL/6 mice via the footpad. The mice then received naive e450 labeled CD45.1+ OT-II cells (106) with or without OT-II Tactivated or iTregs (4×10⁶) i.v. f) Histograms demonstrate the day 3 post-transfer proliferation status of CD45.1+ OT-II cells when transferred alone (Black), co-transferred with OT-II Tactivated (Blue), or co-transferred with OT-II iTregs (Red). Dotted histogram shows the proliferation status of CD45.1+ OT-II cells in the mice which received unpulsed DCs. g) Number of CD45.1+ OT-II cells in the lymph nodes. Lines mark the mean of n=4 mice, data are representative of three independent experiments. P values were calculated using two-sided student’s t-test (b,c), Kolmogorov-Smirnov (velocity, e), one-way ANOVA with Tukey’s test (distance, e) and with Dunnett’s test (g).
Figure 4:
Figure 4:
Antigen-specific iTregs inhibit the stable contact of T cells and DCs in TCR restricted manner. a-d) Splenic DCs from CD11c-YFP animals were double pulsed with OVA323–339 and LCMV GP61–80 at either 0.5 μM or 5 μM ex-vivo. DCs (2 × 10⁶) were adoptively transferred into C57BL/6 mice via the footpad. The mice then received naive OT-II-DsRed (1.2 × 10⁶), naive e670-labeled SMARTA T cells (1.2 × 10⁶) and e450-labeled OT-II or SMARTA iTregs (4.8 × 10⁶) i.v. Live popliteal lymph node sections were imaged 18 h post-transfer. a) Time series demonstrate the movement and interactions of SMARTA iTregs, OT-II-DsRed Tnaive, SMARTA Tnaive with 5 min intervals. Yellow circle represents the contact with DC. Yellow arrow shows the OT-II Tnaive that had sustained interaction with the DC (Scale bar: 20 μm). b-d) Graphs show the average track speed (b,c) and colocalization duration (d) of OT-II and SMARTA, Lines mark the means of the cells tracked in one recipient, data are representative of n=3 independent experiments with similar results. e-f) DCs (2 × 10⁶) double pulsed with 5 μM OVA323–339 and GP61–80 were adoptively transferred via footpad. Naive OT-II-DsRed T cells (7 × 10⁶) were transferred i.v. together with either e450-labeled OT-II iTreg or SMARTA iTreg (1.4 × 10⁷). Popliteal lymph node sections were imaged 18–20 h post-transfer. Representative demonstration (e) and graphs (f) of 3D surface area, volume and sphericity of OT-II Tnaives. Lines mark the means of the cells from one recipient, data are representative of n=3 independent experiments with similar results. P values were calculated using one-way ANOVA with Tukey’s correction (b,c,d,f-volume) and Kruskal-Wallis (f-sphericity).
Figure 5:
Figure 5:
Antigen-specific iTregs selectively inhibit presentation of cognate antigen. a-b) DCs (4×10⁶) were double-pulsed with 3 μM OVA323–339 and 3 μM LCMV GP61–80 and cultured with CFSE-labeled OT-II iTregs (1.5×10⁶) (Rx-OT-II iTreg), SMARTA iTregs (1.5×10⁶) (Rx-SM iTreg) or alone (Rx-Control) for 18 h; live CFSECD3ε DCs were isolated by FACS sorting. a-b) Sorted DCs (5×10³) were co-cultured with 1:1 mixture of CTV (Cell Tracker Violet) labeled CD45.1+ OT-II (5×10⁴) and SMARTA (5×10⁴) Tnaives for 3 days. a) Flow cytometry plots demonstrate the proliferation status and CD25 expression of Tnaive. b) Graphs show numbers of CFSElow T cells. Bars indicate the means of n=3 biological replicates, data are representative of two independent experiments. c-d) Sorted DCs (5×10³) were pulsed with either OVA323–339 or LCMV GP61–80 and cultured with CTV labeled CD45.1+ OT-II or SMARTA Tnaives (5×10⁴) for 3 days. c) Flow cytometry plots demonstrate the proliferation status and CD25 expression of Tnaive. d) Graphs show numbers of CFSElow T cells. Bars indicate the means of n=3 biological replicates, data are representative of two independent experiments. P values were calculated using one-way ANOVA with Dunnett’s post-test.
Figure 6:
Figure 6:
Antigen-specific iTregs have greater trogocytic capacity. a) DCs were labeled with PKH-26, loaded with 3 μM MCC(88–103) and co-cultured 1:1 with 5CC7 Tnaive, Tactivated or iTregs for 18 h. Histograms show the intensity of PKH-26 on T cells upon co-culture, black: T cells co-cultured with unpulsed DC, red: T cells co-cultured with antigen pulsed DC. Data are representative of three independent experiments that were performed in triplicates. b-c) CD11c-YFP DCs were loaded with 3 μM OVA(323–339) peptide and co-cultured with OT-II Tactivated (CD45.1+) or OT-II iTregs (CD45.1+) for 3 h. b) Representative images showing 3D surfaces created to mask the DCs based on CD11c-YFP intensity. Yellow arrows point to the MHCII+ patches on iTregs. c) Graph shows MHCII intensity of OT-II Tactivated and OT-II iTregs. Lines mark the mean of individual data points pooled from n=2 biological replicates. Data are representative of three independent experiments with similar results. d-f) DCs were loaded with 3 μM MCC(88–103) and co-cultured with 5CC7 Tnaive, Tactivated or iTregs for 3 h. Sections were stained with biotinylated anti-MCC(88–103)-I-Ek antibody (D4) antibody followed by streptavidin conjugated quantum dots. d) TEM images demonstrate Tnaive, Tactivated and iTreg contacts with DC. Orange arrow heads mark the patches of DC membrane captured by iTregs. e) Higher magnification images of DC-iTreg contact. Orange arrow heads point to the endosomes and membrane parts containing quantum dots. Blue arrow heads show the positive quantum dot staining in the DCs. f) Bars indicate the mean amount of quantum dots per μm2, error bars show the standard error of the mean. Data are pooled from n=3 independent experiments with similar results, each performed with two biological replicates. P values were calculated using two-sided student’s t-test (c) and one-way ANOVA with Dunnett’s post-test (f).
Figure 7:
Figure 7:
Antigen-specific Tregs strip cognate pMHCII complexes from DC surface. a) DCs were loaded with 3 μM MCC(88–103) (MCC +) or left unpulsed (MCC -) and adoptively transferred into CD45.1+B10.A mice via footpad, followed by a transfer of e450 labeled 5CC7 Tnaive, Tactivated or iTregs (106) i.v. Histograms demonstrate day 3 post-transfer MCC(88–103)-I-Ek levels of adoptively transferred T cells: Red: co-transferred with antigen pulsed DC. Black dotted: co-transferred with unpulsed DC. Endogenous CD4+ T cells of the recipient mice (Gray tinted) were also plotted as an internal negative control for staining. Graph shows the MCC(88–103)-I-Ek MFIs of adoptively transferred T cells. Lines mark the mean of n=4–8 mice, data are representative of three independent experiments. b-d) DCs were loaded with 0.3 – 9 μM MCC(88–103) and co-cultured 1:1 with 5CC7 Tnaive, Tactivated or iTregs for 18 h. b) Histograms demonstrate the MCC(88–103)-I-Ek levels in the T cell gate. Upper row shows the surface levels, lower row shows the intracellular levels detected after blockade of the surface MCC(88–103)-I-Ek by unconjugated D4 antibody. c) Graphs show the net increase in the MCC(88–103)-I-Ek MFI at the surface (top) and intracellular (bottom) compartments of T cells (Δ MFI= MFI (Post- antigen pulsed DC co-culture) - MFI (Post- unpulsed DC co-culture)). Symbols and error bars indicate the mean and standard deviation of n=3 biological replicates. Data are representative of five independent experiments. d) Histograms demonstrate the MCC(88–103)-I-Ek surface levels in the DC gate (Gray tinted: unpulsed DC; black dotted: antigen pulsed DC; antigen pulsed DCs co-cultured with Tnaive, Tactivated and iTregs were shown by green, blue and red histograms respectively). Graph shows the MFI for DC surface MCC(88–103)-I-Ek. Symbols and error bars indicate the mean and standard deviation of n=3 biological replicates. Data are representative of five independent experiments. e-f) 5CC7 iTreg, splenic (Sp) and mesenteric lymph node (mLN) Treg were co-cultured with DCs that were loaded with 3 μM MCC(88–103). e) Histograms show the MCC(88–103)-I-Ek levels in Treg gate following the co-culture with unpulsed DC (Gray tinted) and antigen pulsed DC (Red). f) Histograms show the MCC(88–103)-I-Ek levels in DC gate following the co-culture with different antigen specific Treg types. Black histogram shows the antigen pulsed DC cultured alone, red histogram shows the remaining levels MCC(88–103)-I-Ek after Treg-DC co-culture. Data are representative of three independent experiments with similar results. Statistical significance was calculated using two-way ANOVA with Sidak’s multiple comparison (a) and Dunnet’s correction (c,d).
Figure 8:
Figure 8:
Capture of pMHCII complexes by iTregs is antigen-specific. a-c) DCs were loaded with 3 μM MCC(88–103) and/or 3 μM HEL(46–61) and co-cultured 1:1 with 5CC7 or 3A9 iTregs for 18 h. a) Histograms demonstrate the MCC(88–103)-I-Ek and HEL(46–61)-I-Ak levels on 3A9 and 5CC7 iTregs co-cultured with double pulsed DCs (Red, blue) and unpulsed DC (Gray tinted). b) Histograms demonstrate the remaining MCC(88–103)-I-Ek and HEL(46–61)-I-Ak levels on double pulsed DCs after co-culture (Black dashed: Double antigen pulsed DC from solo culture. red: double pulsed DC co-cultured with 5CC7 iTregs. blue: double pulsed DC co-cultured with 3A9 iTregs). c) Graphs show the levels for DC surface MCC(88–103)-I-Ek and HEL(46–61)-I-Ak. Bars indicate the mean of n=3 biological replicates and error bars represent the standard deviation. Data are representative of three independent experiments. d-e) Double pulsed DCs (5 × 10⁴) were adoptively transferred into CD45.1+B10A mice via the footpad together with e450 labeled 5CC7 or 3A9 iTregs (5 × 10⁴) i.v. Day 3 post-transfer MFIs of iTregs for MCC(88–103)-I-Ek (d) and HEL(46–61)-I-Ak (e). Data are representative of three independent experiments, symbols show induvudual mice, lines mark the mean. f) DCs from B10.A animals were loaded with 3 μM MCC(88–103) and 3 μM HEL(46–61) or left unpulsed. DCs (1 × 10⁶) and e450 labeled 5CC7 iTregs (1 × 10⁶) were adoptively transferred into CD45.1+B10A mice i.v. Graphs show the DC surface levels of pMHCII 18h post-transfer. Lines mark the mean of n=3 mice, data are representative of two independent experiments. P values were calculated using two-sided student’s t-test (c) and one way ANOVA with Tukey’s multiple comparison (d-f).

Similar articles

Cited by

References

    1. Samy ET, Parker LA, Sharp CP & Tung KS Continuous control of autoimmune disease by antigen-dependent polyclonal CD4+CD25+ regulatory T cells in the regional lymph node. J Exp Med 202, 771–781 (2005). - PMC - PubMed
    1. Andersson J et al. CD4+ FoxP3+ regulatory T cells confer infectious tolerance in a TGF-beta-dependent manner. J Exp Med 205, 1975–1981 (2008). - PMC - PubMed
    1. Borsellino G et al. Expression of ectonucleotidase CD39 by Foxp3+ Treg cells: hydrolysis of extracellular ATP and immune suppression. Blood 110, 1225–1232 (2007). - PubMed
    1. Collison LW et al. The inhibitory cytokine IL-35 contributes to regulatory T-cell function. Nature 450, 566–569 (2007). - PubMed
    1. Shevach EM Mechanisms of foxp3+ T regulatory cell-mediated suppression. Immunity 30, 636–645 (2009). - PubMed

REFERENCES FOR METHODS

    1. Akkaya B et al. Ex-vivo iTreg differentiation revisited: Convenient alternatives to existing strategies. J Immunol Methods 441, 67–71 (2017) - PMC - PubMed
    1. Chen Q, Kim YC, Laurence A, Punkosdy GA & Shevach EM IL-2 controls the stability of Foxp3 expression in TGF-beta-induced Foxp3+ T cells in vivo. J Immunol 186, 6329–6337 (2011). - PMC - PubMed
    1. Kumar S et al. Zinc-Induced Polymerization of Killer-Cell Ig-like Receptor into Filaments Promotes Its Inhibitory Function at Cytotoxic Immunological Synapses. Mol Cell 62, 21–33 (2016). - PMC - PubMed
    1. Chaturvedi A, Dorward D & Pierce SK The B cell receptor governs the subcellular location of Toll-like receptor 9 leading to hyperresponses to DNA-containing antigens. Immunity 28, 799–809 (2008). - PMC - PubMed
    1. Akkaya M et al. Toll-like receptor 9 antagonizes antibody affinity maturation. Nat Immunol 19, 255–266 (2018). - PMC - PubMed

Publication types

MeSH terms

Substances