. 2019 Feb;15(2):179-188.
doi: 10.1038/s41589-018-0200-7. Epub 2019 Jan 14.

Discovery of a ZIP7 inhibitor from a Notch pathway screen

Affiliations

Discovery of a ZIP7 inhibitor from a Notch pathway screen

Erin Nolin et al. Nat Chem Biol. 2019 Feb.

Abstract

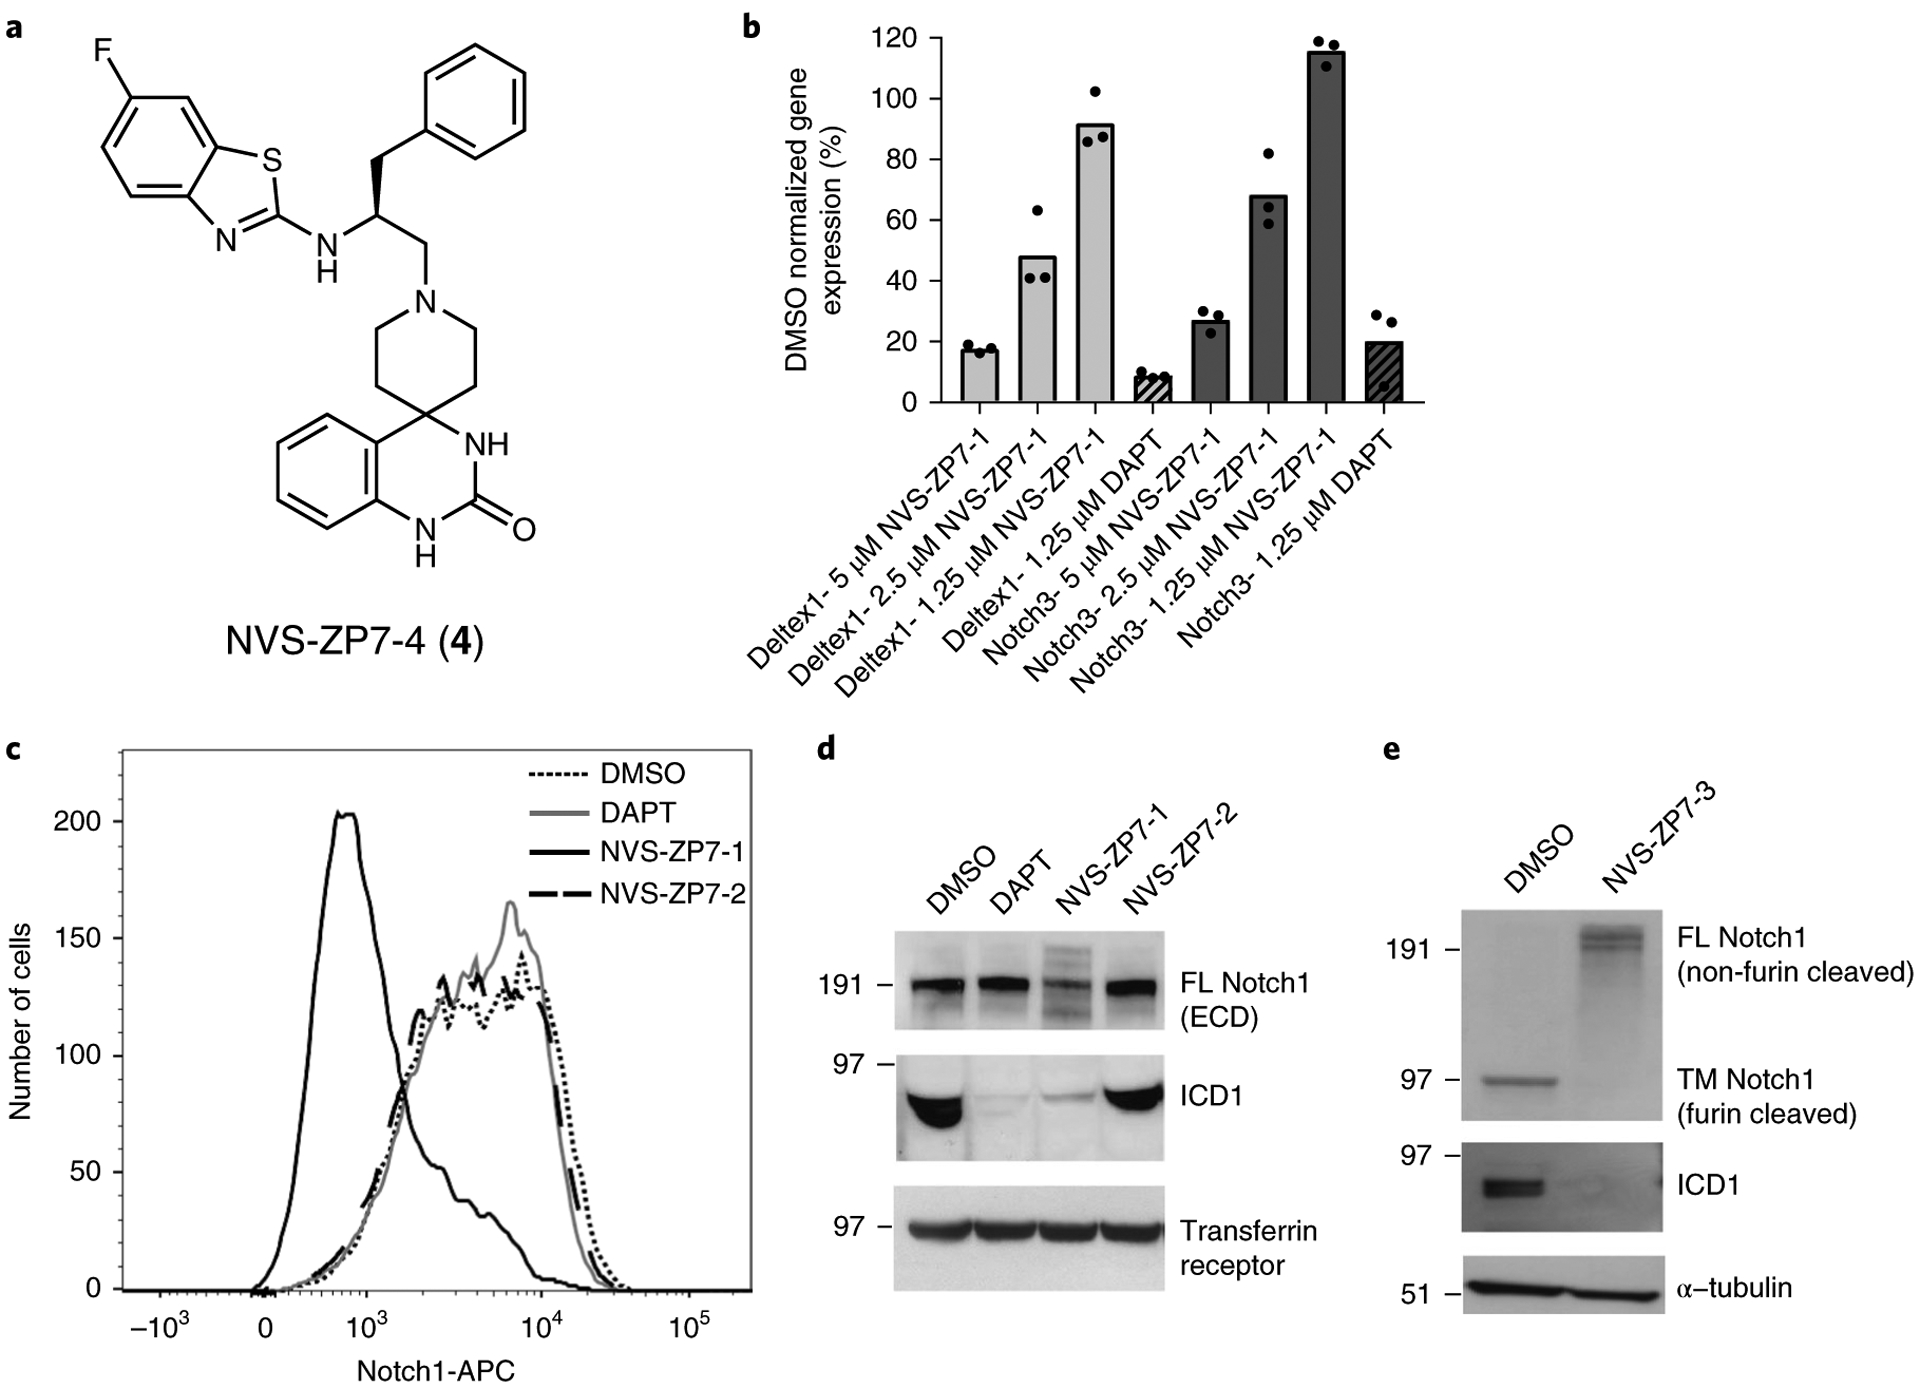
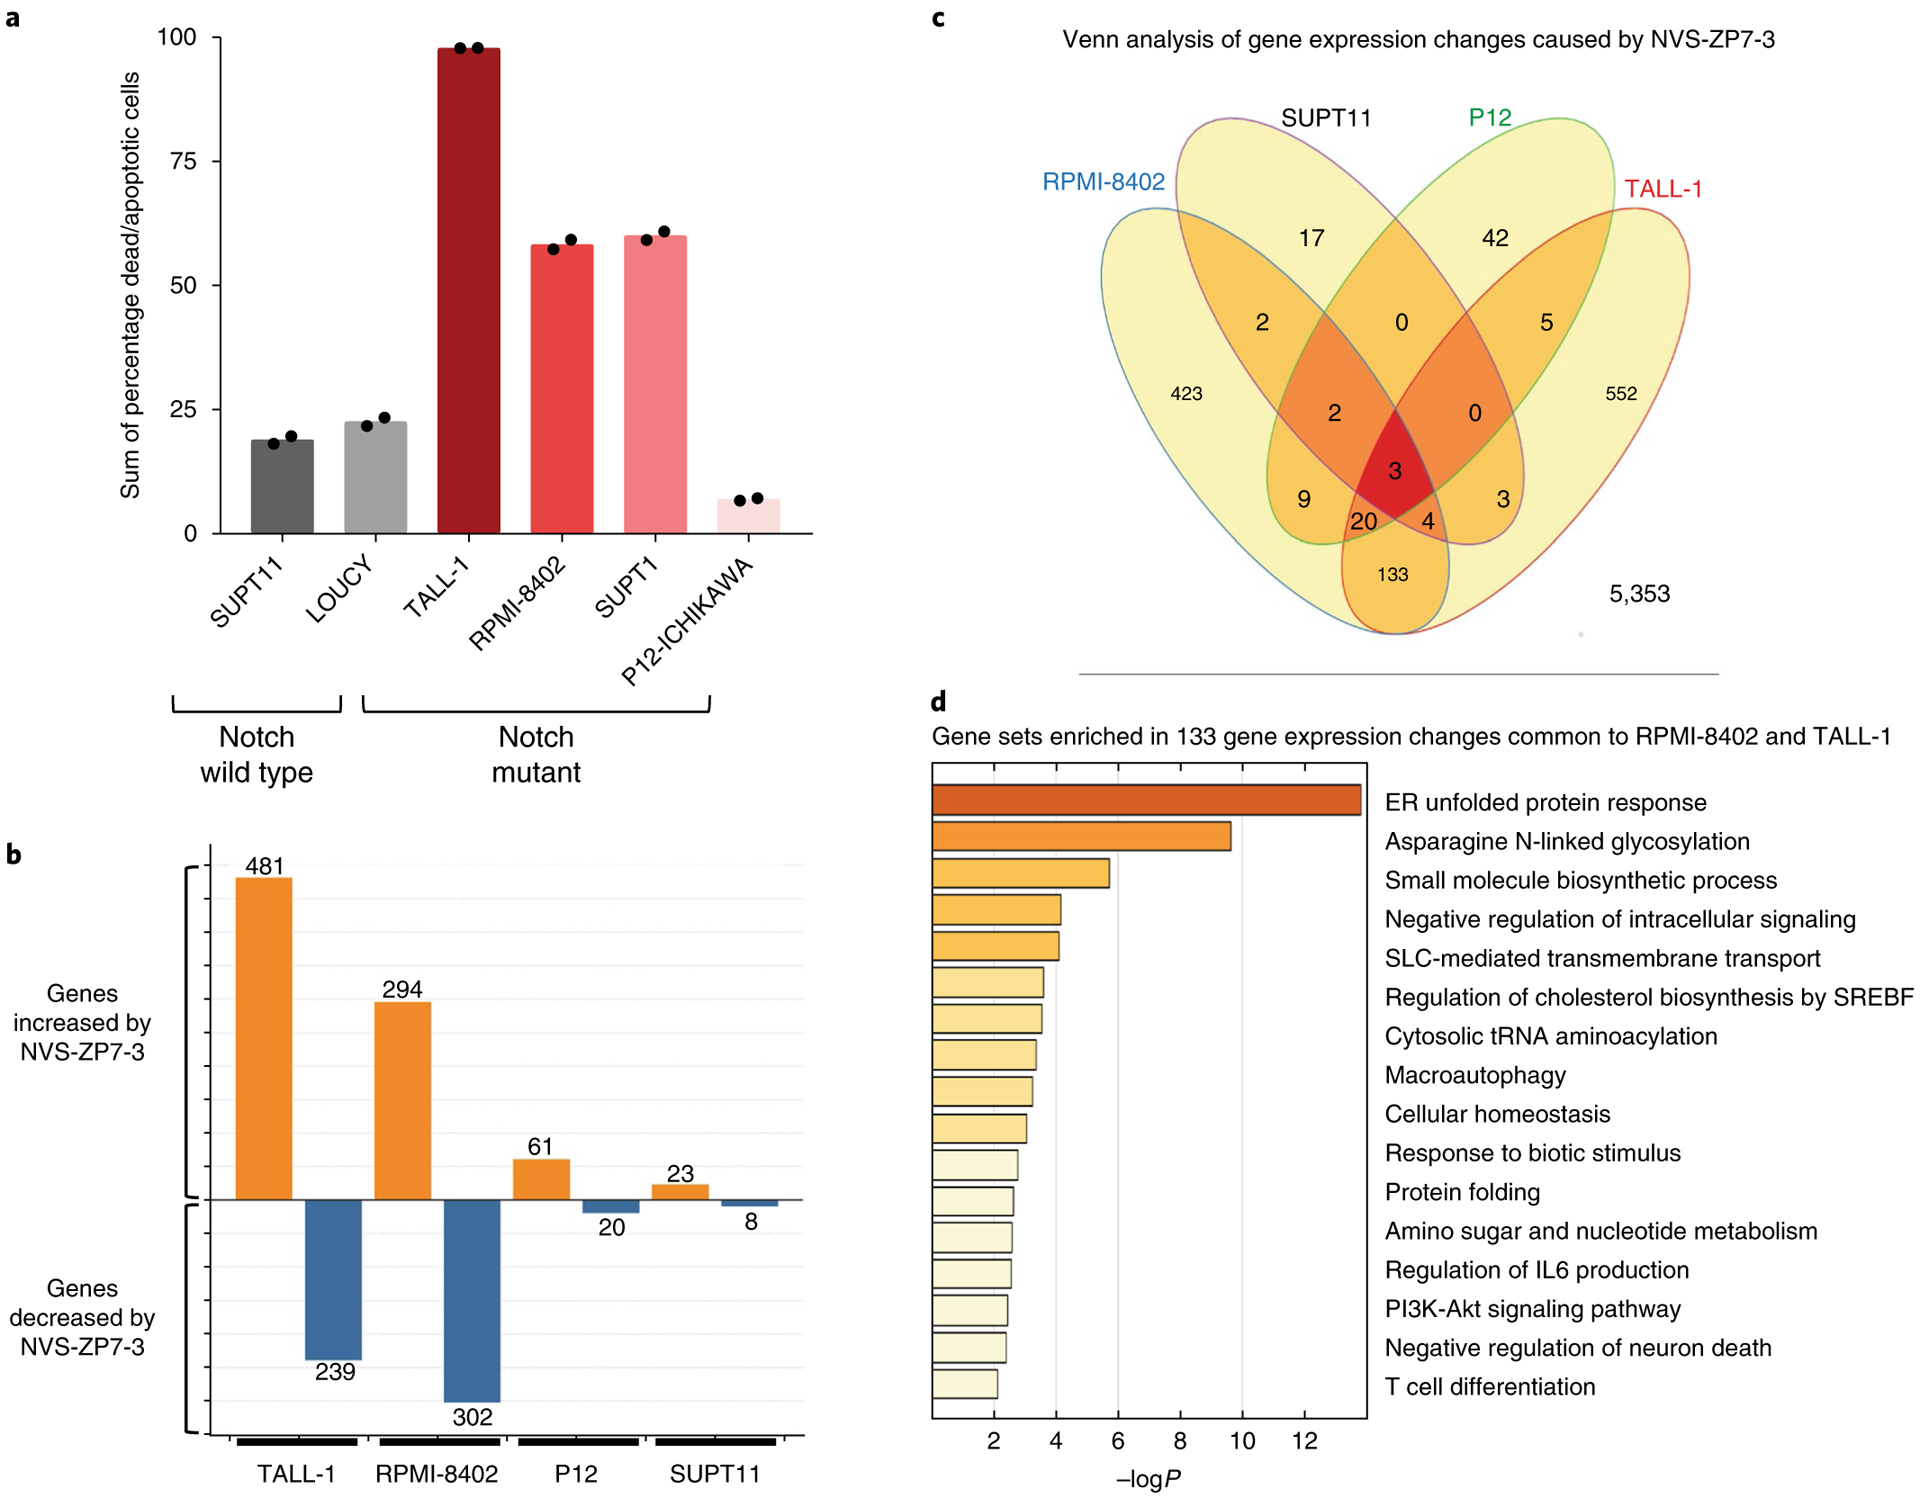
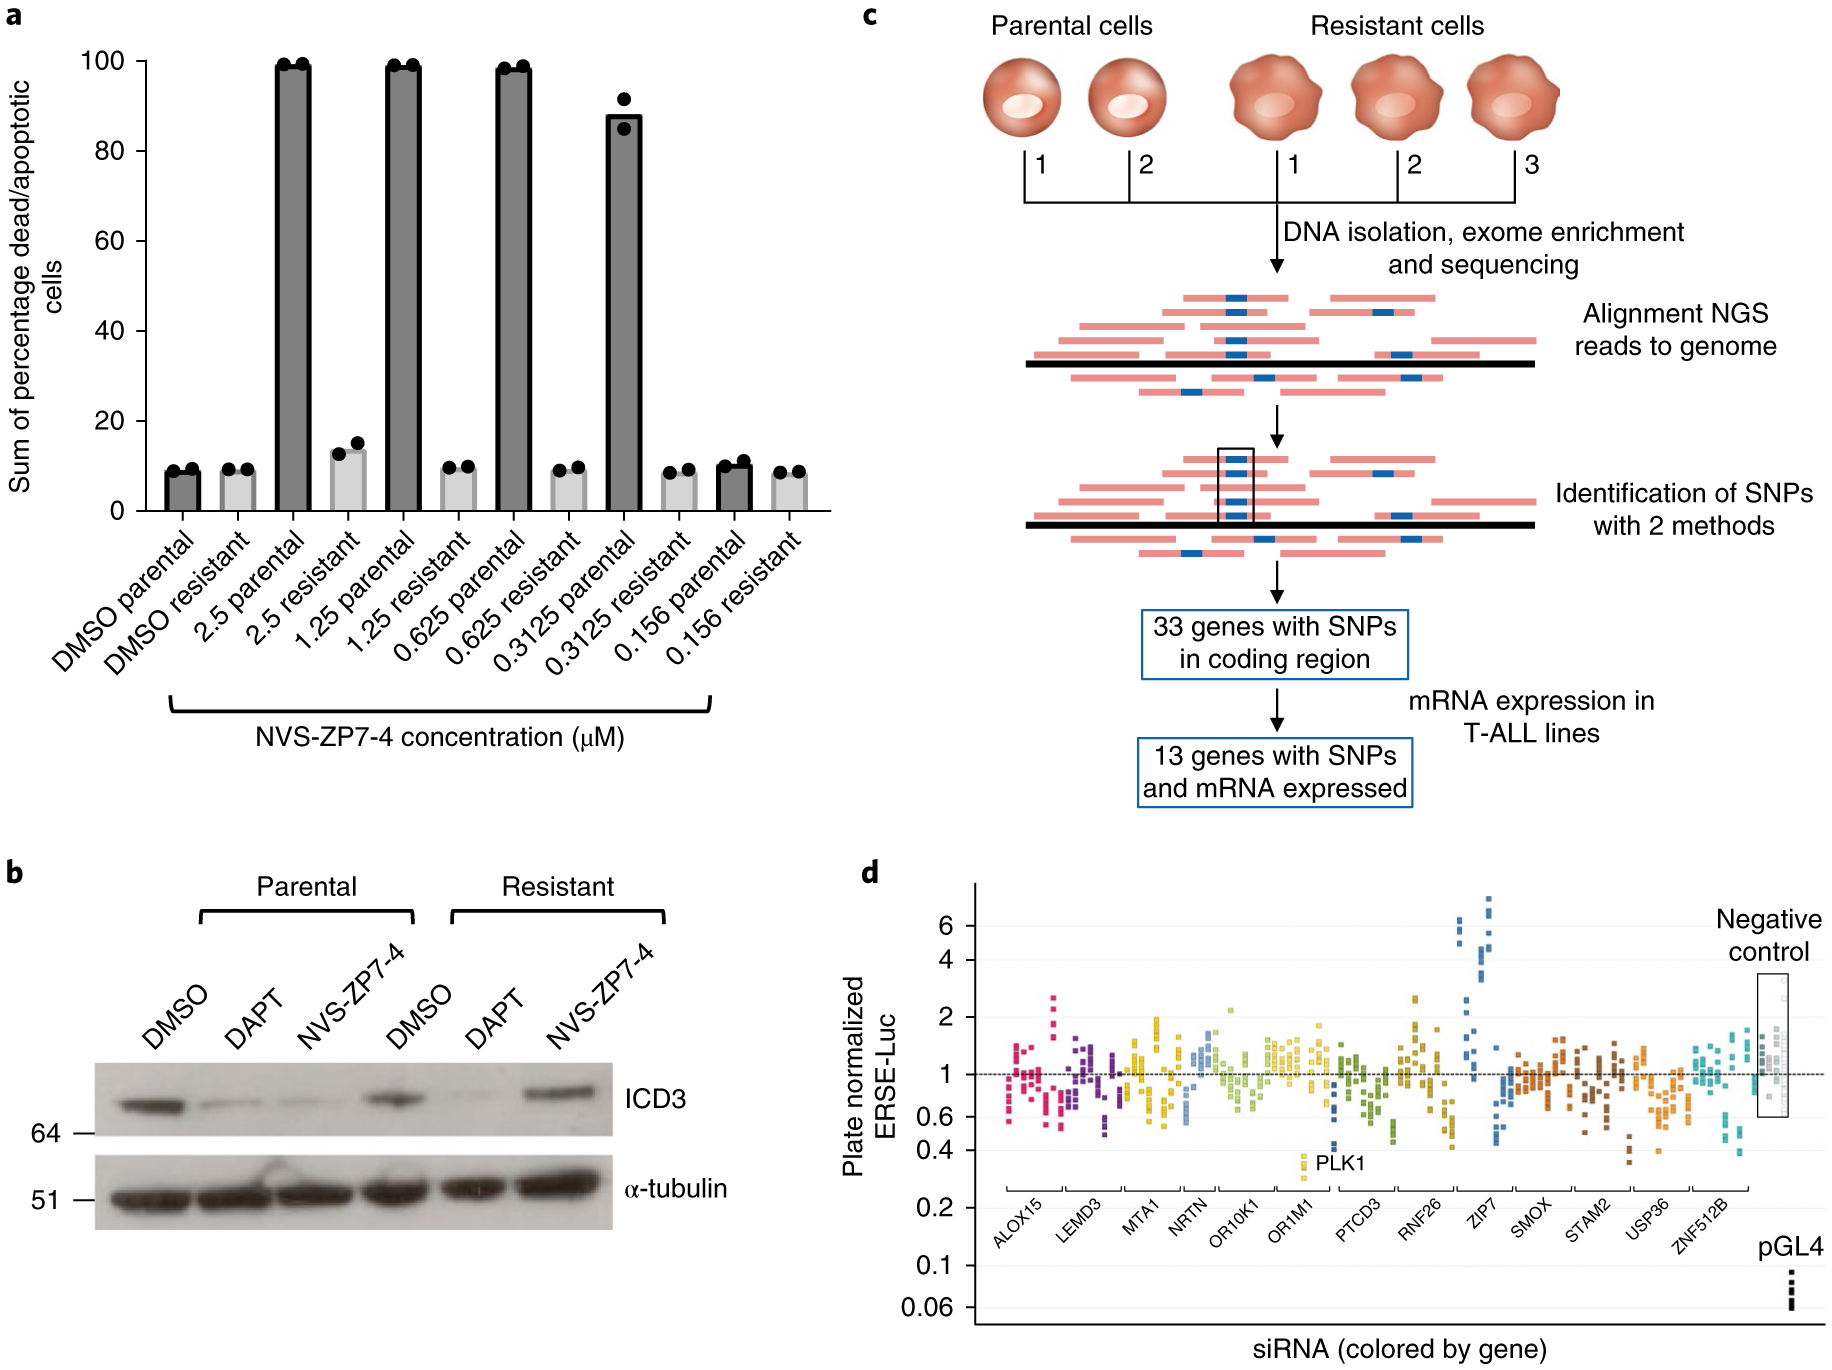
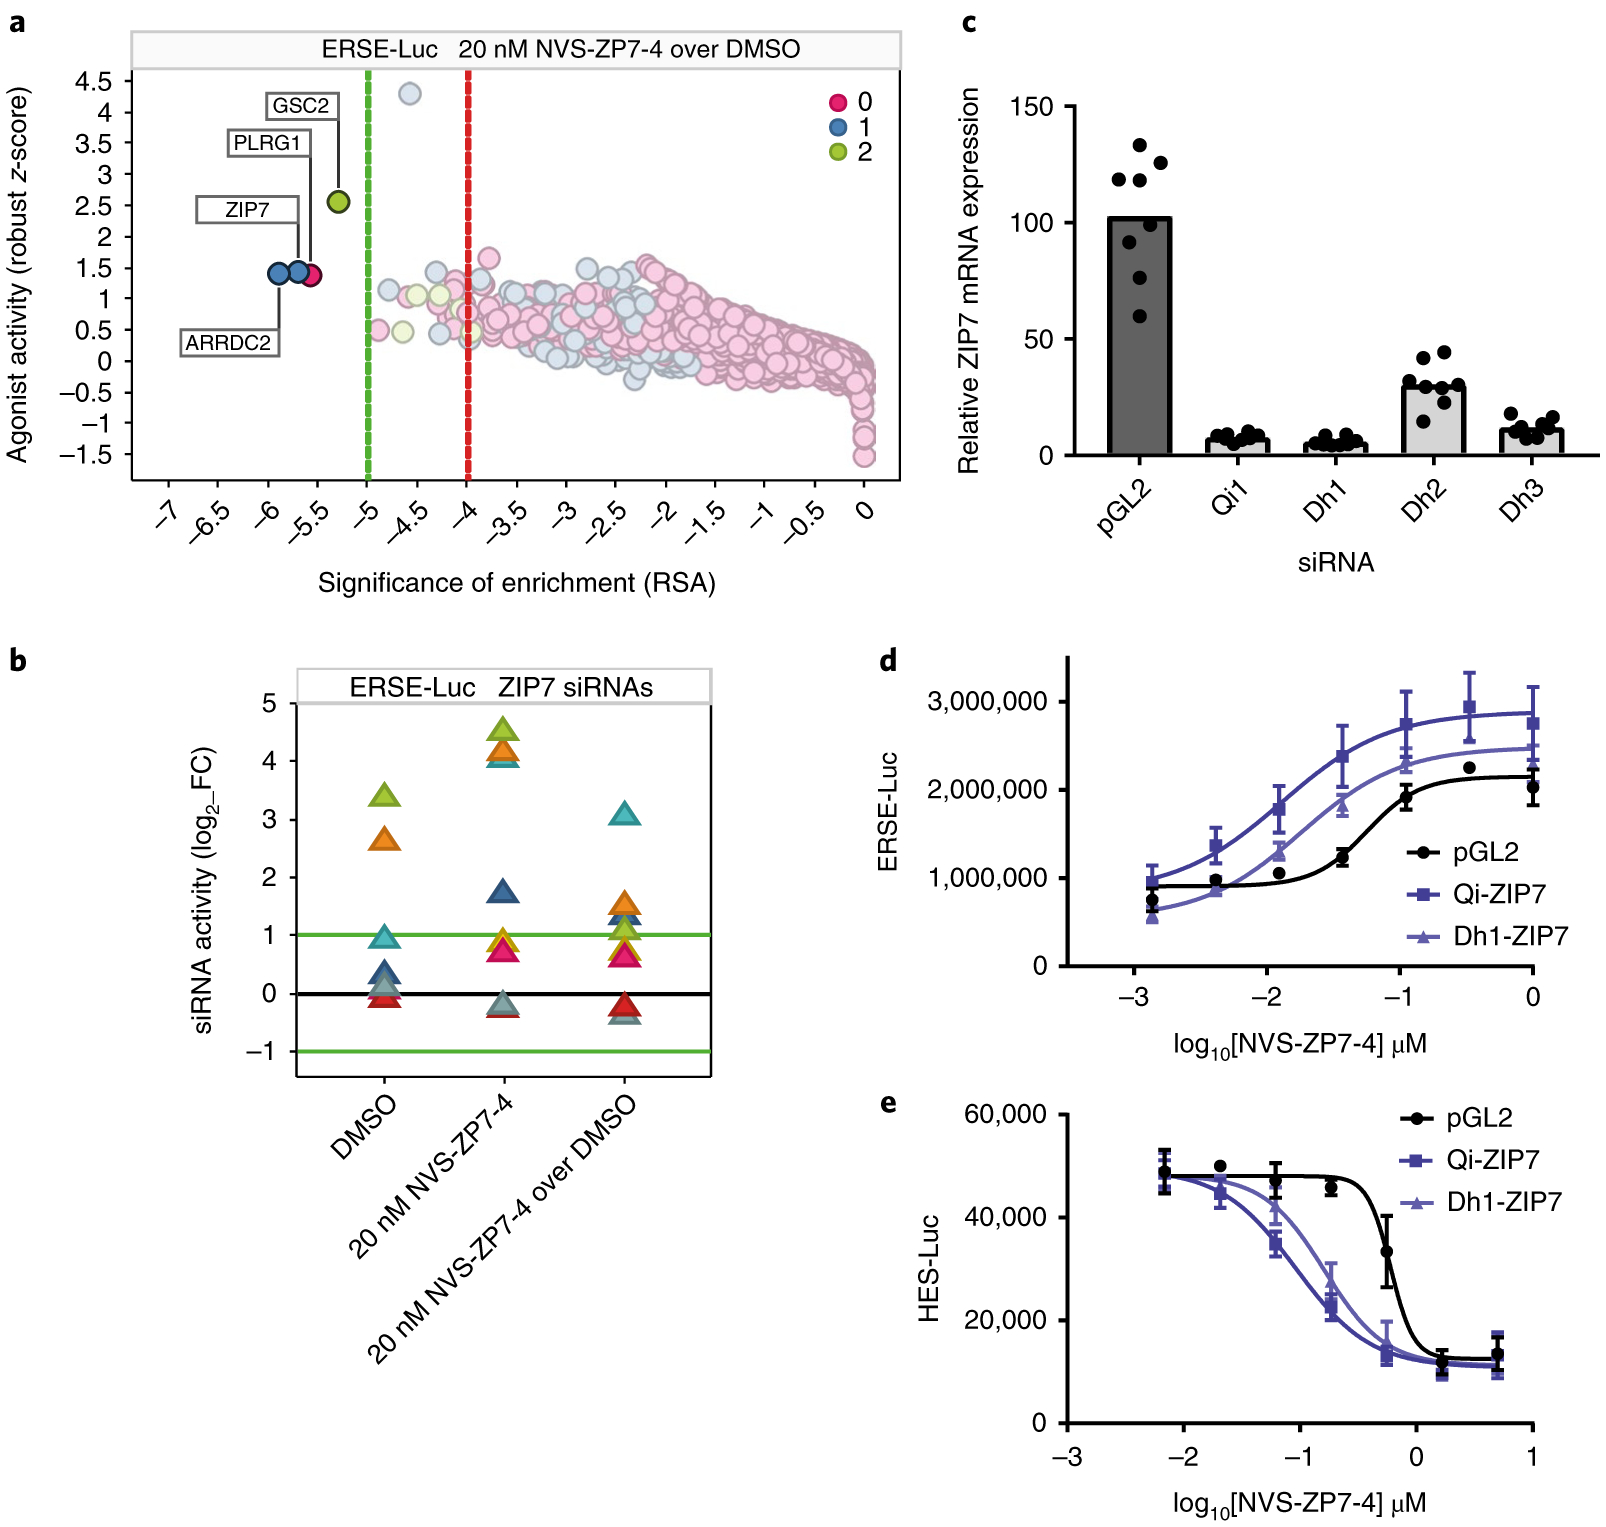
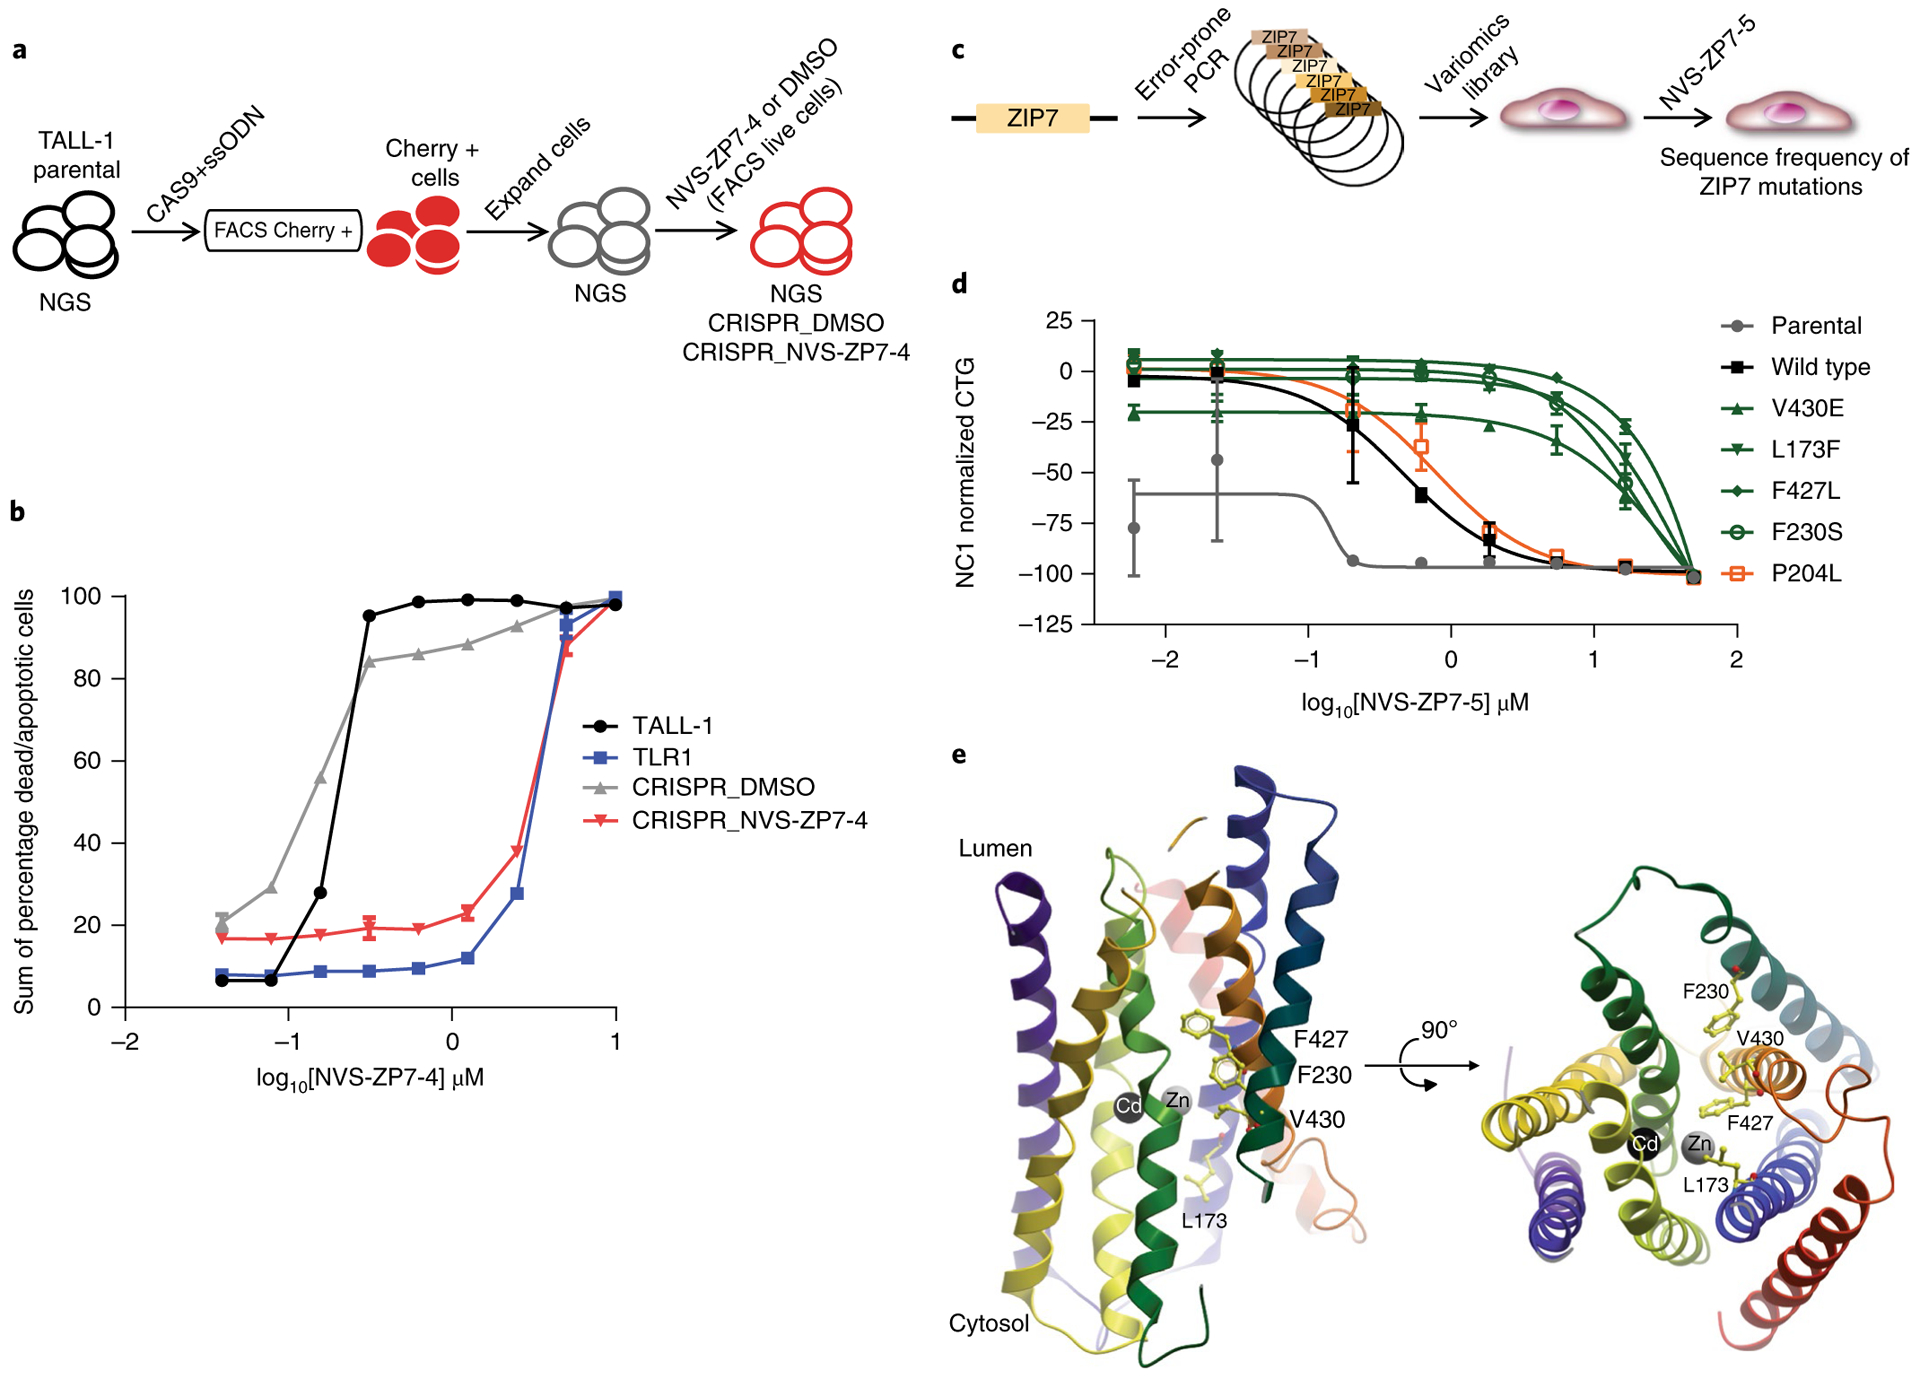
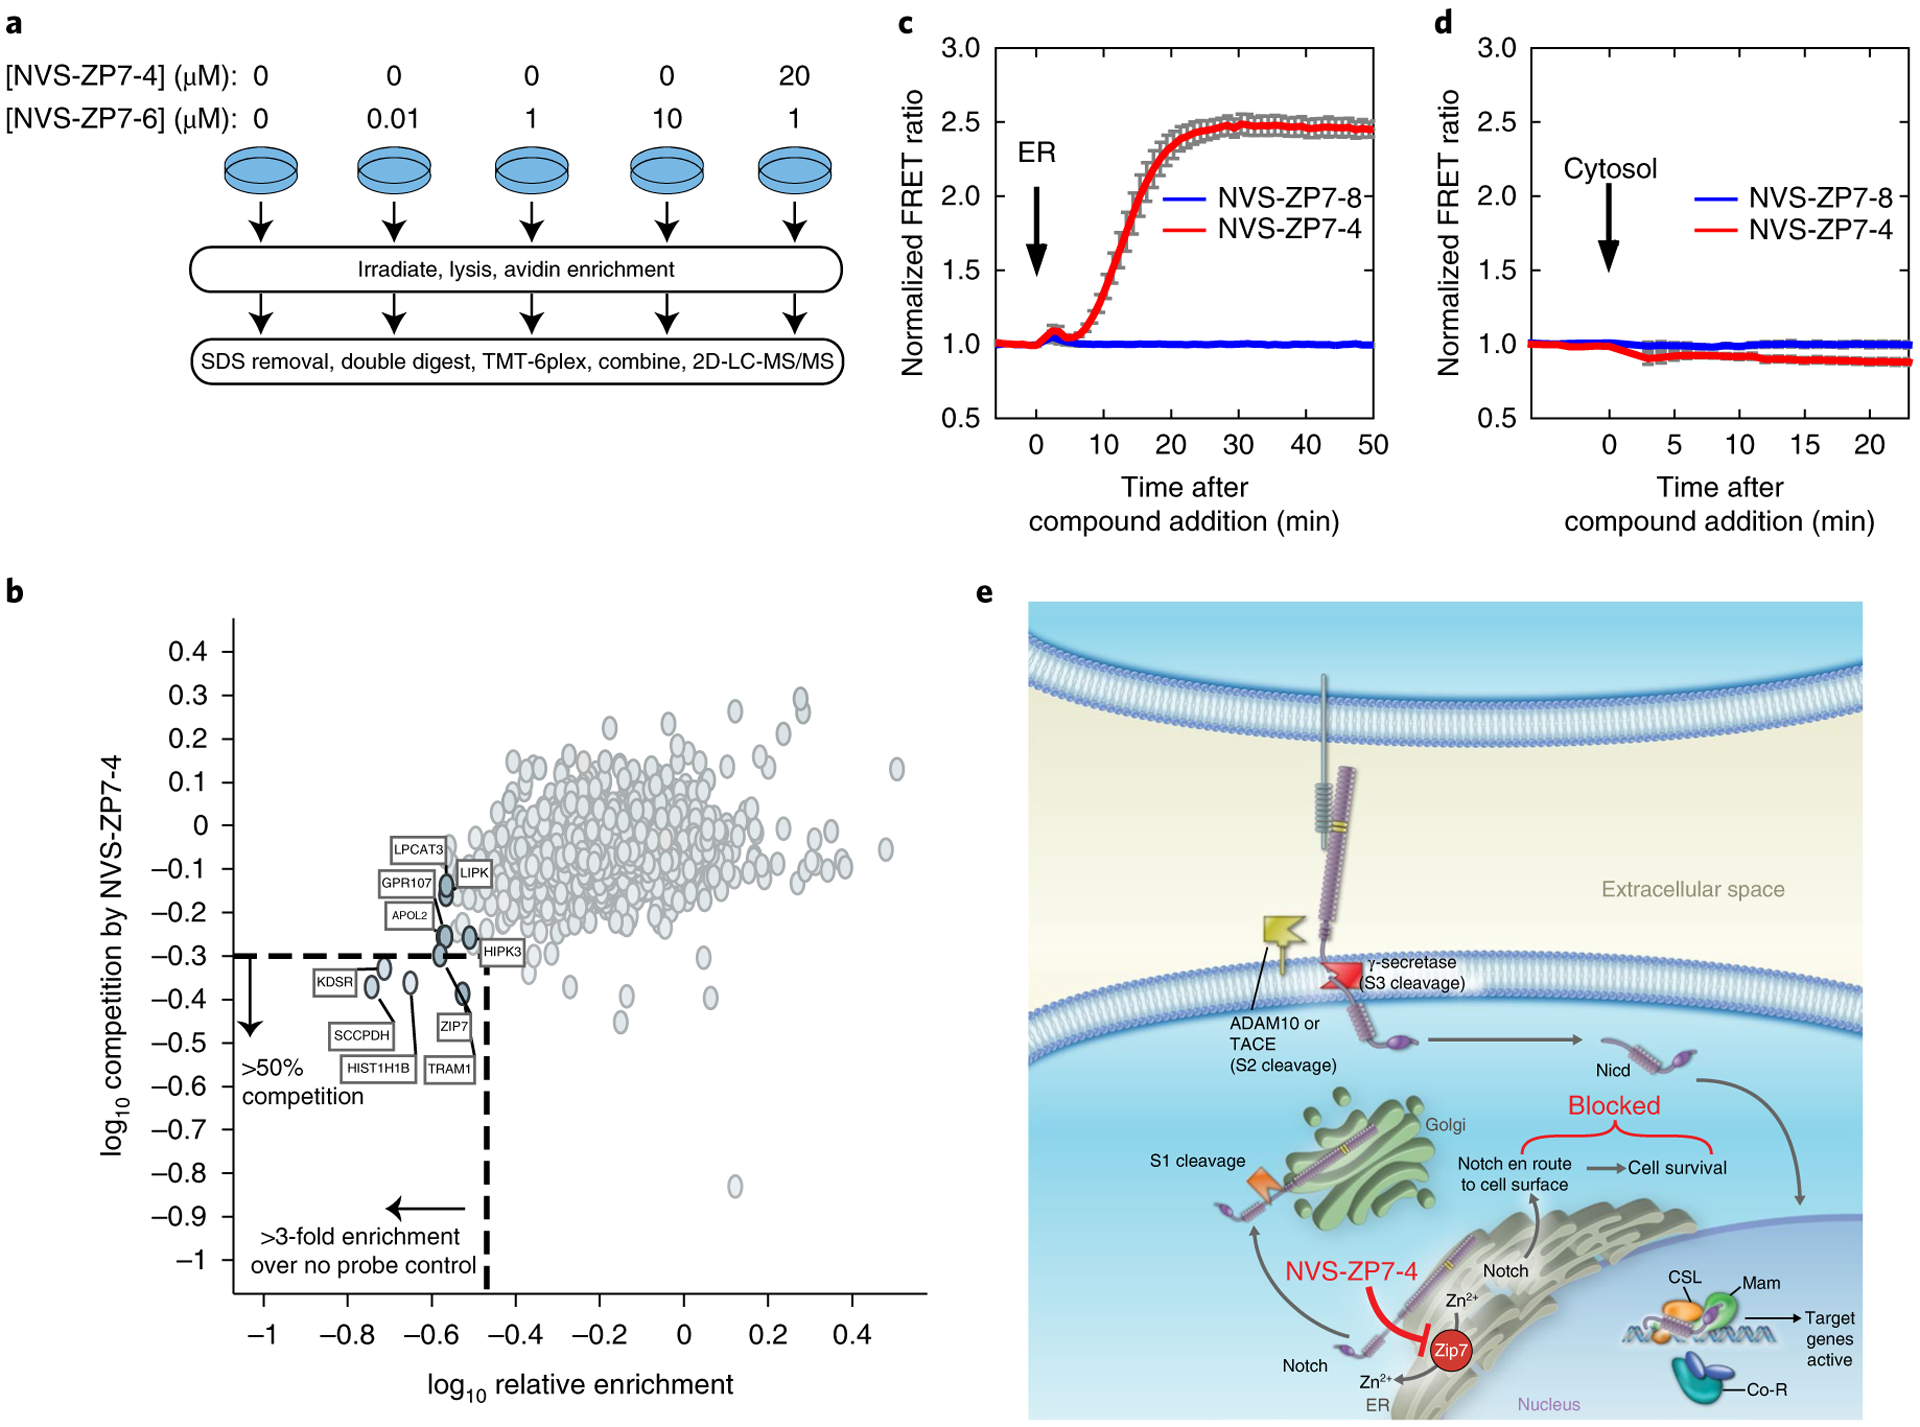
The identification of activating mutations in NOTCH1 in 50% of T cell acute lymphoblastic leukemia has generated interest in elucidating how these mutations contribute to oncogenic transformation and in targeting the pathway. A phenotypic screen identified compounds that interfere with trafficking of Notch and induce apoptosis via an endoplasmic reticulum (ER) stress mechanism. Target identification approaches revealed a role for SLC39A7 (ZIP7), a zinc transport family member, in governing Notch trafficking and signaling. Generation and sequencing of a compound-resistant cell line identified a V430E mutation in ZIP7 that confers transferable resistance to the compound NVS-ZP7-4. NVS-ZP7-4 altered zinc in the ER, and an analog of the compound photoaffinity labeled ZIP7 in cells, suggesting a direct interaction between the compound and ZIP7. NVS-ZP7-4 is the first reported chemical tool to probe the impact of modulating ER zinc levels and investigate ZIP7 as a novel druggable node in the Notch pathway.


Conflict of interest statement

Competing interests

E.N., S.G., L.L., S.B., S.M. Brittain, P.B.-E., J.J.L., J.R.T., M.S., Y.Y., N.G., G.R., S.S., M.B., A.L., F.S., A.C., K.X.X., S.H., J.R.-H., W.A.W., K.T., D.H., R.I.M., N.G., A.D., H.G., J.S., J.D., S.M.C., G.B., E.L.G., Z.B.K., C.A., J.A.P., O.W., J.A.T., J.L.J., R.K.J., S.M. Bushell, and C.J.F. are (or were at the time the research was conducted) employees of Novartis.

Figures

Fig. 1 |
Fig. 1 |. Identification and characterization of molecules that inhibit Notch signaling.
a, Structure of representative hit compound NVS-ZP7–4. b, Notch pathway target gene mRNA expression in a Notch1 mutant T-ALL cell line. HPB-ALL cells were treated with a single dose of the gamma-secretase inhibitor DAPT or three doses of NVS-ZP7–1 for 48 h. Percentage of DMSO normalized gene expression is plotted for DTX1 and Notch3 and represents the data for the technical replicates of the compound-treated samples from one individual experiment. The average readout value for these samples is represented by the dot-plot bar graph. Each experiment was performed three independent times. c, Cell surface expression of Notch1 in HPB-ALL cells. Cells were treated with 10 μM of NVS-ZP7–1 (black line), NVS-ZP7–2 (dashed line), DAPT (gray line), and DMSO (dotted line) for 48 h. Results from one biological replicate shown. Experiment was performed three independent times. d. Full length Notch1 extracellular domain (ECD) and Notch1 intracellular domain protein (ICD1) expression in HBP-ALL cells treated with 10 μM of compounds for 48 h. Full length gels are shown in Supplementary Fig. 11, and this experiment was repeated two independent times with representative data shown. e, Full length and Notch1 intracellular domain protein (ICD1) expression in MT-3 cells treated with 2 μM of compounds for 48 h. Notch1 western blot uses an antibody that has a C-terminal epitope that can detect full length non-furin-cleaved Notch1 (FL Notch1) as well as the furin-cleaved transmembrane domain/intracellular domain of Notch1 (TM Notch1). Full length gels are shown in Supplementary Fig. 12 and this experiment was repeated two independent times with representative western blot data shown.
Fig. 2 |
Fig. 2 |. NVS-ZP7–3 treatment induces apoptosis and ER stress in Notch pathway-active T-ALL cell lines.
a, Increase in percentage of dead and apoptotic cells by annexin V/PI staining after 72 h of 2 μM NVS-ZP7–3. Each bar graph represents the data from one individual experiment in which two independent samples are treated with compound. The average readout value for these samples is represented by the dot-plot bar graph. Each experiment was performed three independent times. Basal levels of apoptotic/dead cells from DMSO-treated cells are used to normalize the data. Notch pathway-active T-ALL cell lines are indicted in shades of red, while Notch pathway-inactive cell lines are shown in black/gray. b, Number of statistically significant gene expression level changes observed by microarray analysis. Both increased (orange) and decreased (blue) gene counts were greater in TALL-1 and RPMI-8402 cells. c, Venn analysis of gene expression changes associated with NVS-ZP7–3 treatment identifies three gene expression changes common to all four cell lines and 133 gene expression changes common to TALL-1 and RPMI-8402. d, Gene sets enriched in 133 genes common to TALL-1 and RPMI-8402 cells. List is sorted by P values for biological process with unfolded protein response and asparagine N-linked glycosylation processes highlighted.
Fig. 3 |
Fig. 3 |. Generation and characterization of a NVS-ZP7–4 compound-resistant cell line.
a, Comparison of effects of NVS-ZP7–4 on apoptosis/cell death in the parental TALL-1 and resistant TALL-1 cell line (TLR1). Dose response of NVS-ZP7–4 following 72 h of compound treatment. Data shown are the sum of percentage dead and apoptotic cells by annexin V/propidium iodide staining after compound treatment. Each bar graph represents the data from one individual experiment in which two independent samples are treated with compound. The average readout value for these samples is represented by the dot-plot bar graph. Each experiment was performed three independent times. b, Levels of Notch3 intracellular domain (ICD3) in the parental (TALL-1) and compound-resistant TALL-1 (TLR1) cell line following 20 h of 1 μM NVS-ZP7–4 or 10 μM DAPT treatment. Full length gels are shown in Supplementary Fig. 13, and the experiment was performed two independent times with representative western blot data shown. c, Schematic of sequencing and mutation detection in compound-resistant cell line. NGS, next generation sequencing. d, Effect of siRNA knockdown of genes identified from resistant cell line sequencing in combination with 20 nM NVS-ZP7–4 in ERSE reporter gene assay. Plate median normalized ERSE-Luc data are shown on the y axis.
Fig. 4 |
Fig. 4 |. Genetic screens reveal increased ER stress and decreased Notch signaling following ZIP7 siRNA knockdown.
a, Gene on-target activity in the ERSE-Luc assay agonist side (increased signaling) was plotted as robust z-score (activity of the 75th percentile siRNA per gene) as a function of RSA (significance of enrichment) for NVS-ZP7–4 over DMSO control. Color was set to depict the number of siRNAs per gene with significant activity (robust z-score > + 2). Dotted lines represent stringent (green) and loose (red) thresholds of significance of enrichment, determined on the basis of randomized dataset analysis. b, The impact of the individual ZIP7 siRNAs (log2 fold change; luminescence for test siRNA over median luminescence for all siRNAs) in the ERSE-Luc assay is shown for each of the three screening conditions (DMSO, 20 nM NVS-ZP7–4, 20 nM NVS-ZP7–4 over DMSO). c, Quantitation of ZIP7 mRNA expression after treatment of HSC-3 cells with control (pGL2) or four independent ZIP7 siRNAs for 24 h. Data are representative of eight technical replicates from one biological sample represented in a box-plot graph. d, NVS-ZP7–4 dose response in ERSE-Luc assay in combination with siRNA knockdown with two independent ZIP7 siRNAs or a control siRNA (pGL2). Error bars represent s.d. of the mean from six biological replicates (n = 6) in an individual experiment. Each experiment was performed three independent times. e, NVS-ZP7–4 dose response in Notch signaling HES-luciferase assay in combination with siRNA knockdown with two independent ZIP7 siRNAs or a control siRNA (pGL2). Error bars represent the s.d. of the mean from six biological replicates (n = 6) in an individual experiment. Each experiment was performed three independent times.
Fig. 5 |
Fig. 5 |. Genetic validation of ZIP7 as the target of NVS-ZP7–4.
a, Schematic of the process to generate the ZIP7 V430E CRISPR knock-in cell line in the TALL-1 cellular background. b, Effect of 72 h of NVS-ZP7–4 treatment on apoptosis/cell death as measured by annexin V/propidium iodide staining in TALL-1 cells, spontaneous resistant TLR1 cells, as well as TALL-1 cells, following introduction of the ZIP7 V430E mutation with CRISPR and short-term selection with either DMSO (CRISPR_DMSO) or NVS-ZP7–4 (CRISPR_NVS-ZP7–4). Data shown are the sum of percentage dead and apoptotic cells by annexin V/propidium iodide staining after compound treatment. The xy line graph represents the data from one individual experiment in which two independent samples are treated with compound. The average readout value for these samples is represented by the points and connecting lines with standard error bars. This exact experiment was performed two independent times. c, Schematic of process to generate ZIP7 variomics library and identify mutations that confer resistance to NVS-ZP7 compounds. d, Effect of 72 h of NVS-ZP7–4 treatment on proliferation (CTG) of parental HSC-3 cells or HSC-3 cells expressing wild type or mutant ZIP7 (V430E, L173F, F427L, F230S, P204L). Error bars represent s.d. of the mean from three biological replicates (n = 3) in an individual experiment. Each experiment was performed two independent times. e, Homology model of hZIP7 on the basis of the crystal structure of bacterial zinc transporter ortholog BdZIP (PDB code 5TSA) with transmembrane helices shown as ribbons. Zinc and cadmium ions at the binuclear center of the transporter are shown as gray and black spheres, respectively. Mutations that confer resistance to NVS-ZP7 compounds are shown in yellow ball-and-stick representation. Rotated view (right panel) is also shown.
Fig. 6 |
Fig. 6 |. NVS-ZP7–4 interacts with ZIP7, increases ER Zn2+ levels in the ER and modulates Notch signaling.
a, Schematic overview of photoaffinity labeling probe titration strategy. Cells were treated with varying concentrations of the NVS-ZP7–6 to identify proteins with saturatable binding. Additionally, cells were pretreated with NVS-ZP7–4 to identify that proteins specifically bound the pharmacophore. NGS, next generation sequencing. b, Identification of proteins that are enriched by NVS-ZP7–6 and where this labeling can be competed by NVS-ZP7–4. The x axis denotes the enrichment observed in the presence of 1 μM NVS-ZP7–6 relative to 0 μM NVS-ZP7–6 (log10 (0 μM NVS-ZP7–6/1 μM NVS-ZP7–6)). Proteins to the left of the vertical dashed lined are enriched by more than threefold over no probe control. Plotted on the y axis is the magnitude of competition observed in the presence of pre-incubated free competitor compound NVS-ZP7–4. Proteins below the dashed horizontal line show ≥ 50% reduction in enrichment in the presence of 20 μM NVS-ZP7–4 (log10 ((20 μM NVS-ZP7–4 + 1 μM NVS-ZP7–6)/1 μM NVS-ZP7–6). c, Quantitation of Zn2+ levels in the ER following NVS-ZP7–4 treatment. U2OS cells were transfected with ER-ZapCY1 for 24 h before imaging. Cells were treated with 1 μM NVS-ZP7–8 (blue, n = 7 cells) or 1 μM NVS-ZP7–4 (red, n = 6 cells) at the time indicated by the arrow. FRET ratios were normalized to the average FRET ratio of each cell before compound treatment. Error bars are the s.e.m. d, Quantitation of cytosolic Zn2+ levels following NVS-ZP7–4 treatment. U2OS cells were transfected with NES-ZapCV2 24 h before imaging. Cells were treated with 1 μM NVS-ZP7–8 (blue, n = 4 cells) or 1 μM NVS-ZP7–4 (red, n = 4 cells) at the time indicated by the arrow. FRET ratios were normalized to the average FRET ratio of each cell before compound treatment. Error bars are the s.e.m. e, Model of ZIP7 modulation by NVS-ZP7–4 and effects on Notch signaling.

References

    1. Imming P, Sinning C & Meyer A Drugs, their targets and the nature and number of drug targets. Nat. Rev. Drug Discov 5, 821–834 (2006). - PubMed
    1. Overington JP, Al-Lazikani B & Hopkins AL How many drug targets are there? Nat. Rev. Drug Discov 5, 993–996 (2006). - PubMed
    1. Whitfield JR, Beaulieu ME & Soucek L Strategies to inhibit Myc and their clinical applicability. Front. Cell Dev. Biol 5, 10 (2017). - PMC - PubMed
    1. Hori K, Sen A & Artavanis-Tsakonas S Notch signaling at a glance. J. Cell Sci 126, 2135–2140 (2013). - PMC - PubMed
    1. Weng AP et al. Activating mutations of NOTCH1 in human T cell acute lymphoblastic leukemia. Science 306, 269–271 (2004). - PubMed

Publication types