. 2019 Mar;15(3):259-268.
doi: 10.1038/s41589-018-0213-2. Epub 2019 Jan 14.

IFITM3 directly engages and shuttles incoming virus particles to lysosomes

Affiliations

IFITM3 directly engages and shuttles incoming virus particles to lysosomes

Jennifer S Spence et al. Nat Chem Biol. 2019 Mar.

Abstract

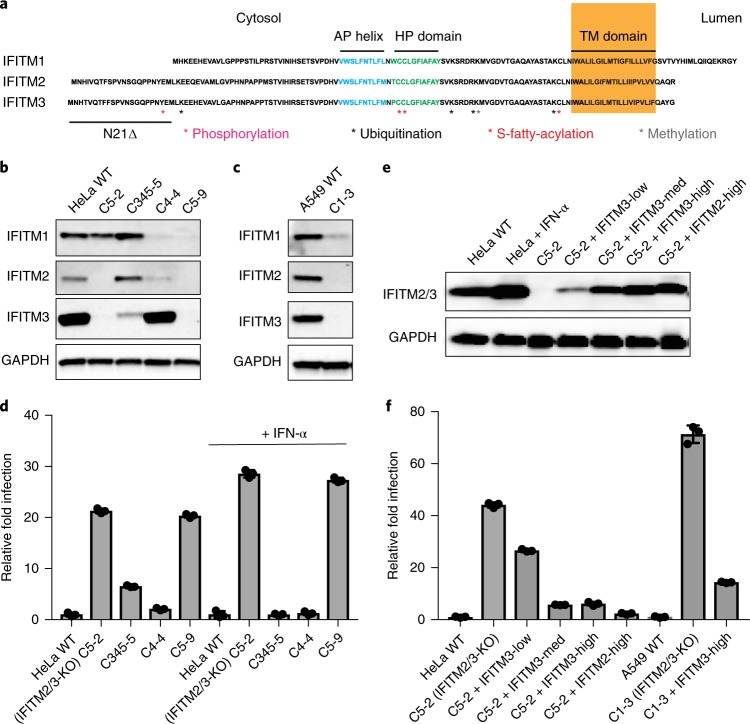
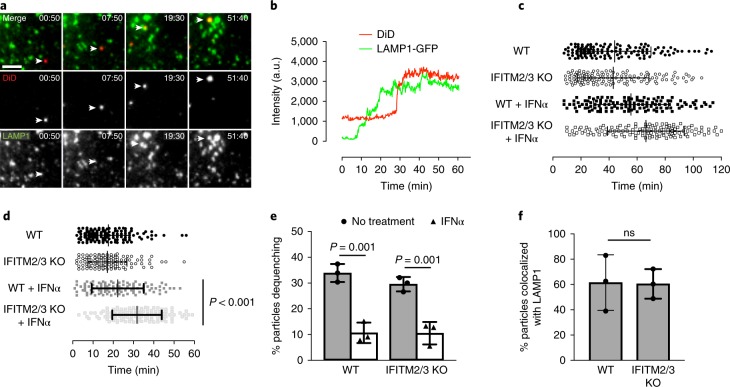
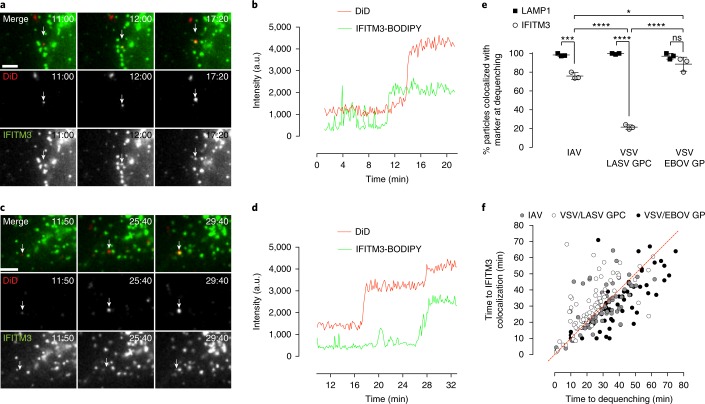
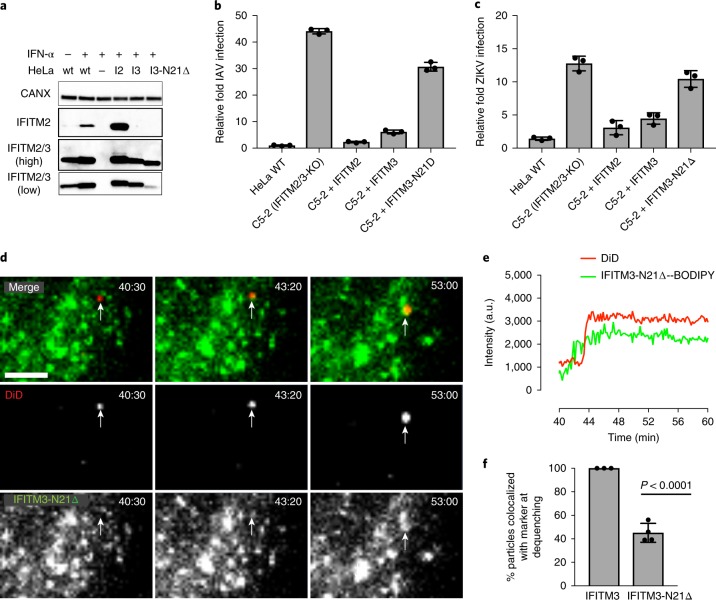
Interferon-induced transmembrane proteins (IFITMs 1, 2 and 3) have emerged as important innate immune effectors that prevent diverse virus infections in vertebrates. However, the cellular mechanisms and live-cell imaging of these small membrane proteins have been challenging to evaluate during viral entry of mammalian cells. Using CRISPR-Cas9-mediated IFITM-mutant cell lines, we demonstrate that human IFITM1, IFITM2 and IFITM3 act cooperatively and function in a dose-dependent fashion in interferon-stimulated cells. Through site-specific fluorophore tagging and live-cell imaging studies, we show that IFITM3 is on endocytic vesicles that fuse with incoming virus particles and enhances the trafficking of this pathogenic cargo to lysosomes. IFITM3 trafficking is specific to restricted viruses, requires S-palmitoylation and is abrogated with loss-of-function mutants. The site-specific protein labeling and live-cell imaging approaches described here should facilitate the functional analysis of host factors involved in pathogen restriction as well as their mechanisms of regulation.


Conflict of interest statement

The authors declare no competing interests.

Figures

Fig. 1
Fig. 1. Expression and antiviral activity of IFITM1/2/3 KO cell lines.
a, Alignment and topology of human IFITM1, IFITM2 and IFITM3. Key domains: amphipathic (AP) helix, hydrophobic (HP), and transmembrane (TM); mutations: N21Δ SNP rs12252-C allele and post-translational modifications are highlighted. b,c, Expression levels of human IFITM1, IFITM2 and IFITM3 in IFN-treated HeLa and A549 cell lines. Full gels for b are shown in Supplementary Fig. 17a. d, IAV infection of naïve and IFN-α stimulated HeLa WT and IFITM2/3-KO cell lines. Cells were stimulated with IFN-α (100 μg/mL) for 16 h and then infected with IAV (multiplicity of infection (MOI) = 2.5). At 12 h post-infection, cells were harvested, stained for IAV and analyzed by flow cytometry. The percentage of IAV-positive cells was normalized to WT cells and plotted as relative infection. Data represent the mean and s.d. of three independent experiments. e, Stable reconstitution with IFITM2 and IFITM3 in IFITM2/3-KO HeLa cells (C5-2). Low, medium and high IFITM2/3 protein expression levels are shown. f, IAV infection of IFITM2- and IFITM3-reconstituted HeLa and A549 cell clones stimulated with IFN-α (100 μg/mL). Experiments were performed and data were analyzed as described in d.
Fig. 2
Fig. 2. Analysis of IFITM3 in IFN-α stimulated A549 WT and IFITM2/3-KO cells.
a, Localization of IFITM3 and CD63 in IFN-α stimulated A549 cells. Pearson correlation coefficient (PCC) analyses are included below. Top row, endogenous IFITM3 and CD63 in IFN-α stimulated WT A549 cells (PCC = 0.58); middle row, endogenous IFITM3 and CD63 in IFN-α stimulated IFITM2/3-KO cells (PCC = n/a); bottom row, IFITM2/3-KO cells + stable re-expression of IFITM3 (PCC = 0.46). b, EGFR levels in IFN-α stimulated A549 WT, IFITM2/3-KO and IFITM2/3-KO cells + stable re-expression of IFITM3. Cells were treated with IFN-α (100 μg/ml) for 16 h, serum-starved for 2 h, treated with 25 μg/ml cycloheximide for 1 h and then treated with 100 ng/ml EGF for 30 min at 4 °C in the continued presence of cycloheximide. Cells were subsequently shifted to 37 °C and analyzed at various time points. Full gels are shown in Supplementary Fig. 17b. c, Quantitation of EGFR levels in b normalized to tubulin levels. Data represent the mean and s.d. of three independent experiments.
Fig. 3
Fig. 3. IAV-DID imaging in HeLa WT and IFITM2/3-KO cells.
a, Representative images of lipid mixing by an IAV particle in a LAMP1 + compartment in a HeLa cell as depicted by DID dequenching. The arrowheads indicate the virion of interest. The number show the time post-infection (minutes). Scale bar, 5 μm. b, Fluorescence intensity trace for the indicated particle in a. a.u., arbitrary units. c, IAV lipid mixing events following synchronized infection in HeLa WT or IFITM2/3-KO cells in the presence or absence of IFN-α (n > 100 dequenching particles tracked in three independent experiments). d, Times of IAV delivery to LAMP1 + compartments following synchronized infection in unstimulated and IFN-α stimulated HeLa WT or IFITM2/3-KO cells. For each sample, n > 100 particles tracked in three independent experiments. Mean and s.d. values are indicated. P < 0.0001 by and unpaired, two-sided t-test. e, Total percentage of cell-associated IAV particles in HeLa WT or IFITM2/3-KO cells that undergo lipid mixing by 2 h post-infection. Data represent the mean and s.d. of three independent experiments (n = 800–1,000 cell-associated particles total for each sample). P values were determined by one-way ANOVA with a post-hoc Tukey test. f, Total percentage of cell-associated particles colocalized with LAMP1 at 2 h post-infection. Data represent the mean and s.d. of three independent experiments (n = 800–1,000 cell-associated particles total for each sample). P value is nonsignificant (ns) by unpaired, two-sided t-test.
Fig. 4
Fig. 4. Trafficking of DiD-IAV and IFITM3 in IFITM2/3-KO cells.
a, IAV lipid mixing in an IFITM3 + compartment over time. Bar, 5 μm. b, The fluorescence intensity trace for the indicated particle in a. c, Example of IAV lipid mixing before colocalization with IFITM3 in HeLa cells. Scale bar, 5 μm. For a and c, the arrows indicate the virion of interest in each panel. The numbers indicate the time post-infection (minutes). d, The fluorescence intensity trace for the indicated particle in c. e, Percentage of particles of IAV, and VSV pseudotyped with LASV or EBOV glycoproteins undergoing lipid mixing in LAMP1 + or IFITM3 + compartments in HeLa cells. Data represent the mean and s.d. of three independent experiments (n = 800–1,000 cell-associated particles total for each sample). P values were determined by one-way ANOVA with a post-hoc Tukey test. *P  < 0.05, ***P < 0.001, ****P < 0.0001. f, Time of lipid mixing relative to IAV, LASV- or EBOV-pseudotyped particle colocalization with IFITM3 in HeLa cells (n > 50 dequenching particles tracked in three independent experiments for each sample).
Fig. 5
Fig. 5. Analysis of the IFITM3-N21Δ loss-of-function mutant in HeLa IFITM2/3-KO cells.
a, Western blot analysis of IFITM2 and IFITM2/3 in IFN-α stimulated HeLa WT and IFITM2/3-KO cells. High and low exposures of blots are included. Full gels are shown in Supplementary Fig. 17c. b, IAV infection of IFN-α stimulated HeLa WT and IFITM2/3-KO cells. Data represent the mean and s.d. of three independent experiments. c, ZIKV infection of IFN-α stimulated HeLa WT and IFITM2/3-KO cells. Data represent the mean and s.d. of three independent experiments. d, IAV-DID dequenching and trafficking with IFITM3-N21Δ. The arrows indicate the virion of interest. The numbers indicate the time post-infection (in minutes). Scale bar, 5 μm. e, Fluorescence intensity trace for the indicated particle in d. f, Relative percentage of DiD-IAV particles colocalized with IFITM3 and IFITM3-N21Δ at the time of dequenching. Data represent the mean and s.d. of three independent experiments (n > 100 dequenching particles total for each sample. P < 0.001 by an unpaired, two-sided t-test).
Fig. 6
Fig. 6. Site-specific S-palmitoylation regulates IFITM3 trafficking to IAV particles.
a, Intensity trace for DiD-IAV dequenching in the presence of IFITM3-F8-BODIPY-C71A. b, Intensity trace for DiD-IAV dequenching in the presence of IFITM3-F8-BODIPY-C72A. c, Intensity trace for DiD-IAV dequenching in the presence of IFITM3-F8-BODIPY-C105A. d, Total percentage of DiD-IAV particles colocalized with IFITM3 Cys mutants at the time of lipid mixing. Data represent the mean and s.d. of three independent experiments (n > 100 dequenching particles total for each sample). P values determined by one-way ANOVA with a post-hoc Tukey test. *P < 0.05, ***P < 0.001.

Similar articles

Cited by

References

    1. Bailey CC, Zhong G, Huang IC, Farzan M. IFITM-family proteins: the cell’s first line of antiviral defense. Annu. Rev. Virol. 2014;1:261–283. doi: 10.1146/annurev-virology-031413-085537. - DOI - PMC - PubMed
    1. Brass AL, et al. The IFITM proteins mediate cellular resistance to influenza A H1N1 virus, West Nile virus, and dengue virus. Cell. 2009;139:1243–1254. doi: 10.1016/j.cell.2009.12.017. - DOI - PMC - PubMed
    1. Perreira JM, Chin CR, Feeley EM, Brass AL. IFITMs restrict the replication of multiple pathogenic viruses. J. Mol. Biol. 2013;425:4937–4955. doi: 10.1016/j.jmb.2013.09.024. - DOI - PMC - PubMed
    1. Savidis G, et al. The IFITMs inhibit Zika virus replication. Cell Rep. 2016;15:2323–2330. doi: 10.1016/j.celrep.2016.05.074. - DOI - PubMed
    1. Monel B, et al. Zika virus induces massive cytoplasmic vacuolization and paraptosis-like death in infected cells. EMBO J. 2017;36:1653–1668. doi: 10.15252/embj.201695597. - DOI - PMC - PubMed

Publication types