. 2019 Feb;25(2):301-311.
doi: 10.1038/s41591-018-0321-2. Epub 2019 Jan 14.

Translation control of the immune checkpoint in cancer and its therapeutic targeting

Affiliations

Translation control of the immune checkpoint in cancer and its therapeutic targeting

Yichen Xu et al. Nat Med. 2019 Feb.

Abstract

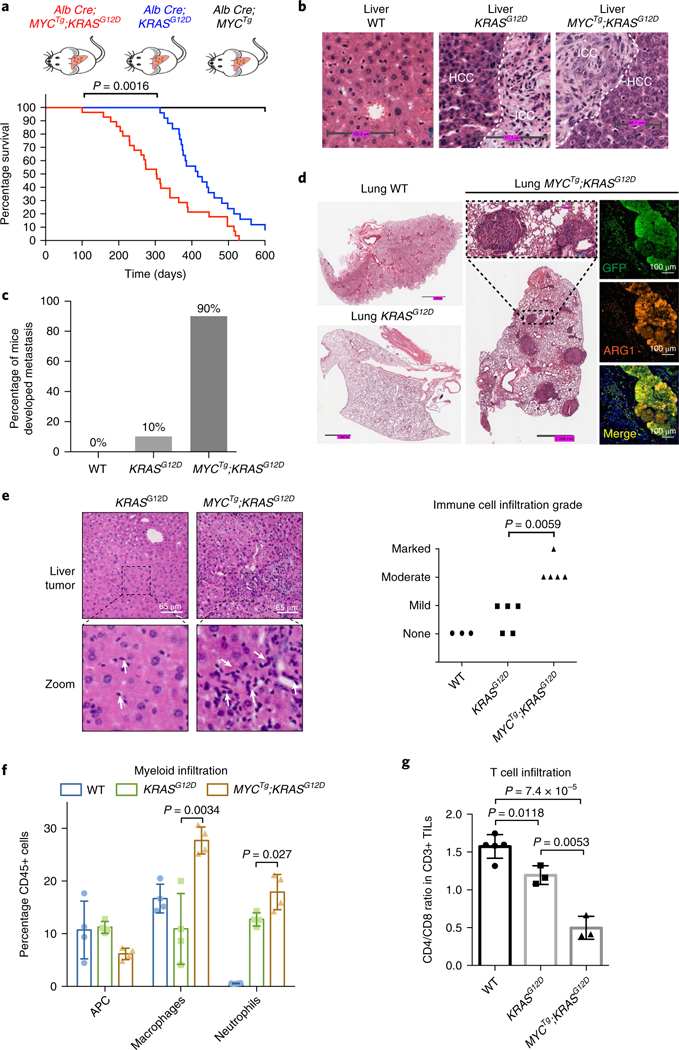
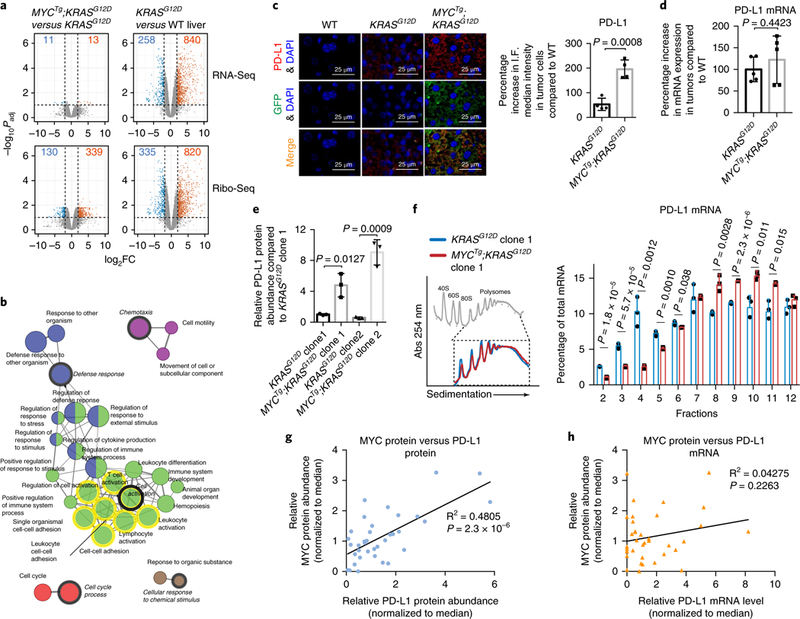
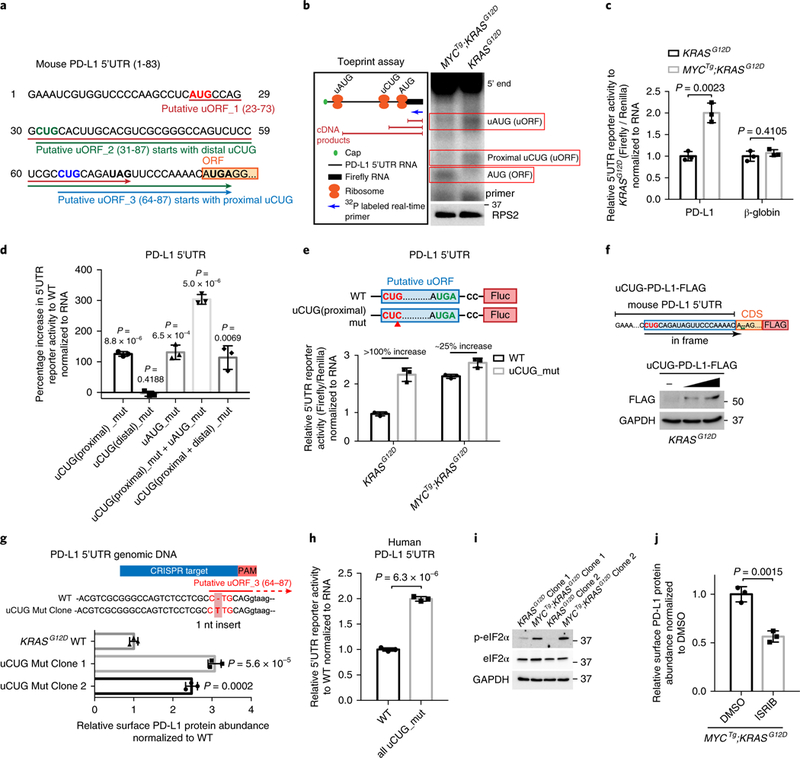
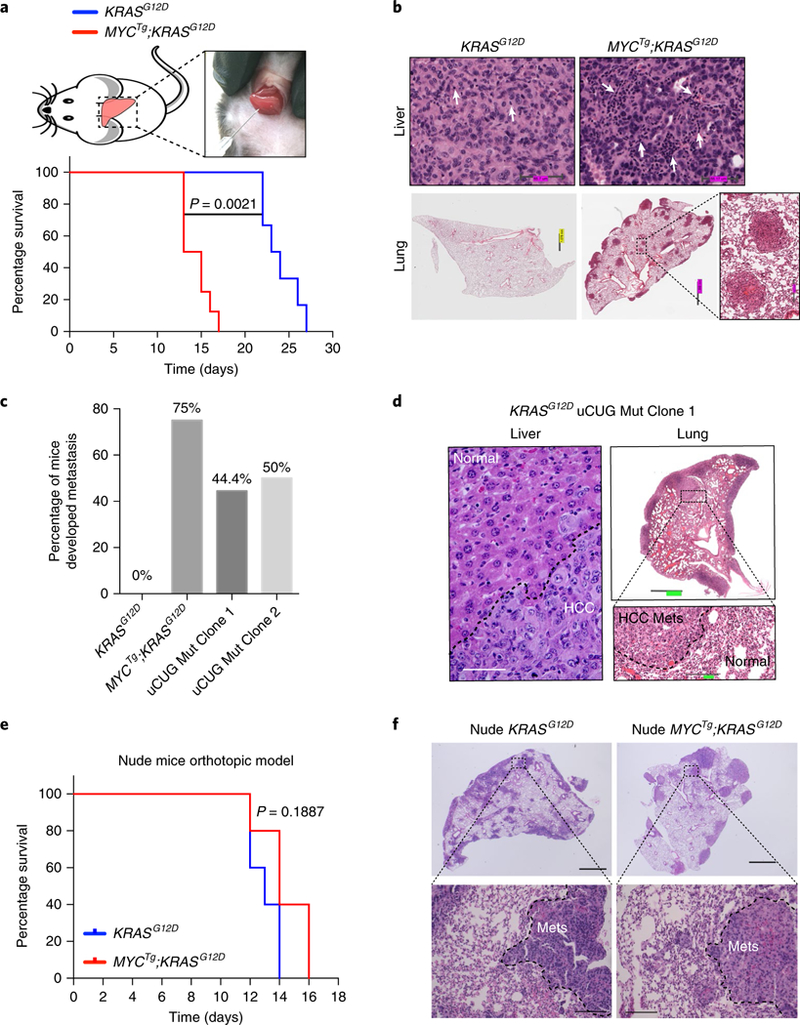
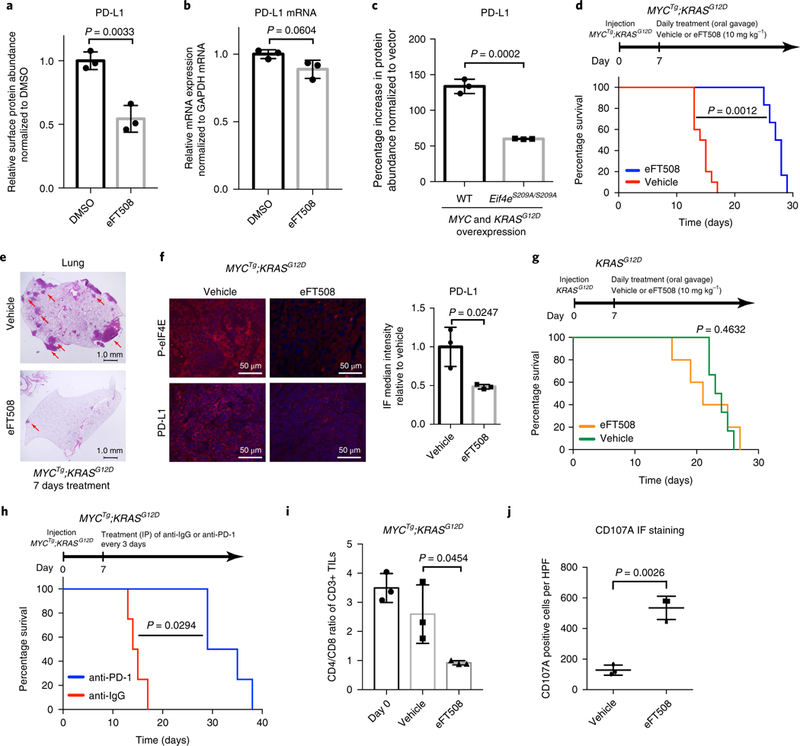
Cancer cells develop mechanisms to escape immunosurveillance, among which modulating the expression of immune suppressive messenger RNAs is most well-documented. However, how this is molecularly achieved remains largely unresolved. Here, we develop an in vivo mouse model of liver cancer to study oncogene cooperation in immunosurveillance. We show that MYC overexpression (MYCTg) synergizes with KRASG12D to induce an aggressive liver tumor leading to metastasis formation and reduced mouse survival compared with KRASG12D alone. Genome-wide ribosomal footprinting of MYCTg;KRASG12 tumors compared with KRASG12D revealed potential alterations in translation of mRNAs, including programmed-death-ligand 1 (PD-L1). Further analysis revealed that PD-L1 translation is repressed in KRASG12D tumors by functional, non-canonical upstream open reading frames in its 5' untranslated region, which is bypassed in MYCTg;KRASG12D tumors to evade immune attack. We show that this mechanism of PD-L1 translational upregulation was effectively targeted by a potent, clinical compound that inhibits eIF4E phosphorylation, eFT508, which reverses the aggressive and metastatic characteristics of MYCTg;KRASG12D tumors. Together, these studies reveal how immune-checkpoint proteins are manipulated by distinct oncogenes at the level of mRNA translation, which can be exploited for new immunotherapies.


Figures

Fig. 1 |
Fig. 1 |. MYC and KRAS cooperate to promote liver cancer with metastatic potential and induce marked alterations of immune populations compared with KRAS alone.
a, Kaplan–Meier curves showing tumor-free survival of MYCTg;KRASG12D, KRASG12D, and MYCTg mice. n = 22 per genotype (log-rank test). b, Representative wild-type (WT), KRASG12D, or MYCTg;KRASG12D mice liver histology, n = 3 independent experiments is shown. ICC: intrahepatic cholangiocarcinoma (scale bars, WT: 103.3 μm, KRASG12D: 111.3 μm, MYCTg;KRASG12D: 65.7 μm). c, Percentage of wild-type (n = 3) KRASG12D (n = 10) or MYCTg;KRASG12D (n = 10) mice developed lung metastasis during cancer development. d, Representative wild-type, KRASG12D and MYCTg;KRASG12D mice lung histology, n = 5 independent experiments are shown. Immunofluorescence staining for GFP (indication of MYC overexpression), ARG1 (arginase-1, HCC marker, not expressed in the lung), and DAPI in MYCTg;KRASG12D lung section. e, Left: representative HCC histology in KRASG12D and MYCTg;KRASG12D mice showing different grades of immune infiltration, n = 3 independent experiments (scale bars, 65 μm). White arrows represent inflammatory cell infiltration. Right: clinical evaluation of the grade of immune cells infiltration of the liver histology of wild-type (n = 3), KRASG12D (n = 5), and MYCTg;KRASG12D (n = 5) mice (none: 0/HPF, mild: 1–3 per HPF, moderate 4–10 per HPF, marked >10 per HPF). Two-sided t test. f, Quantifications by flow cytometry of antigen-presenting cell (APC) (CD45+, CD11b–, CD11c + ), macrophages (CD45 + , CD11b + , CD11c–, Ly6G/C–), and neutrophils (CD45+, CD11b+, CD11c–, Ly6G/C+) infiltrations into the liver tumors of wild-type, KRASG12D, or MYCTg;KRASG12D mice. n = 4. Two-sided t test. g, CD4/CD8 T cell ratio in wild-type liver (n = 5), KRASG12D (n = 3), and MYCTg;KRASG12D (n = 3) mice liver tumors. Two-sided t test. TILs: tumor-infiltrating lymphocytes. All values represent the mean ± s.d.
Fig. 2 |
Fig. 2 |. A dichotomy in gene regulation between transcription versus translational control in KRASG12D versus MYCTg;KRASG12D tumors.
a, Differential gene expression analysis shown as volcano plots, comparing MYCTg;KRASG12D (n = 2 animals) to KRASG12D (n = 2 animals) (left panel), and comparing KRASG12D (n = 2 animals) to wild type (n = 3 animals) (right panel) with RNA-Seq on the top and Ribo-Seq on the bottom. P values (two-sided t test) were adjusted using the Benjamini–Hochberg procedure for multi-testing. Dashed lines mark the threshold of significance in this study: the horizontal line marks the statistical significance (Padj< 0.1) and the vertical lines mark the fold change (FC) (|log2FC| > 2). The numbers of genes that pass this threshold are shown, with downregulated genes in blue and upregulated genes in orange. b, The network of enriched gene ontology categories (biological process) among 339 genes that are upregulated in Ribo-Seq comparing MYCTg;KRASG12D to KRASG12D (Padj< 0.1 and log2FC > 2). The gene ontology network reflects the relationships between the gene ontology categories on the basis of the similarity of their associated genes, generated by ClueGO. Each node represents one enriched gene ontology category, with the size of the node representing the term enrichment significance (right-sided hypergeometric test). Edges indicate similarity (Kappa score > 0.4) between the two connected gene ontology categories. Gene ontology categories are clustered into functional groups represented by different color codes. The mixed color coded nodes are shared between two functional groups. The most significantly enriched gene ontology category from each group is designated as the leading group term and highlighted in italics. The gene ontology terms that PD-L1 belongs to are highlighted in yellow circles. c, Left: representative PD-L1, GFP (indication of MYC overexpression) and DAPI immunofluorescence staining of wild-type mice livers, KRASG12D, or MYCTg;KRASG12D mice liver tumors (scale bars, 25 μm). Right: quantification of percentage increase in PD-L1 median intensity in KRASG12D and MYCTg;KRASG12D tumor cells relative to the wild type. n = 4 independent experiments, two-sided t test. d, Percentage increase in PD-L1 mRNA expression levels in KRASG12D or MYCTg;KRASG12D mice liver tumors relative to wild type, normalized to glyceraldehyde 3-phosphate dehydrogenase (GAPDH) mRNA. n = 5. e, Flow cytometry assessment of PD-L1 protein abundance in the KRASG12D and MYCTg;KRASG12D HCC cell lines, n = 3 independent experiments, two-sided t test. f, Left: representative polysome trace of KRASG12D and MYCTg;KRASG12D cell lines, n = 3 independent experiments. Inset highlights the polysomal fractions (7–12). Right: qualitative PCR with reverse transcription (RT-qPCR) analysis of PD-L1 mRNA levels in fractions, percentages of PD-L1 mRNA distributed in each fraction against total PD-L1 mRNA are shown. Two-sided t test. g, Comparison of relative MYC and PD-L1 protein abundance (normalized to median) in 36 fresh frozen human HCC patient samples by western blot. The 95% confidence interval for the Pearson coefficients is 0.4722–0.8322 (Pearson’s correlation test, two-sided P = 2.3×10⁻⁶). h, Comparison of relative MYC protein abundance and relative PD-L1 mRNA expression (normalized to median) in 36 fresh frozen human HCC patient samples. The 95% confidence interval for the Pearson coefficients is –0.1307 to 0.5012 (Pearson’s correlation test, two-sided P = 0.2263). All values represent the mean± s.d.
Fig. 3 |
Fig. 3 |. PD-L1 expression is upregulated in MYCTg;KRASG12D cells through a bypass in uORF-mediated translational repression.
a, The sequence of the 5′UTR of mouse PD-L1 mRNA containing three putative uORFs initiating from uAUG, uCUG(distal), and uCUG(proximal), respectively. Stop codons for each putative uORF are in bold. b, Left: schematics of the toeprint assay. mRNAs composed of mouse PD-L1 5′UTR linked with firefly luciferase were used as the toeprint assay template. Right: autoradiography of the complementary DNA products from the toeprint assay using cytoplasmic lysate from KRASG12D and MYCTg;KRASG12D cell lines. Red boxes highlight the bands indicating ribosome recognitions of the uAUG, uCUG(proximal), and AUG of the main ORF. RPS2 western blot is shown as controls for the amount of ribosomes supplied in each reaction. c, 5′UTR reporter activity of mouse PD-L1 uORF-luciferase and β-globin 5′UTR luciferase (control) in KRASG12D and MYCTg;KRASG12D cell lines. Two-sided t test, n = 3 independent experiments. d, Percentage increase in the 5′UTR reporter activity of mouse PD-L1 uORF-luciferase with point mutations (CU’G’ to CU’C’ or AU’G’ to AU’C’) in the three upstream start codons over that with wild type, in KRASG12D cells. Two-sided t test, n = 3. e, 5′UTR reporter activity of mouse PD-L1 uORF-luciferase with and without a point mutation (CU’G’ to CU’C’) in the proximal uCUG start codon, in KRASG12D and MYCTg;KRASG12D cells. n = 3 independent experiments. Percentages of increase (100% in KRASG12D and 25% in MYCTg;KRASG12D) in the luciferase activity of the uCUG mutation compared with wild type (WT) were shown. f, Upper: constructs for expressing a FLAG-tagged PD-L1 with ‘AUG’ start codon mutation (A’UGA’ to A’A’) (uCUG-PD-L1-FLAG). Lower: western blot of FLAG and GAPDH in KRASG12D cell lines after 48-h transfection, n = 3 independent experiments. g, Upper: mouse PD-L1 5′UTR exon and intron DNA sequence of the wild-type (WT) and uCUG mutation KRASG12D clonal cell line are shown. PAM region (AGG) is highlighted in red, which spans the 5′UTR exon and intron; CRISPR target region that against the 5′UTR exon is labeled in blue. 1 nucleotide (nt) insertion (CTG to C”T”TG) is detected in the uCUG start codon after the CRISPR/Cas9 editing. Lower: relative PD-L1 abundance in wild-type and two-mutation clonal cell lines determined by flow cytometry. Two-sided t test, n = 3 independent experiments. h, 5′UTR reporter activity of human PD-L1 uORF-luciferase with and without point mutations (CU’G’ to CU’C’) in the uCUG start codons in SNU-449 human HCC cell line (wild type, WT). Two-sided t test, n = 3 independent experiments. i, Western blot of p-eIF2α, eIF2α and GAPDH in KRASG12D and MYCTg;KRASG12D cell lines. j, Relative PD-L1 protein abundance assessed by flow cytometry in MYCTg;KRASG12D cell lines treated with DMSO or 0.5 μM ISRIB for 72h. Two-sided t test, n = 3 independent experiments. All values represent the mean± s.d. Uncropped blots are provided in Supplementary Fig 15.
Fig. 4 |
Fig. 4 |. The metastatic potential of MYCTg;KRASG12D tumors is dependent on PD-L1-mediated immune suppression.
a, Kaplan–Meier curves showing the survival of male C57/BL6 mice with KRASG12D (n = 6) and MYCTg;KRASG12D (n = 8) cells orthotopically injected into livers. Wilcoxon rank sum test. b, Representative histology of livers and lungs of orthotopic KRASG12D (n = 5) and MYCTg;KRASG12D (n = 5) C57BL/6 mice. White arrows represent inflammatory cell infiltration. c, Percentage of C57BL/6 mice injected with KRASG12D (n = 6), MYCTg;KRASG12D (n = 8), KRASG12D Mut Clone 1 (n = 9), or KRASG12D Mut Clone 2 (n = 8) cells developed metastasis. d, Representative histology of livers and lungs of orthotopic KRASG12D Mut Clone 1 mice (n = 5). Scale bars: left, 50 μm; upper right, 909.6 μm; lower right, 151.4 μm. e, Kaplan–Meier curves showing the survival of male athymic nude mice with KRASG12D (n = 5) and MYCTg;KRASG12D (n = 5) cells orthotopically injected into the livers of nude mice. Wilcoxon rank sum test. f, Representative histology of lungs of orthotopic KRASG12D (n = 5) and MYCTg;KRASG12D (n = 5) nude mice. Upper images: scale bar, 1,000 μm. Lower images: scale bar, 100 μm. Mets, metastases.
Fig. 5 |
Fig. 5 |. p-eIF4E inhibition by eFT508 reduces PD-L1 abundance and prevents liver cancer progression and metastasis in vivo.
a, Relative surface PD-L1 abundance assessed by flow cytometry in MYCTg;KRASG12D cell lines treated with DMSO or 0.5 μM eFT508 for 72 h. n = 3 independent experiments, two-sided t test. b, Relative PD-L1 mRNA expression in KRASG12D cell lines treated with DMSO or eFT508 for 48h. n = 3 independent experiments, two-sided t test. c, Percentage increase in the PD-L1 abundance in MYC and KRASG12D overexpressed hepatocytes from wild type and Eif4eS209A/S209A, compared with control vector transfected wild-type (WT) and Eif4eS209A/S209A hepatocyte, respectively, assessed by flow cytometry. n = 3 independent experiments, two-sided t test. d, Kaplan–Meier curves showing the survival of male C57/B6 mice with MYCTg;KRASG12D cells orthotopically injected into the livers. Vehicle (n = 10 animals) or eFT508 (10 mg kg–1) (n = 6 animals) was orally administered once a day starting 7 d post-tumor implantation. Wilcoxon rank sum test. e, Representative histology of lungs of MYCTg;KRASG12D injected mice after 7 d vehicle or eFT508 treatments (scale bars, 1.0 mm). Red arrows present metastases in the lungs. n = 5 animals. f, Immunofluorescence staining (IF) for p-eIF4E, PD-L1, and DAPI in MYCTg;KRASG12D liver section on 7d vehicle or eFT508 treatments, n = 3 independent experiments, two-sided t test (scale bars, 50 μm). g, Kaplan–Meier curves showing the survival of male C57/B6 mice with KRASG12D cells orthotopically injected into the livers. Vehicle (n = 6 animals) or eFT508 (10 mgkg–1) (n = 5 animals) was orally administered once a day starting 7 d post tumor implantation. Wilcoxon rank sum test. h, Kaplan–Meier curves showing the survival of male C57/B6 mice with MYCTg;KRASG12D cells orthotopically injected into the livers. Monoclonal antibodies against IgG (n = 4 animals) or PD-1 (200 μg per mouse) (n = 4 animals) were administered by intraperitoneal (IP) injection every 3 d starting 7 d post-implantation. Wilcoxon rank sum test. i, CD4/CD8 T cell ratio in the livers of mice injected with MYCTg;KRASG12D cells on 7-d vehicle (n = 3 animals) or eFT508 (n = 3 animals) treatment. Two-sided t test. j, Quantification of CD107A immunofluorescence intensity in MYCTg;KRASG12D liver section on 7-d vehicle (n = 3 animals) or eFT508 (n = 3 animals) treatments. Two-sided t test. All values represent the mean± s.d.

References

    1. Chen DS & Mellman I Oncology meets immunology: the cancer-immunity cycle. Immunity 39, 1–10 (2013). - PubMed
    1. Casey SC et al. MYC regulates the antitumor immune response through CD47 and PD-L1. Science 352, 227–231 (2016). - PMC - PubMed
    1. Marzec M et al. Oncogenic kinase NPM/ALK induces through STAT3 expression of immunosuppressive protein CD274 (PD-L1, B7-H1). Proc. Natl Acad. Sci. USA 105, 20852–20857 (2008). - PMC - PubMed
    1. Stewart BW & Wild C World Cancer Report 2014 (International Agency for Research on Cancer WHO Press, 2014).
    1. Ally A et al. Comprehensive and integrative genomic characterization of hepatocellular carcinoma. Cell 169, 1327 (2017). - PMC - PubMed

Publication types

MeSH terms