. 2019 Mar;25(3):448-453.
doi: 10.1038/s41591-018-0324-z. Epub 2019 Jan 14.

Healthy infants harbor intestinal bacteria that protect against food allergy

Affiliations

Healthy infants harbor intestinal bacteria that protect against food allergy

Taylor Feehley et al. Nat Med. 2019 Mar.

Abstract

There has been a striking generational increase in life-threatening food allergies in Westernized societies1,2. One hypothesis to explain this rising prevalence is that twenty-first century lifestyle practices, including misuse of antibiotics, dietary changes, and higher rates of Caesarean birth and formula feeding have altered intestinal bacterial communities; early-life alterations may be particularly detrimental3,4. To better understand how commensal bacteria regulate food allergy in humans, we colonized germ-free mice with feces from healthy or cow's milk allergic (CMA) infants5. We found that germ-free mice colonized with bacteria from healthy, but not CMA, infants were protected against anaphylactic responses to a cow's milk allergen. Differences in bacterial composition separated the healthy and CMA populations in both the human donors and the colonized mice. Healthy and CMA colonized mice also exhibited unique transcriptome signatures in the ileal epithelium. Correlation of ileal bacteria with genes upregulated in the ileum of healthy or CMA colonized mice identified a clostridial species, Anaerostipes caccae, that protected against an allergic response to food. Our findings demonstrate that intestinal bacteria are critical for regulating allergic responses to dietary antigens and suggest that interventions that modulate bacterial communities may be therapeutically relevant for food allergy.


Figures

Extended Data Figure 1.
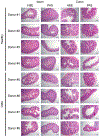
Extended Data Figure 1.. Sensitization of healthy- or CMA-colonized mice with BLG+CT does not result in intestinal pathology.
Representative images of histological samples from BLG+CT sensitized healthy- or CMA-colonized mice 24 hours post-challenge for donors #1 (healthy) and #5 (CMA, see Supplementary Table 1). All sections stained with H&E or PAS, as indicated. Scale bars = 100μm.
Extended Data Figure 2.
Extended Data Figure 2.. Long term colonization of GF mice with feces from healthy or CMA infants does not lead to intestinal pathology.
Representative images of histological samples from unsensitized healthy- or CMA-colonized mice collected 5 to 6 months post-colonization for donors described in Supplementary Table 1. All sections stained with H&E or PAS, as indicated. Scale bars = 100μm.
Extended Data Figure 3.
Extended Data Figure 3.. Diversity analysis of fecal samples from healthy- or CMA-colonized mice.
(a) Shannon Diversity index and (b) Pielou’s Evenness index in feces from healthy- (orange) and CMA- (blue) colonized mice from Fig. 2a. n=1-3 mice per colonized mouse group (8 healthy, 9 CMA) with feces taken at 2 and 3 weeks post-colonization, see Methods). Each circle represents one fecal sample, bars represent mean±S.E.M. The eight human formula-fed fecal donors are described in Supplementary Table 1.
Extended Data Figure 4.
Extended Data Figure 4.. Transfer of a healthy, exclusively breast-fed infant microbiota protects against an anaphylactic response to sensitization with BLG+CT.
(a) Change in core body temperature at indicated time points following first challenge with BLG of mice colonized with feces from breast-fed healthy or CMA donors (n=13 mice per group, pooled from at least two independent experiments). (b) serum BLG-specific IgE, (c) BLG-specific IgG1 and (d) mMCPT-1 from mice in a. Four of the BLG+CT sensitized CMA-colonized mice died of anaphylaxis following challenge. For a, symbols represent mean, bars represent S.E.M. For b-d, symbols represent individual mice, bars represent mean+S.E.M. Linear mixed-effect models were used to compare groups in a, two-sided Student’s t-test in b after log transformation. The two human breast-fed fecal donors are described in Supplementary Table 2. *P<0.05.
Extended Data Figure 5.
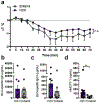
Extended Data Figure 5.. Continuous exposure to cow’s milk does not induce tolerance to BLG in GF mice.
GF mice fed water or Enfamil were sensitized to BLG as described in the legend to Fig. 1. (a) Change in core body temperature at indicated time points following first challenge with BLG of mice fed with water (n=12) or Enfamil (n=10) pooled from three independent experiments. (b) Serum BLG-specific IgE, (c) BLG-specific IgG1 and (d) mMCPT-1 from mice in a. For a, circles represent mean, error bars represent S.E.M. For b-d, circles represent individual mice, bars represent mean+S.E.M. Linear mixed-effect models were used to compare groups in a and two-sided Student’s t-test in b-d after log transformation. **P<0.01.
Extended Data Figure 6.
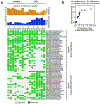
Extended Data Figure 6.. Binary representation of protective and non-protective OTUs in CMA and healthy donors and colonized mouse groups
(a) Binary map of the presence/absence ratio of protective/non-protective OTUs in CMA and healthy donors with the same layout as Fig. 2a. Columns depict each donor (D) (n=4 in healthy donor group, n=4 in CMA donor group, with 2 or 3 technical replicates per donor) or colonized mouse group (m) (n=8 mice in healthy group, with 1, 2, 3, 2 mice per colonized mouse group of donor #1 to #4; n=9 mice in CMA group, with 1, 2, 4, 2 mice per colonized mouse group of donor #5 to #8; for each individual mouse, 1-2 fecal samples were collected at 2 and 3 weeks post-colonization, see Methods). Rows show 58 OTUs FDR controlled at 0.10 (see Methods) in human CMA vs healthy donor comparison, present in at least 4 human fecal samples and at least two groups of colonized mice (see Supplementary Table 3). Columns depict each donor (D) or colonized mouse group (m). The bar graphs above the grid map represent the total number of potentially protective (more abundant in healthy donors; orange) and potentially non-protective (more abundant in CMA donors; blue) OTUs in each individual donor or mouse group. The grid map represents presence (green) or absence (white) of protective and non-protective OTUs in each sample. (b) A protective/non-protective OTU ratio was computed per individual donor or mouse group from a, taking into consideration the presence or absence of 58 OTUs. The donors and their murine transfer recipients are shown in squares and circles, respectively. Vertical dashed line represents a ratio of 2.6.
Extended Data Figure 7.
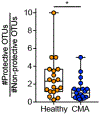
Extended Data Figure 7.. Validation of protective/non-protective OTU ratio using a larger, independent cohort of healthy and CMA infant donors.
Box plots showing the protective/non-protective OTU ratio (see Fig. 2 and Extended Data Fig. 6) in fecal samples from healthy (n=19) and CMA (n=19) infants from ref. . The horizontal center line indicates the median, the boxes represent the 25th and 75th percentiles, and the whiskers extend to the farthest data point within a maximum of 1.5 times the interquartile range (IQR), All individual points are shown, with each circle denoting a subject. Out of the 58 OTUs shown in Fig. 2a, 55 OTUs were assigned with known reference IDs and 3 with new reference IDs. The new reference OTU IDs are not comparable across the different analysis cohorts, therefore we focused on the OTUs with known reference IDs. Among the 55 known OTUs, 52 (29 protective OTUs and 23 non-protective OTUs) were detected in this cohort and used for the ratio calculation (see Methods). The other 3 were not detected.. Two-sided Wilcoxon rank sum test P value is shown. *P<0.05.
Extended Data Figure 8.
Extended Data Figure 8.. The healthy vs CMA OTU abundance ratio is significantly correlated between mouse fecal and ileal samples.
(a) Bubble plots show a similar pattern in fecal (n=8 mice in healthy group, n=9 mice in CMA group, with fecal samples collected at 2 and 3 weeks post-colonization, same as in Fig. 2a) and ileal samples (n=22 mice in healthy group, n=25 mice in CMA group) from healthy- and CMA-colonized mice. 58 OTUs significantly differentially abundant between CMA and healthy donors are shown in the same order as in Fig. 2a. The size of the circle indicates the magnitude of relative abundance enrichment towards either CMA or healthy. Color intensity indicates the statistical significance computed using the DS-FDR permutation test (see Methods). (b and c) The healthy vs CMA OTU abundance ratio is significantly correlated between mouse fecal and ileal samples. Each dot represents one individual OTU. For b, for each OTU, its average abundance was calculated at the group level among 8 healthy-colonized and 9 CMA-colonized mice for the fecal samples, and among 22 healthy-colonized and 25 CMA colonized mice for the ileal samples. The ratios of OTU abundance in the feces are plotted on the x-axis with the ratio of OTU abundance in the ileum on the y-axis. For c, n=35 (15 healthy-colonized and 20 CMA-colonized) mice pooled from at least two independent experiments were used for the calculation of both the fecal and ileal OTU abundance ratio, where fecal and ileal samples were collected from the same individual mice. For further detail see Methods.
Extended Data Fig. 9.
Extended Data Fig. 9.. Abundance of OTU259772 (Lachnospiraceae) and Anaerostipes caccae are correlated in fecal samples from healthy- and CMA-colonized mice.
(a) Abundance of OTU259772 (Lachnospiraceae) from the 16S data set and (b) abundance of Anaerostipes caccae by qPCR in fecal samples from healthy-colonized (n=7) and CMA-colonized (n=8) mice from Fig. 2. For each individual mouse, 1-2 fecal samples were collected at 2 and 3 weeks post-colonization. LD indicates samples that were below the limit of detection for the assay. (c) Spearman’s correlation between abundance of OTU259772 (Lachnospiraceae) (16S sequencing) and abundance of Anaerostipes caccae (qPCR) in fecal samples from healthy- and CMA-colonized mice from Fig. 2. Fecal samples that were above LD in both 16S and qPCR experiments are shown (n=13). Each circle represents one fecal sample. For a and b, bars show mean+S.E.M. For c, shaded bands indicate 95% confidence interval fitted by linear regression. DS-FDR method was used to compare groups in a, two-sided Student’s t-test in b. ***P<0.001.
Extended Data Figure 10.
Spearman’s correlation between abundance of Anaerostipes caccae by qPCR and RNA-Seq expression of Ror2, Fbp1, Tgfbr3, Acot12 and Me1 in ileal IECs (see Fig. 3a). Circles show individual mice and shaded bands indicate 95% confidence interval fitted by linear regression. n=36 (18 healthy and 18 CMA-colonized) mice pooled from at least two independent experiments. Samples with values above the limit of detection are shown (A. caccae abundance >0).
Figure 1.
Figure 1.. Transfer of healthy, but not CMA, infants’ microbiota protects against an allergic response to food.
(a) Change in core body temperature at indicated time points following first challenge with BLG in BLG + CT sensitized GF mice and in mice colonized with feces from each of 8 donors (4 healthy, 4 CMA, see Supplementary Table 1) n=42 (CMA), 31 (healthy) and 24 (GF) mice with 9-12 mice for each of the 8 donors, pooled from two independent experiments (b) Serum BLG-specific IgE, (c) BLG-specific IgG1 and (d) mMCPT-1 from mice in a. For a, circles represent mean, error bars represent S.E.M. For b-d, circles represent individual mice, bars represent mean+S.E.M. Linear mixed-effect models were used to compare groups in a-d with Benjamini-Hochberg FDR (BH-FDR) method for multiple testing correction. *P<0.05, **P<0.01 ***P<0.001.
Figure 2.
Figure 2.. Analysis of fecal samples from eight human infant donors reveals taxonomic signatures that correlate with allergic phenotype.
(a) Heatmap of OTUs differentially abundant between CMA and healthy donors. Rows show 58 OTUs identified as different at false-discovery rate (FDR) controlled at 0.10 and present in at least 4 human fecal samples and at least two groups of colonized mice (see Supplementary Table 3). Columns depict each donor (D). For a, n=2-3 technical replicates per donor, n=1-3 mice per colonized mouse group with feces taken at 2 and 3 weeks post-colonization (see Methods). The bar graphs above the heatmap represent the abundance score of potentially protective (orange) or non-protective (blue) OTUs calculated for each donor or mouse group. (b-d) The ratio of protective over non-protective OTUs (see Extended Data Fig. 6b) derived from colonized mice in a plotted against levels of (b) BLG-specific IgE, (c) BLG-specific IgG1, and (d) mMCPT-1 from all mice in Figure 1. Each circle represents average results from all mice colonized with each of the four healthy (orange) or CMA (blue) donor’s feces. (e) LEfSe analysis of genera that are significantly enriched in healthy-colonized mice (orange) or CMA-colonized mice (blue) from samples in a (n=8 mice in healthy group, n=9 mice in CMA group, with fecal samples collected at 2 and 3 weeks post-colonization). (f) Cladogram showing the community composition of colonized mouse samples from a, with the taxa detected as differentially abundant by LEfSe analysis colored by group (healthy=orange, CMA=blue). The discrete FDR (DS-FDR) method was used to compare groups in a and Kruskal-Wallis test in e (see Methods).
Figure 3.
Figure 3.. Unique ileal transcriptome signatures distinguish healthy- and CMA-colonized mice.
(a) Heatmap of 32 differentially expressed genes (DEGs) in ileal IECs isolated from GF (n=3), healthy-colonized (n=18) or CMA-colonized (n=18) mice pooled from at least two independent experiments at seven days post-colonization (see Supplementary Table 4). Each column depicts an individual mouse colonized with donor feces as indicated. Four types of gene expression changes are shown: (1) Up in healthy: genes that are up-regulated in healthy mice relative to both CMA and GF; (2) Up in CMA: genes that are up-regulated in CMA mice relative to both healthy and GF; (3) Down in healthy: genes that are down-regulated in healthy mice relative to both CMA and GF; and (4) Down in CMA: genes that are down-regulated in CMA mice relative to healthy and GF. (b) Gene Ontology (GO) terms and KEGG pathways (bold) significantly enriched in DEGs from a that are associated with healthy- (orange) or CMA- (blue) colonized mice. Hypergeometric test was used in b with the Benjamini-Hochberg FDR (BH-FDR) method for multiple testing correction (see Methods).
Figure 4.
Figure 4.. Correlation of ileal OTUs with DEGs in the ileum of healthy-colonized mice identifies a Clostridial species, A. caccae, that protects against an allergic response to food.
(a) Heatmap showing Spearman’s rank correlation coefficient between relative abundance of ileal OTUs (row) and expression of DEGs (column) from CMA vs healthy mouse ileal IEC samples (see Fig. 3a and Methods). (b) Spearman’s correlation between abundance of OTU259772 (Lachnospiraceae) from the ileal 16S dataset (see Supplementary Table 5) and RNA-Seq expression in ileal IECs of Ror2, Fbp1, Tgfbr3, Acot12 and Me1. Circles represent individual mice and shaded bands indicate 95% confidence interval fitted by linear regression (c) Abundance of OTU259772 (Lachnospiraceae) by 16S sequencing and (d) abundance of Anaerostipes caccae by qPCR in ileal samples from healthy- and CMA-colonized mice. LD indicates samples that were below the limit of detection for the assay. (e) Spearman’s correlation between abundance of OTU259772 (Lachnospiraceae) (16S sequencing) and abundance of Anaerostipes caccae (qPCR) in ileal samples from healthy- and CMA-colonized mice. Circles represent individual mice and shaded bands indicate 95% confidence interval fitted by linear regression. Ileal samples that were above LD in both 16S and qPCR experiments are shown (n=19). (f) Expression of Ror2, Fbp1, Tgfbr3, Acot12 and Me1 in ileal IECs isolated from GF mice and from healthy- and CMA-colonized mice or mice monocolonized with A. caccae by qPCR. Data is normalized to Hprt as the housekeeping gene and shown as the fold change in expression from GF, set as 1. (g) Change in core body temperature at indicated timepoints following first challenge with BLG in BLG + CT sensitized CMA and A. caccae-monocolonized mice. (h) Serum BLG-specific IgE (i) BLG-specific IgG1 and (j) mMCPT-1 from mice in (g). (k) IL-13 and (l) IL-4 in culture supernatants of splenocytes from CMA or A. caccae colonized mice sacrificed 24h post challenge and stimulated for 72h with BLG. For c, d, f, h, i, j, k, l circles represent individual mice, bars represent mean+S.E.M. For g, circles represent mean, bars represent S.E.M. For a-b, n=18 (healthy) or 18 (CMA) mice per group. For c-d, n=19 (healthy) or 21 (CMA) mice per group. For f, n=14 (GF), 20 (A. caccae), 18 (healthy) or 23 (CMA) mice per group. For g-j, n=16 CMA and 16 A. caccae colonized mice pooled from three independent experiments with two different CMA donors (5 and 6), bars represent mean+S.E.M. For k and l, n=6 (CMA) and 9 (A. caccae) colonized mice from one experiment, circles represent individual mice, bars represent mean+S.E.M. DS-FDR method was used to compare groups in c, two-sided Student’s t-test in d, one-way ANOVA with Bonferroni multiple testing correction in f or linear mixed-effect models in g, and two-sided Student’s t-test in h-l after log transformation. *P<0.05, **P<0.01, ***P<0.001.

Comment in

References

    1. Sicherer SH, et al. Critical Issues in Food Allergy: A National Academies Consensus Report. Pediatrics (2017). - PMC - PubMed
    1. Iweala OI & Burks AW Food Allergy: Our Evolving Understanding of Its Pathogenesis, Prevention, and Treatment. Curr Allergy Asthma Rep 16, 37 (2016). - PubMed
    1. Wesemann DR & Nagler CR The Microbiome, Timing, and Barrier Function in the Context of Allergic Disease. Immunity 44, 728–738 (2016). - PMC - PubMed
    1. Plunkett CH & Nagler CR The Influence of the Microbiome on Allergic Sensitization to Food. J Immunol 198, 581–589 (2017). - PMC - PubMed
    1. Berni Canani R, et al. Lactobacillus rhamnosus GG-supplemented formula expands butyrate-producing bacterial strains in food allergic infants. Isme j 10, 742–750 (2016). - PMC - PubMed

Publication types