. 2019 Feb;22(2):167-179.
doi: 10.1038/s41593-018-0300-4. Epub 2019 Jan 14.

ALS-implicated protein TDP-43 sustains levels of STMN2, a mediator of motor neuron growth and repair

Affiliations

ALS-implicated protein TDP-43 sustains levels of STMN2, a mediator of motor neuron growth and repair

Joseph R Klim et al. Nat Neurosci. 2019 Feb.

Abstract

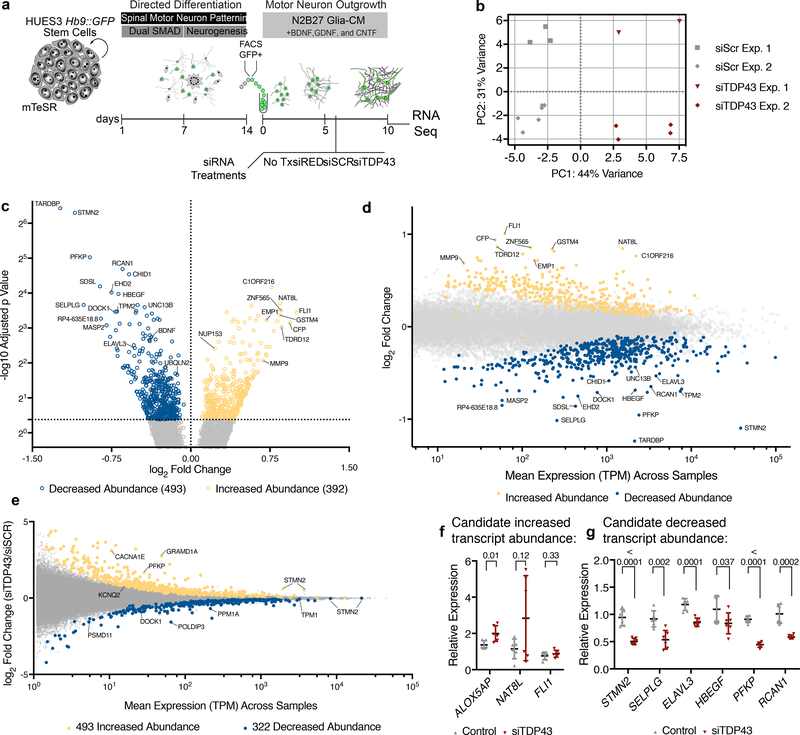
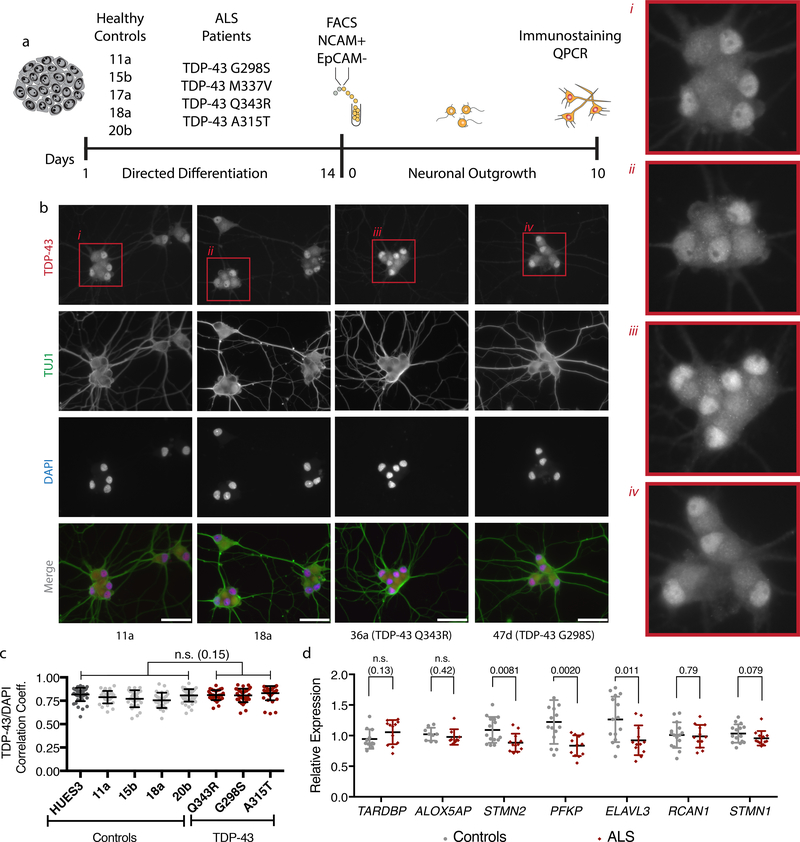
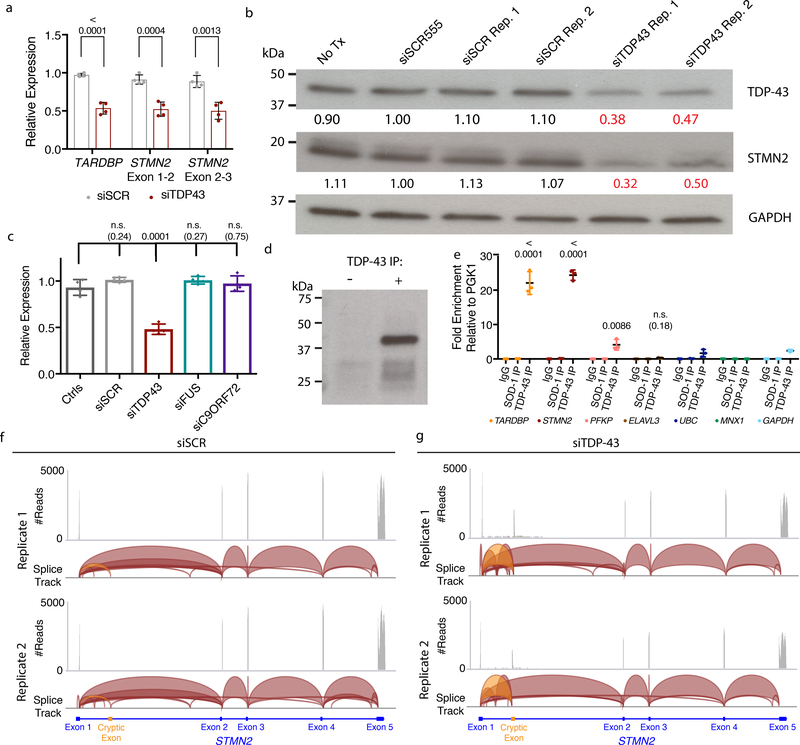
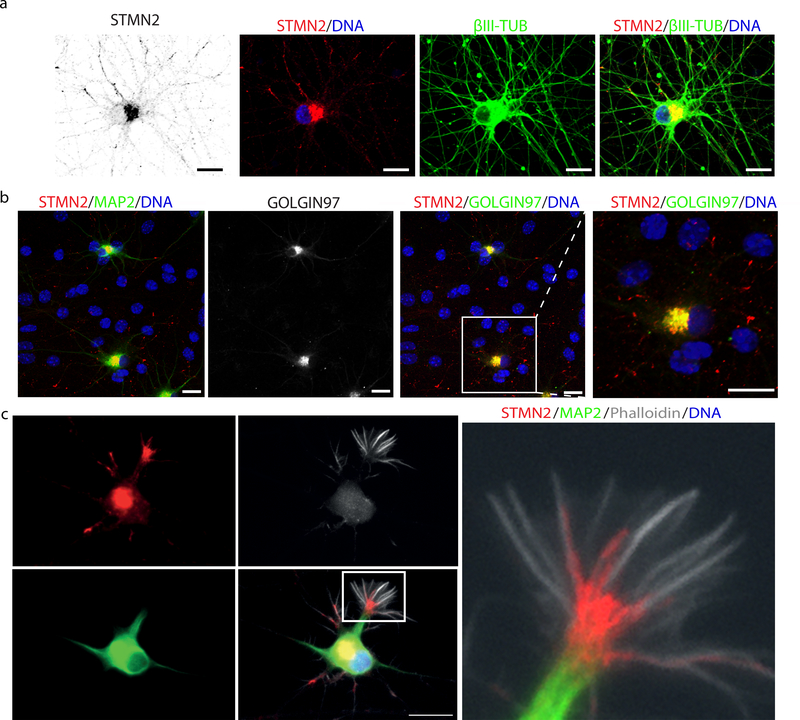
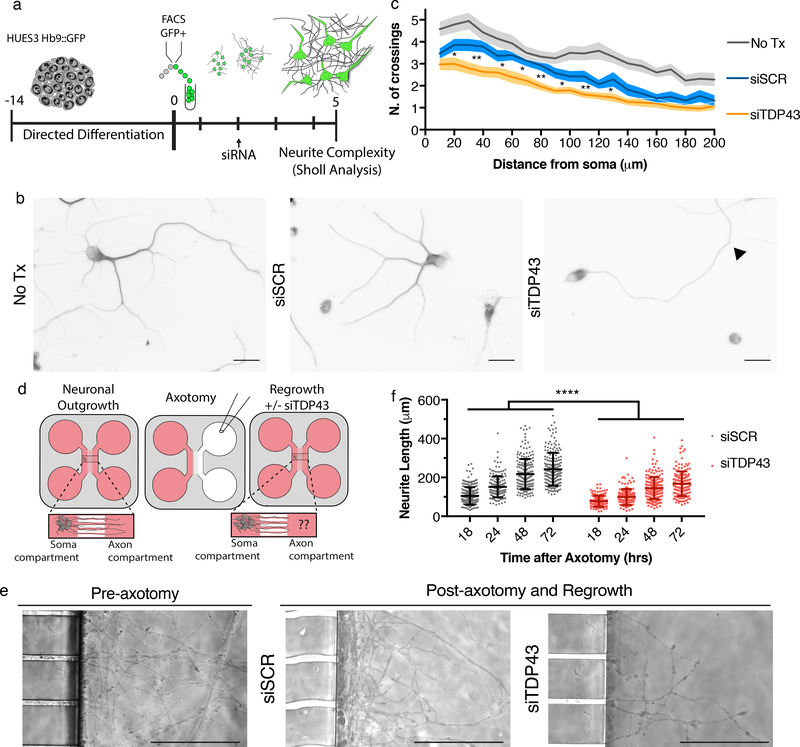
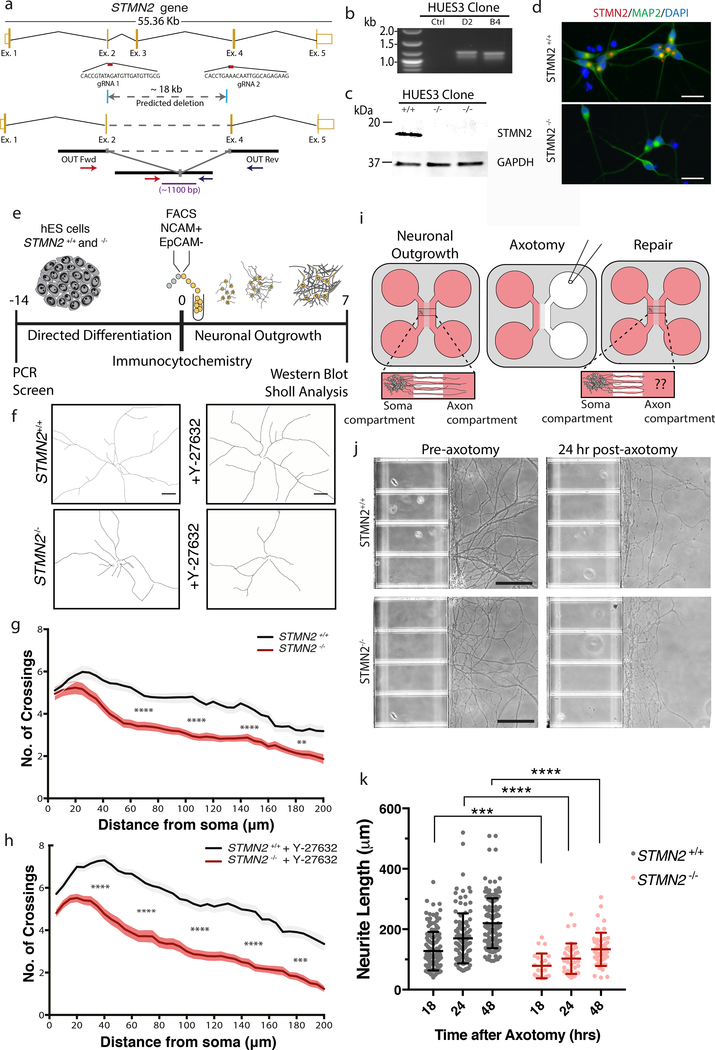
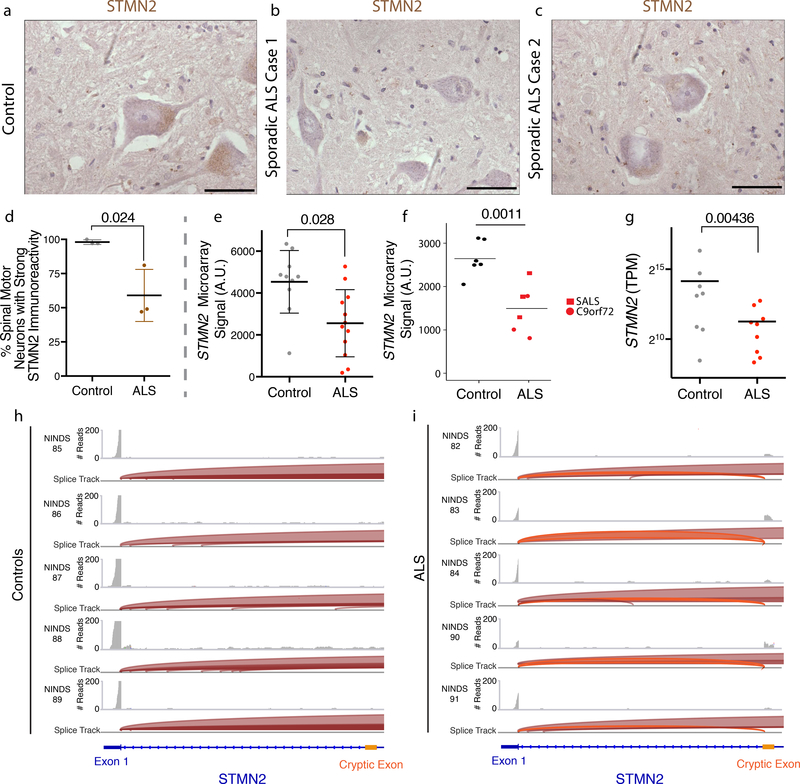
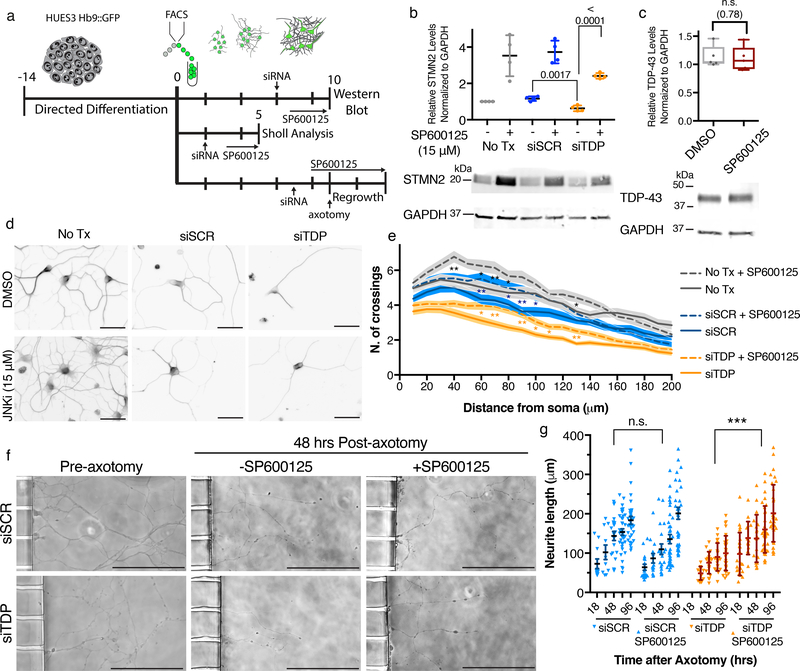
The findings that amyotrophic lateral sclerosis (ALS) patients almost universally display pathological mislocalization of the RNA-binding protein TDP-43 and that mutations in its gene cause familial ALS have nominated altered RNA metabolism as a disease mechanism. However, the RNAs regulated by TDP-43 in motor neurons and their connection to neuropathy remain to be identified. Here we report transcripts whose abundances in human motor neurons are sensitive to TDP-43 depletion. Notably, expression of STMN2, which encodes a microtubule regulator, declined after TDP-43 knockdown and TDP-43 mislocalization as well as in patient-specific motor neurons and postmortem patient spinal cord. STMN2 loss upon reduced TDP-43 function was due to altered splicing, which is functionally important, as we show STMN2 is necessary for normal axonal outgrowth and regeneration. Notably, post-translational stabilization of STMN2 rescued neurite outgrowth and axon regeneration deficits induced by TDP-43 depletion. We propose that restoring STMN2 expression warrants examination as a therapeutic strategy for ALS.


Conflict of interest statement

Competing Financial Interests

The authors have no competing financial interests.

Figures

Figure 1.
Figure 1.. RNA-Seq following TDP-43 knockdown in hMNs.
(a) hMN differentiation, purification, and RNAi strategy for TDP-43 knockdown in cultured hMNs. (b) Multidimensional scaling analysis for RNA-Seq data sets obtained from n=2 independent MN differentiation and siRNA transfection experiments based on 500 most differentially expressed transcripts. (c) Volcano plot showing transcripts with significantly altered abundance in hMNs treated with siTDP43 relative to those with scrambled controls. We tested for significant differences between control (n=9) and TDP43 knockdown (n=6) samples, which are highlighted, using the Wald test and a cutoff of 0.05 for Benjamini-Hochberg adjusted p-values with no log2 fold-change ratio cutoff. (d) Differential transcript abundance scatter plot comparing TPM values for all transcripts expressed in hMNs treated with control siRNAs versus the fold change in expression for those transcripts in cells treated with siTDP43. (e) Differential exon usage scatter plot comparing TPM values for individual exons expressed in hMNs treated with siTDP43 siRNAs versus the fold change in expression for those exons in cells treated with control siRNAs. (f-g) A subset of 9 transcripts initially identified as ‘hits’ (significantly increased abundance (f) or decreased abundance (g)) in the TDP43 knockdown experiment were selected for validation by qRT-PCR. Data are displayed as mean with SD of technical replicates from n=2 independent experiments (Unpaired t-test, two-sided, P value < 0.05).
Figure 2.
Figure 2.. A subset of transcripts with altered abundance after TDP-43 depletion also displayed altered abundance in hMNs expressing mutant TDP-43.
(a) Strategy for assessing candidate TDP-43 target transcripts in ALS patient iPS cell-derived hMNs expressing mutant TDP-43. (b) Representative micrographs of control and patient neurons immunostained for TDP-43 (red), β-III tubulin (green) and counterstained with DAPI (blue). Scale bar, 100 μm. n=4 control and 3 patient lines with similar results in two independent experiments (c) Pearson’s correlation analysis for TDP-43 immunostaining and DAPI fluorescence comparing control neurons to those with TDP-43 mutations. Dots represent individual cells and are displayed as mean with SD for 60 cells from n=4 control and 3 patient lines (Unpaired t-test, two-sided, P value < 0.05). Two independent experiments were performed. (d) qRT-PCR analysis of the transcripts with altered abundance after TDP-43 knockdown in neurons differentiated from controls or TDP-43 patients. Data are displayed as mean with SD from two independent experiments with n=4 control and 3 patient lines in experiment 1 and n=5 control and 4 patient lines in experiment 2 (Unpaired t-test, two-sided, P value < 0.05).
Figure 3
Figure 3. TDP-43 regulates STMN2 RNA and protein levels through direct interactions and suppression of a cryptic exon.
(a) qRT-PCR analysis for the STMN2 transcript using two different sets of exon spanning primer pairs. Data are displayed as mean with SD of two technical replicates from n=2 independent experiments (Unpaired t-test, two-sided, P value < 0.05). (b) Immunoblot analysis for TDP-43 and STMN2 protein levels following partial depletion of TDP-43 by siRNA knockdown. Protein levels were normalized to GAPDH and are expressed relative to the levels in hMNs treated with the siRED control. Similar results were obtained in n=2 independent experiments. (c) qRT-PCR analysis for STMN2 transcript analysis in Hb9::GFP+ hMNs treated with siRNAs targeting three ALS-linked genes (TARDBP, FUS, and C9ORF72). Data are displayed as mean with SD of replicates from n=2 independent experiments (Dunnett’s multiple comparison test, Alpha value < 0.05). Similar results were obtained in n=3 independent experiments. (d-e) Formaldehyde RNA immunoprecipitation was used to identify transcripts bound to TDP-43. After TDP-43 immunoprecipitation (d), qRT-PCR analysis was used to test for enrichment of TARDBP transcripts, STMN2, PFKP, and ELAVL3 (e) normalized to the sample input then relative to IgG and the house keeping pulled down by TDP-43. Data are displayed as mean with SD of replicates for one of n=2 independent experiments (Unpaired t-test, two-sided, P value < 0.05 compared to the house keeping genes MNX1, GAPDH, and UBC). (f-g) Visualization of RNA-seq reads mapping to STMN2 from neurons treated with scrambled siRNAs (f) or siTDP43 (g). Read coverage and splice junctions are shown for alignment of the samples to the human hg19 genome. Splice ribbons from exon 1 to the cryptic exon are highlighted in orange.
Figure 4
Figure 4. STMN2 localizes to the Golgi apparatus and growth cone in hMNs.
(a) Micrographs of Hb9::GFP+ hMNs immunostained for STMN2 (red), β-III tubulin (green) and counterstained with DAPI (blue). (b) Micrographs of Hb9::GFP+ hMNs co-cultured on glia immunostained for STMN2 (red) and MAP2 (green) and GOLGIN97 (green). (c) Micrograph of Hb9::GFP+ hMNs day 3 after sorting immunostained for STMN2 (red), MAP2 (green) and counterstained with F-actin-binding protein phalloidin (white). Scale bars, 5 μm. Similar results were obtained in n=3 independent experiments.
Figure 5
Figure 5. TDP-43 depletion leads to neurite outgrowth and axonal regrowth defects.
(a) Experimental strategy used to assess the cellular effect of TDP-43 depletion on hMN neurites. (b) Representative micrographs of hMNs treated with indicated siRNAs and immunostained for β-III tubulin to perform Sholl analysis. Arrow head indicates an example branch point. Scale bar, 50 μm. (c) Sholl analysis of hMNs after siRNA treatment. Lines represent sample means and shading represent the SEM with unpaired t-test between siTDP43 and siSCR, two-sided, P value < 0.05 with all values in Supplementary Table 1. Similar results were obtained in n=2 independent experiments. (d) Experimental strategy used to assess the cellular effect of TDP-43 depletion in hMNs after axonal injury. (e) Representative micrographs of hMNs in the microfluidics device prior to and after axotomy. Scale bars, 150 μm. (f) Measurements of axonal regeneration after axotomy. Individual neurites are displayed as dots along with the mean and SD (Unpaired t-test, two-sided, P value < 0.05 18hrs=<0.0001, 24hrs=<0.0001, 48hrs=<0.0001, and 72hrs=<0.0001). Similar results were obtained in n=4 devices from 2 independent experiments.
Figure 6
Figure 6. STMN2 mutant neurons have neurite outgrowth and regrowth deficits similar to neurons treated with siTDP43.
(a) Knockout strategy targeting two constitutive exons of the human STMN2 gene. (b-d) STMN2 elimination was confirmed in the HUES3 Hb9::GFP line by RT-PCR analysis of genomic DNA (b), by immunoblot analysis (c), and by immunofluorescence (d). Similar results were obtained from n=2 biologically independent experiments. (e) Experimental strategy used to assess the cellular effect of STMN2 elimination in hMNs. (f-h) Sholl analysis of hMNs with and without STMN2 and in the absence (g) or presence (h) of an ROCK inhibitor (Y-27632, 10 μM). Lines represent sample means and shading represent the SEM with unpaired t-test between siTDP43 and siSCR, two-sided, P value < 0.05 with all values in Supplementary Table 1. Similar results were obtained in n=2 biologically independent experiments. (i) Experimental strategy used to assess the cellular effect of STMN2 elimination in hMNs after axonal injury. (j-k) Axonal regrowth after injury. Representative micrographs of hMNs in the microfluidics device prior to and after axotomy (j). Measurements of axonal regeneration after axotomy. Individual neurites are displayed as dots along with the mean and SD (Unpaired t-test, two-sided, P value < 0.05 18hrs=0.0005, 24hrs=0.0001, 48hrs=<0.0001) (k). Similar results were obtained in n=4 devices from 2 independent experiments. Similar results were obtained in n=2 biologically independent experiments.
Figure 7
Figure 7. ALS patient spinal cord motor neurons have decreased expression of STMN2 and express transcripts containing the cryptic exon.
(a-c) Histologic analysis of human adult lumbar spinal cord from post-mortem samples collected from a subject with no evidence of spinal cord disease (control) (a) or two patients diagnosed with sporadic ALS (b-c). The experiment was performed with n= 3 controls and 3 ALS cases. STMN2 immunoreactivity in lumbar spinal motor neurons from control and ALS cases was scored as ‘strong’ or as ‘absent’. Scale bars, 50 μm. (d) The percentage of lumbar spinal motor neurons with strong STMN2 immunoreactivity was significantly lower in ALS tissue samples. Data are displayed as the mean with SD for n= 3 controls and 3 ALS cases; approximately 40 MNs were scored for each subject (Unpaired t-test, two-sided, P value < 0.05). (e-g) Meta-analysis of STMN2 transcript abundance in previously published data sets for laser captured lumbar motor neurons analyzed by microarray n= 10 controls and 12 ALS cases displayed (Rabin et al 2009, e), laser captured lower motor neurons analyzed by microarray n= 6 controls and 6 ALS cases (Highley et al 2014, f), individuals are displayed as dots with mean and SD (moderated t-test, P value < 0.05, (e-f)), and spinal cord ventral horns analyzed by RNA-Seq for n= 8 controls and 9 ALS cases, individuals are displayed as dots with mean (D’Erchia et al 2017, Wald test and a cutoff of 0.1 for Benjamini-Hochberg adjusted p values with no log2 fold-change ratio cutoff, (g)). (h-i) Visualization of the cryptic exon for STMN2 from the NINDS datasets (g) for the ventral horns of controls (h) and sporadic ALS patient (i) spinal cords. Read coverage and splice junctions are shown for alignment of the samples to the human hg19 genome. Splice ribbons from exon 1 to the cryptic exon are highlighted in orange.
Figure 8
Figure 8. STMN2 protein and outgrowth deficits following TDP-43 depletion can be rescued by JNK inhibition.
(a) Experimental strategy used to assess the effect of JNK inhibitor SP600125, 15 μM, on STMN2 protein levels and neurite outgrowth after TDP-43 depletion. (b) Immunoblot analysis for STMN2 protein levels following partial depletion of TDP-43 by siRNA knockdown and then treatment with SP600125 for 3 days. Protein levels were normalized to GAPDH and are expressed relative to the levels in hMNs not treated with the siRNAs. Data are displayed as mean with SD of technical replicates from n=2 independent experiments (Unpaired t-test, two-sided, P value < 0.05). (c) Immunoblot analysis for TDP-43 protein levels in hMNs treated with SP600125 for 3 days. Protein levels were normalized to GAPDH and are expressed relative to the levels in hMNs treated with DMSO. Data are displayed as mean with SD of technical replicates from n=2 independent experiments (Unpaired t-test, two-sided, P value < 0.05). (d) Representative micrographs of HUES3 hMNs treated with indicated siRNAs with and without SP600125 for 3 days before being immunostained for β-III tubulin to perform Sholl analysis. Scale bar, 100 μm. (e) Sholl analysis of hMNs after siRNA treatment with and without SP600125. Lines represent sample means and shading represent the SEM. Data represent n= 60 cells (Unpaired t-test between samples with and without SP600125, two-sided, P value < 0.05). Similar results were obtained in n=2 independent experiments. (f-g) Axonal regrowth after injury. Representative micrographs of hMNs in the microfluidics device prior to and after axotomy with and without SP600125 (f). Measurements of axonal regeneration after axotomy. Individual neurites are displayed as dots along with the mean and SD (Unpaired t-test, two-sided, P value < 0.05 (siTDP43 vs siTDP43 SP600125; 24hr=<0.0001, 48hrs=0.0002, 72rs=<0.0001, 96hrs=<0.0001)(siSCR vs siSCR SP600125; 18hr=0.52, 24hr=0.48, 48hrs=0.062, 72rs=0.19, 96hrs=0.39). Similar results were obtained in n=2 independent experiments.

References

    1. Taylor JP, Brown RH & Cleveland DW Decoding ALS: from genes to mechanism. 539, 197–206 (2016). - PMC - PubMed
    1. Ravits J et al. Deciphering amyotrophic lateral sclerosis: What phenotype, neuropathology and genetics are telling us about pathogenesis. Amyotroph Lateral Scler Frontotemporal Degener 14, 5–18 (2013). - PMC - PubMed
    1. Miller RG, Mitchell JD & Moore DH Riluzole for amyotrophic lateral sclerosis (ALS)/motor neuron disease (MND). Cochrane Database Syst Rev 3, CD001447 (2012). - PubMed
    1. Ling S-C, Polymenidou M & Cleveland DW Converging mechanisms in ALS and FTD: disrupted RNA and protein homeostasis. Neuron 79, 416–438 (2013). - PMC - PubMed
    1. Neumann M et al. Ubiquitinated TDP-43 in frontotemporal lobar degeneration and amyotrophic lateral sclerosis. Science 314, 130–133 (2006). - PubMed

Publication types