. 2019 Feb;22(2):218-228.
doi: 10.1038/s41593-018-0305-z. Epub 2019 Jan 14.

Active control of arousal by a locus coeruleus GABAergic circuit

Affiliations

Active control of arousal by a locus coeruleus GABAergic circuit

Vincent Breton-Provencher et al. Nat Neurosci. 2019 Feb.

Abstract

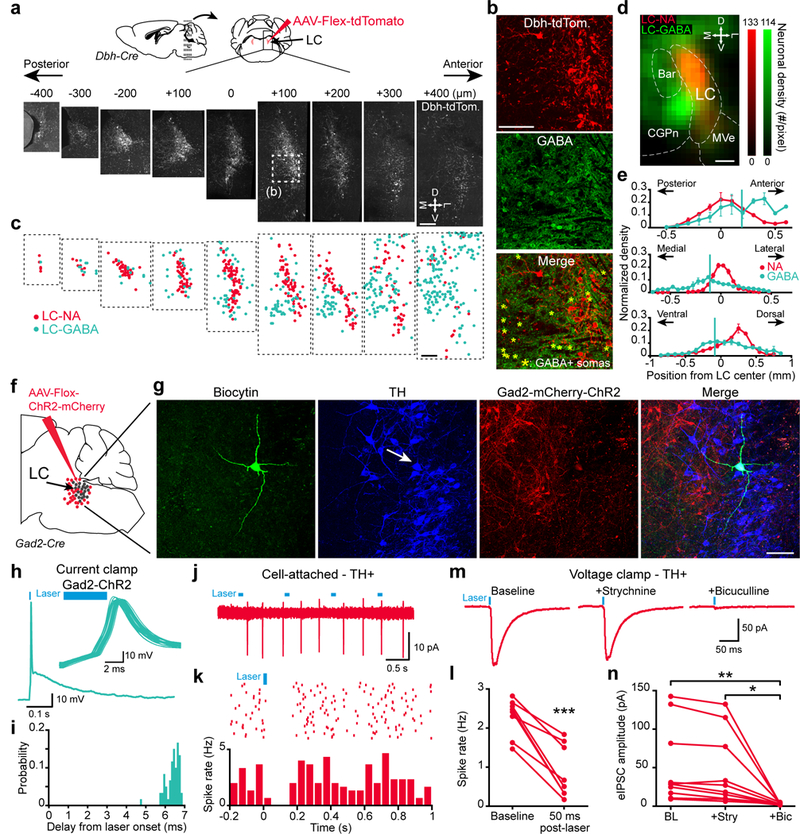
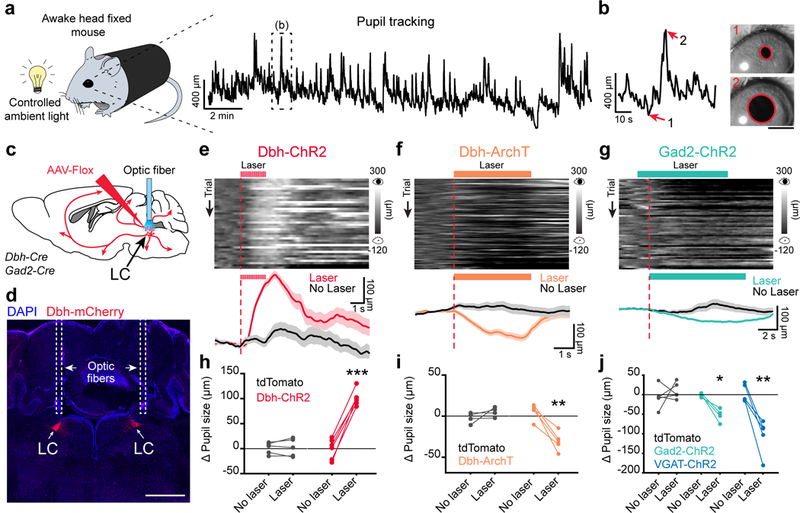
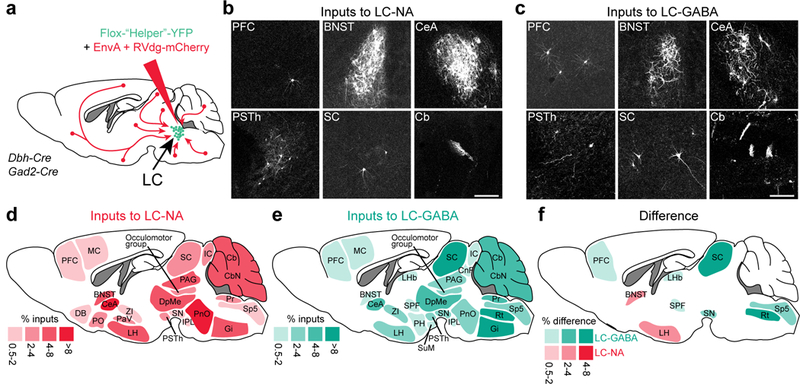
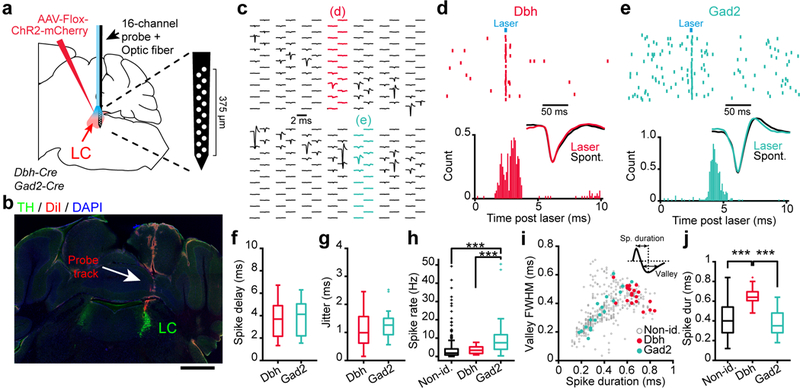
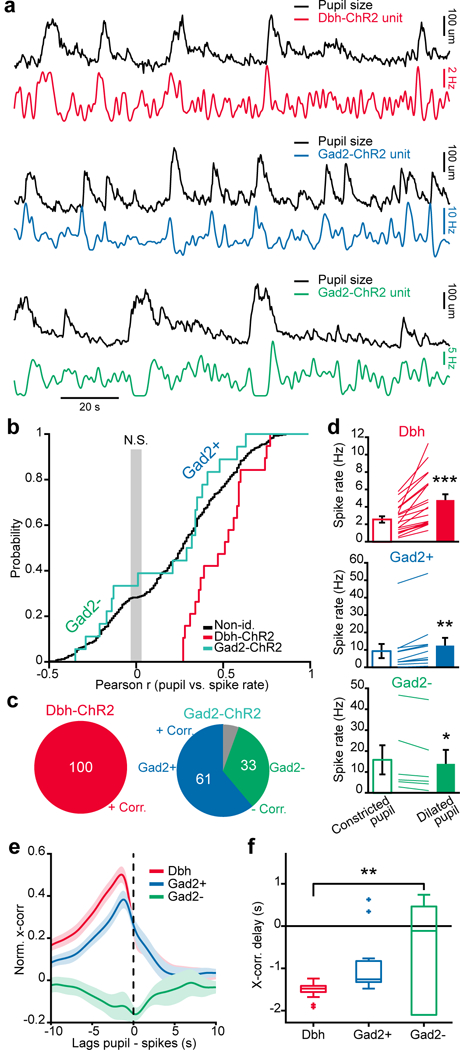
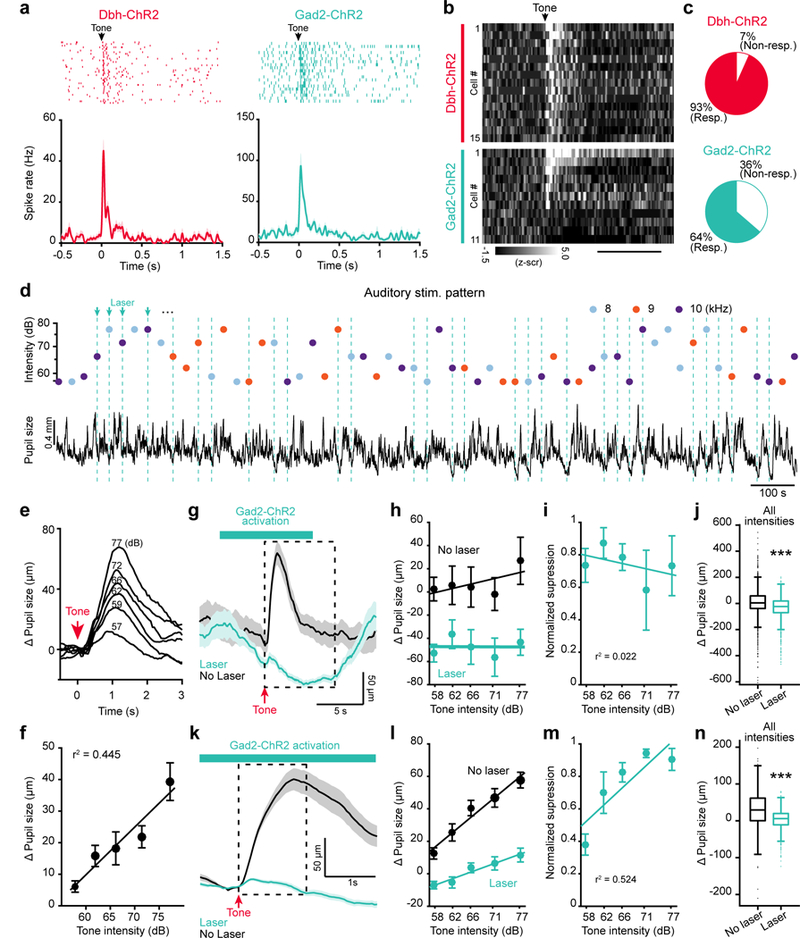
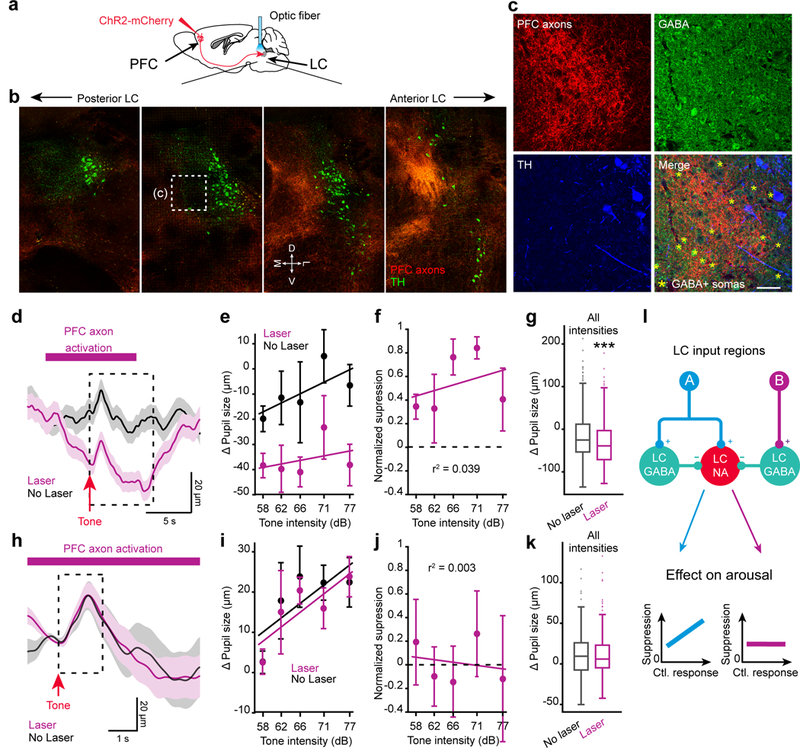
Arousal responses linked to locus coeruleus noradrenergic (LC-NA) activity affect cognition. However, the mechanisms that control modes of LC-NA activity remain unknown. Here, we reveal a local population of GABAergic neurons (LC-GABA) capable of modulating LC-NA activity and arousal. Retrograde tracing shows that inputs to LC-GABA and LC-NA neurons arise from similar regions, though a few regions provide differential inputs to one subtype over the other. Recordings in the locus coeruleus demonstrate two modes of LC-GABA responses whereby spiking is either correlated or broadly anticorrelated with LC-NA responses, reflecting anatomically similar and functionally coincident inputs, or differential and non-coincident inputs, to LC-NA and LC-GABA neurons. Coincident inputs control the gain of LC-NA-mediated arousal responses, whereas non-coincident inputs, such as from the prefrontal cortex to the locus coeruleus, alter global arousal levels. These findings demonstrate distinct modes by which an inhibitory locus coeruleus circuit regulates arousal in the brain.


Conflict of interest statement

Competing Interests Statement

The authors declare no competing financial interests.

Figures

Figure 1.
Figure 1.. GABAergic neurons surround and contact LC noradrenergic neurons.
a. Dbh-Cre mice were injected with AAV-Flex-tdTomato virus in the LC and coronal sections were collected. Boxed area (at +100 um location) is shown magnified in (b). M: medial, D: dorsal, L: lateral; V: ventral. b. Location of GABA expressing somata were revealed by immunohistochemistry. c. LC-NA and LC-GABA soma locations derived from (a) and (b). d. Map of LC-GABA and LC-NA neuronal density in a radius of 200 μm around the LC region. The map is projected onto an antero-posterior axis. Bar: Barrington’s nucleus; MVe: medial vestibular nucleus; CGPn: central gray of the pons. e. Distribution of LC-GABA and LC-NA neurons in the 3 axes. Vertical green lines represent the center of the distribution for the GABA+ population. Data are presented as mean ± s.e.m. N = 3 mice used for (a-e). f. Methods for infecting LC-GABA neurons with mCherry/ChR2. g. Example of a LC neuron filled with biocytin during whole cell recordings that expresses tyrosine hydroxylase (TH; arrow). Repeated for 8 LC neurons. h. Current-clamp recording of a Gad2-mCherry expressing neuron. Inset - overlay of multiple trials of the same cell following light activation. i. Distribution of spike delays from light onset of the cell shown in (h). j-k. Example traces from the LC-TH+ neurons displayed in (g). j. Cell-attached recordings during light activation of Gad2 neurons. k. Raster plot and post-stimulus time histogram aligned to light activation. l. Effect of light activation on spike rates for all TH+ neurons recorded (n = 8 neurons from 3 mice, ***: p = 0.00015, two-tailed paired t-test, t7 = −6.5869). m. Trial average (n = 60 trials) IPSCs recorded in voltage-clamp following light activation and the application of strychnine and bicuculline. n. Light-evoked IPSC amplitudes following application of strychnine and bicuculline (n = 10 neurons from 4 mice, one-way repeated measured ANOVA, F2,9 = 8.601, **: p = 0.0034, *: p = 0.0102 using Tukey post-hoc test). Blue bars in (h, j-l) indicate the timing of blue light activation. Scale bars: (a), (c), and (d): 200 μm; (b) and (g): 100 μm;
Figure 2:
Figure 2:. Activating LC-GABA neurons reduces LC-NA mediated pupil size.
a. Methods to measure pupil size in awake head-fixed mice using a CMOS camera and infrared illumination. Right: pupil diameter for an example 20-minute session. Boxed area is expanded in (b). b. Example images of pupil tracking for constricted (1) and dilated epochs (2). Scale bar: 1 mm. c. Methods for optogenetics manipulation of LC-NA and LC-GABA neurons using Cre-dependent viruses, Dbh- and Gad2-Cre mice and fiber optic implantation. d. Coronal section of the LC showing ChR2-mCherry expression and optic fiber tracks in a Dbh-Cre mice. Scale bar: 1 mm. e – g. Effect of activating (Dbh-ChR2) or silencing (Dbh-ArchT) LC-NA neurons as well as activating LC-GABA neurons (Gad2-ChR2) on pupil size in example mice. Top panels – Temporal raster plots of pupil size aligned to optical activation onset (vertical red line). Bottom panels – session averages for trials with and without laser. Data are presented as mean ± s.e.m. h - j – Effect of activating or silencing LC-NA neurons as well as activating LC-GABA neurons on pupil size. Gray lines represent animals where only tdTomato was expressed, but similar optical activation patterns and intensities were used. N = 6, 5, 4 and 5 mice for Dbh-ChR2, ArchT, Gad2-ChR2 and VGAT-ChR2 conditions respectively. N = 5 mice for tdTomato controls. Paired two-tailed t-test with p = 0.822 (t4 = 0.240) and ***p = 0.00001 (t5 =14.553) for tdTomato and ChR2 conditions in (h); p = 0.249 (t3 = 1.426) and **p = 0.0045 (t4 = −5.768) for tdTomato and ArchT conditions in (i); p = 0.4747 (t4 = 0.788), **p = 0.0054 (t4 = −5.494) and *p = 0.0153 (t3 = −5.010) for tdTomato, VGAT-ChR2 and Gad2-ChR2 conditions in (j).
Figure 3:
Figure 3:. LC-NA and LC-GABA neurons receive inputs from similar as well as different sources.
a. Schematic for targeting pseudo-rabies virus to LC-NA and LC-GABA subpopulation. b,c. Transynaptically labelled neurons in different brain regions following injection of targeted pseudo-rabies virus in LC of Dbh-Cre or Gad2-Cre mice. Repeated in N = 8 and 4 mice for LC-NA and GABA respectively. Scale bars: 200 μm. d,e. Map of brain regions providing the largest fraction of inputs to LC-NA and LC-GABA neurons. Regions providing less than 0.5% of total inputs are not displayed. N = 8 and 4 mice for LC-NA and LC-GABA respectively. f. Map of the difference in inputs to LC-NA and LC-GABA neurons. Only regions showing significant difference are displayed (p < 0.05 using paired t-test; see Supplementary Table 1). BNST: bed nucleus of the stria terminalis; Cb: cerebellum; CbN : cerebellar nuclei; CeA: central amygdala; CnF: cuneiform nucleus; DB: diagonal band; DpMe: deep mesencephalic nucleus; Gi: gigantocellular nucleus; IC: inferior colliculus; IPL: interpeduncular nucleus; LH: lateral hypothalamus; LHb: lateral habenular nucleus; MC: motor cortex; PAG: periaqueductal gray; PaV: paraventricular nucleus; PFC: prefrontal cortex; PH: posterior hypothalamus; PnO: pontine nucleus; PO: preoptic nucleus; Pr: prepositus nucleus; PSTh: parasubthalamic nucleus; Rt: reticular nucleus; SC: superior colliculus; SN: substantia nigra; Sp5: spinal trigeminal tract; SPF subparafascicular thalamic nucleus; SuM: supramammillary nucleus; ZI: zona incerta.
Figure 4:
Figure 4:. Extracellular spike recordings in LC of identified NA and GABA units.
a. Methods for photo-tagging Dbh- or Gad2-ChR2 units using a 16-channel silicone probe equipped with a 100 μm optic fiber. b. Probe track (DiI coating) verified with immunohistochemistry staining for TH to identify LC. Scale bar: 1 mm. c. Examples of isolated units and their respective probe location during two sessions (Top – Dbh-ChR2; Bottom – Gad2-ChR2). d, e. Top – Spike rasters from two units responding to 5 ms laser pulses recorded in Dbh-ChR2 (d) or Gad2-ChR2 (e) expressing mice. Bottom – Distribution of delay from laser onset. Inset – Comparison of spontaneous versus laser-evoked spike waveforms. f, g. Average spike delay and jitter following light activation of Dbh-ChR2 and Gad2-ChR2 neurons. p = 0.763 (t35 = −0.304) for (f), and p = 0.379 (t35 = −0.8909) for (g) using two-tailed unpaired t-test. h. Comparison of spontaneous spike rate for all three types of units (one-way ANOVA, F2,430= 15.88, p = 10−7 using Tukey post-hoc test). i. Scatter plot of spike duration and valley full width at half maximum values (see inset for definition) for non-identified, Dbh- and Gad2-ChR2 units. j. Comparison of spike duration for all three types of units (one-way ANOVA, F2,430= 19.57, p = 10−9 using Tukey post-hoc test). n = 19, 18 and 396 Dbh-ChR2, Gad2-ChR2 and non-identified units from 13 mice. Box plots indicate the median (center line), first quartiles (box edges), minimum/maximum values (whiskers) and outliers (+).
Figure 5:
Figure 5:. Identified LC-GABA units display two types of activity with respect to pupil size.
a. Examples of simultaneous recordings of pupil size and photo-tagged Dbh- (upper panel) or Gad2-ChR2 (middle and lower panels) LC units. Note the Gad2 unit in the middle panel is positively correlated (Gad2+) while that in the lower panel is negatively correlated with pupil size (Gad2-). b. Cumulative probability distribution of the Pearson correlation coefficient of LC unit spike rate with pupil size for all units. The gray area marks non-significant correlations, p < 0.05. n = 19, 18 and 396 Dbh-ChR2, Gad2-ChR2 and non-identified units from 13 mice. c. Percentage of Dbh- and Gad2-ChR2 units that are positively or negatively correlated with pupil size. Proportions were significantly different for the two groups (19/19 versus 11/18 in the Dbh and Gad2 groups; χ: 9.11; p = 0.0025). The gray portion indicates non-significant correlations, p < 0.05. d. Average spike rate for different type of units during periods of constricted versus dilated pupil. Each line represents a single unit. Two-tailed paired t-test: ***p = 0.0005 (t18 = 5.36) for Dbh; **p = 0.0014 (t10 = 4.38) for Gad2+; *p = 0.0208 (t5 = −3.33) for Gad2-. e, f. Normalized cross-correlation and delay of pupil size to LC firing activity for the classes of units sorted in (b, c). One-way ANOVA, F2,33 = 6.33, **p = 0.0088 using Tukey post-hoc test. Box plots indicate the median (center line), first quartiles (box edges), minimum/maximum values (whiskers) and outliers (+). Error bars in (d, e) indicates s.e.m. In (d-f) n = 19, 11, and 6 Dbh, Gad2+ and Gad2- units taken from 13 mice.
Figure 6:
Figure 6:. LC-GABA neurons control the gain of LC-NA mediated pupil responses.
a. Tone-pips presented during the recording of LC photo-tagged units in Dbh- (left) and Gad2-ChR2 (right) expressing units. Top panels – Spike raster plot aligned to tone onset. Bottom panels – Session spike rate average. b. Raster plots of average responses to tone pips sorted between Dbh and Gad2 units. n = 15 and 11 Dbh and Gad2 units respectively. Scale bar: 1 s. c. Percentage of responsive neurons for the two types of units. Proportions were not significantly different for the two groups (14/15 versus 7/11 in the Dbh and Gad2 groups; χ: 3.60; p = 0.058). d. Top – Example of an auditory stimulus pattern used to test the effect of LC-GABA activation on LC-NA responses. Bottom – Corresponding pupil size measurement. e. Average of pupil size response to tones of different intensities for an example mouse. Each trace is an average of 32 to 70 trials depending on intensities. f. Change in pupil response amplitude with tone intensity (data for N=8 mice recorded in the normal condition, without laser activation. p = 0.00008, one-way ANOVA: F4,35 = 8.27). g. Average traces for 77 dB tones with and without laser activation of LC-GABA neurons for one mouse. The dashed box delineates the averaging window use in (h-j). h. Pupil size at different tone intensities, with and without laser activation, for the example mouse in (g). i. Normalized suppression of tonic pupil response due to activation of LC-GABA neurons. (p = 0.763 using one-way ANOVA, F4,15 = 0.46). j. Comparison of laser to no laser trials for all trials regardless of tone intensity or frequency (***p = 10−29 using two-tailed unpaired t-test, t2973 = 11.37). k. Average traces for the same mouse and condition as in (g), showing the phasic post-tone-onset response. The dashed box delineates the averaging window used in (l-n). l. Pupil size at different tone intensities, with and without laser activation. m. Normalized suppression of phasic pupil response to tone intensity due to activation of LC-GABA neurons (p = 0.00075 using one-way ANOVA, F4,15 = 8.75). n. Comparison of laser to no laser trials for all trials regardless of tone intensity or frequency (***p = 10−89 using two-tailed unpaired t-test, t2973 = 20.7995). For panels (j) and (n) box plots indicate the median (center line), first quartiles (box edges), minimum/maximum values (whiskers) and outliers (+), n = 1494 and 1481 laser off and laser on trials respectively. For all other panels, data are displayed as mean ± s.e.m. N = 4 mice in (i), (j), (m), and (n).
Figure 7:
Figure 7:. Projections from PFC to LC-GABA neurons control LC-NA mediated pupil tone.
a. Methodology used to target PFC projections to LC. b. Coronal sections from posterior to anterior LC showing PFC axons in LC and TH staining. M: medial, D: dorsal, L: lateral, and V: ventral directions. Scale bar: 200 μm. c. Confocal images of the region highlighted in (b). Asterisks indicate GABA+ somata. Scale bar: 50 μm. Experiments in (b,c) were repeated in 3 mice with similar results. d. Pupil size in response to tone pips with or without PFC axon activation. Average of all trials for one mouse. The dashed box delineates the averaging window use in (e-g). e. Pupil size at different tone intensities, with and without laser activation, for the example mouse in (d). f. Normalized suppression of pupil response due to activation of PFC axons in LC (p = 0.3921 using one-way ANOVA, F4,10 = 1.14). g. Comparison of laser to no laser trials for all trials regardless of tone intensity or frequency (***p = 0.00004 using two-tailed unpaired t-test, t577 = 4.14). h. Average traces for the same mouse and condition as in (d), showing the phasic post-tone onset response. The dashed box delineates the averaging window used in (i-k). i. Pupil size at different tone intensities, with and without laser activation. j. Normalized suppression of phasic pupil response to tone intensity due to activation of LC-GABA neurons (p = 0.9493 using one-way ANOVA, F4,10 = 0.17). k. Comparison of laser to no laser trials for all trials regardless of tone intensity or frequency (p = 0.9315 using two-tailed unpaired t-test, t577 = 0.086). l – Proposed model of interaction between LC inputs and LC-GABA/LC-NA neurons. Excitatory coincident inputs from region A activate both LC-GABA and LC-NA neurons simultaneously. LC-GABA inhibition scales LC-NA activity divisively, thus controlling the gain of response. Non-coincident inputs from region B target LC-GABA neurons but not LC-NA neurons (as illustrated here), thus regulating overall NA tone without affecting the response gain. For panels (g) and (k) box plots indicate the median (center line), first quartiles (box edges), minimum/maximum values (whiskers) and outliers (+), n = 249 and 280 laser off and laser on trials respectively. For all other panels, data are displayed as mean ± s.e.m. N = 3 mice in (f), (g), (j) and (k).

References

    1. Aston-Jones G & Cohen JD An integrative theory of locus coeruleus-norepinephrine function: adaptive gain and optimal performance. Annual review of neuroscience 28, 403–450 (2005). - PubMed
    1. Sara SJ The locus coeruleus and noradrenergic modulation of cognition. Nature reviews. Neuroscience 10, 211–223 (2009). - PubMed
    1. Sara SJ & Bouret S Orienting and reorienting: the locus coeruleus mediates cognition through arousal. Neuron 76, 130–141 (2012). - PubMed
    1. Carter ME, et al. Tuning arousal with optogenetic modulation of locus coeruleus neurons. Nature neuroscience 13, 1526–1533 (2010). - PMC - PubMed
    1. Joshi S, Li Y, Kalwani RM & Gold JI Relationships between Pupil Diameter and Neuronal Activity in the Locus Coeruleus, Colliculi, and Cingulate Cortex. Neuron 89, 221–234 (2016). - PMC - PubMed

Methods-only References:

    1. Goard MJ, Pho GN, Woodson J & Sur M Distinct roles of visual, parietal, and frontal motor cortices in memory-guided sensorimotor decisions. eLife 5, e13764 (2016). - PMC - PubMed
    1. Chung JE, et al. A Fully Automated Approach to Spike Sorting. Neuron 95, 1381–1394.e1386 (2017). - PMC - PubMed
    1. Schneider CA, Rasband WS & Eliceiri KW NIH Image to ImageJ: 25 years of image analysis. Nature methods 9, 671–675 (2012). - PMC - PubMed
    1. Paxinos G & Franklin KB J. The Mouse Brain in Stereotaxic Coordinates (Academic Press, San Diego, California, 2001).
    1. Lein ES, et al. Genome-wide atlas of gene expression in the adult mouse brain. Nature 445, 168–176 (2007). - PubMed

Publication types

LinkOut - more resources