

Inequalities in sub-Saharan African women's and girls' health opportunities and outcomes: evidence from the Demographic and Health Surveys
- PMID: 30643635
- PMCID: PMC6326483
- DOI: 10.7189/jogh.09.010410
Inequalities in sub-Saharan African women's and girls' health opportunities and outcomes: evidence from the Demographic and Health Surveys
Abstract
Background: Maternal and reproductive health services are far from universalization and important gaps exist in their distribution across groups of women in sub-Saharan Africa (SSA). The aim of this study is to determine the magnitude of this unequal distribution of maternal and reproductive health-related opportunities and outcomes and to identify the major sources of inequality.
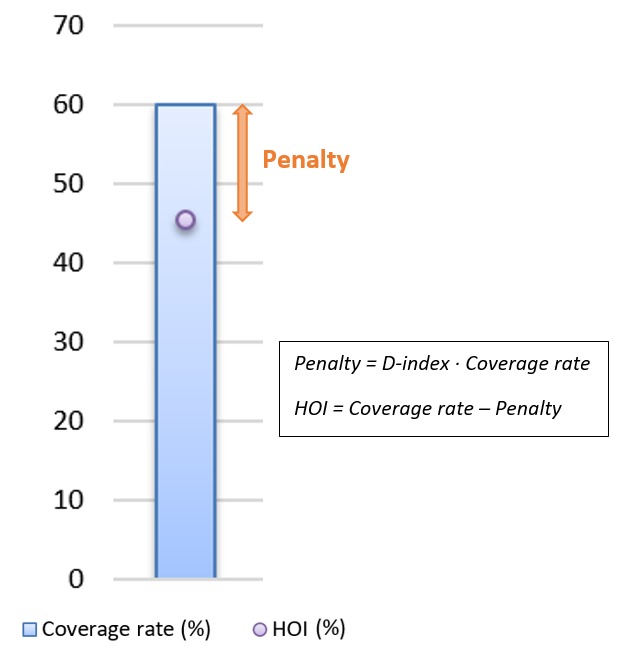
Methods: Demographic and Health Surveys data were used to analyse 15 opportunities for women of reproductive age (15-49), pregnant women and older adolescent girls (15-19), across 29 SSA countries. The tool employed is the Human Opportunity Index (HOI), a composite indicator that combines the availability of an opportunity (the coverage rate) with a measure of how equitably it is distributed among groups of women with different characteristics (or circumstances). Decompositions are used to assess the contribution of each individual circumstance to inequality.
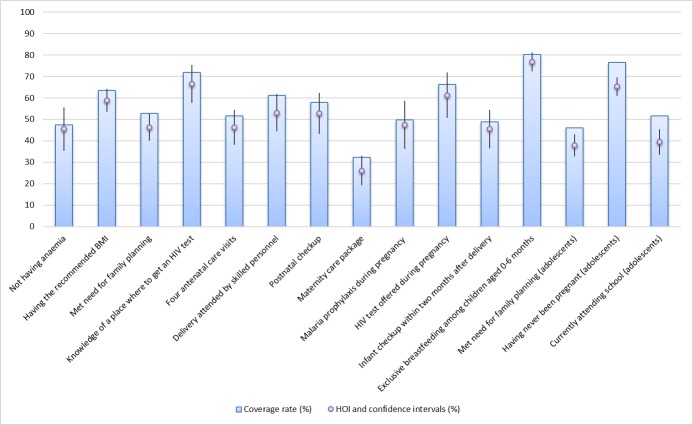
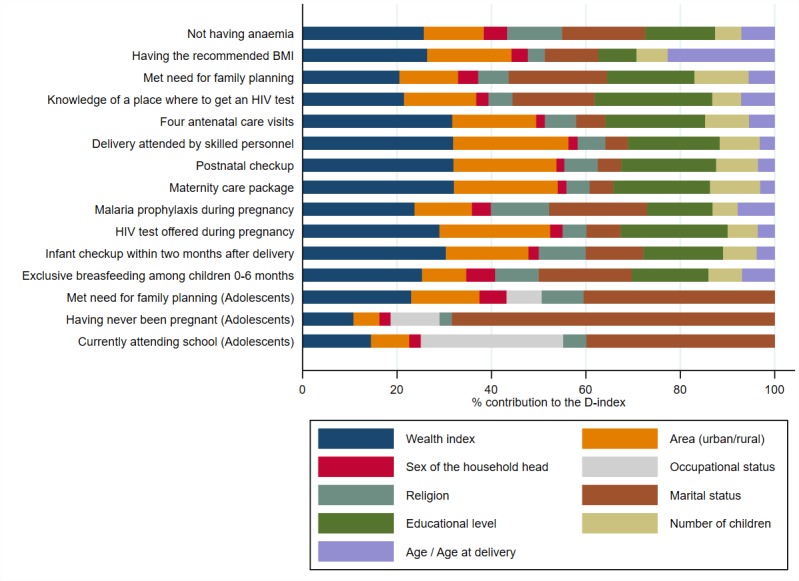
Results: The maternity care package of services is found to have lowest average HOI (26%), while exclusive breastfeeding among children aged 0-6 months has the highest HOI (77%). The other indicators show low HOIs, sometimes lower than 50%, indicating low coverage and/or high inequality. Wealth, education and area of residence are the main contributors to inequality for women of reproductive age. Among adolescent girls, marital status is the major contributor.
Conclusions: Reproductive and maternal health opportunities for women in SSA are scarce and far from reaching the global goals set by the post 2015 agenda. Further progress in improving women's and adolescents' health and well-being can only be achieved by a strong expansion of coverage to produce a more equitable and efficient distribution of health care. Failure to do so will compromise the likelihood of achieving the post-2015 Sustainable Development Goals (SDG). New metrics such as the HOI allows better understanding of the nature of challenges to achieving equity in perinatal and reproductive health, and offers a tool for monitoring progress in implementing a strong equity agenda as a part of the SDG initiative.
Conflict of interest statement
Competing interests: The authors completed the Unified Competing Interest form at www.icmje.org/coi_disclosure.pdf (available upon request from the corresponding author), and declare no conflicts of interest.
Figures
References
-
- The World Bank Group. World development indicators, 2015. Available: http://data.worldbank.org/data-catalog/world-development-indicators. Accessed: 21 October 2018.
-
- WHO. UNICEF, UNFPA, World Bank Group, UN Population Division. Trends in maternal mortality: 1990 to 2015. Geneva: WHO; 2015.
-
- United Nations. The Millenium Development Goals Report 2015. Available: http://www.un.org/millenniumgoals/2015_MDG_Report/pdf/MDG%202015%20rev%2.... Accessed: 21 October 2018.
