. 2018 Nov 8;6(1):1801260.
doi: 10.1002/advs.201801260. eCollection 2019 Jan 9.

Ion Therapy: A Novel Strategy for Acute Myocardial Infarction

Affiliations

Ion Therapy: A Novel Strategy for Acute Myocardial Infarction

Min Yi et al. Adv Sci (Weinh). .

Erratum in

Abstract

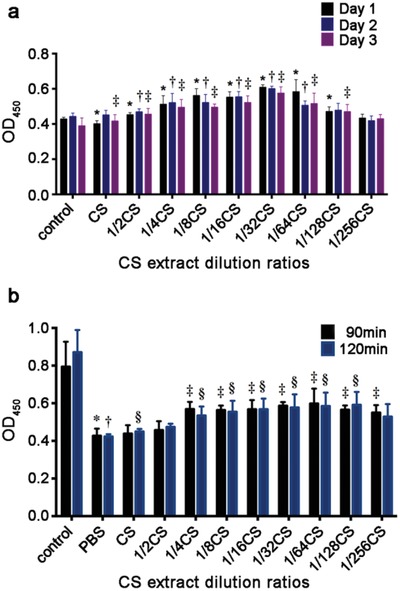
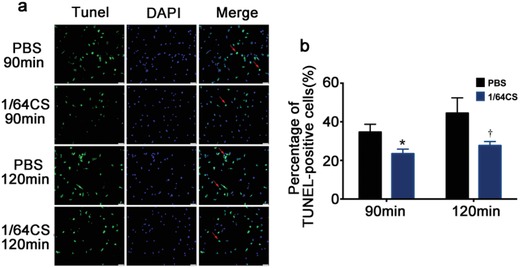
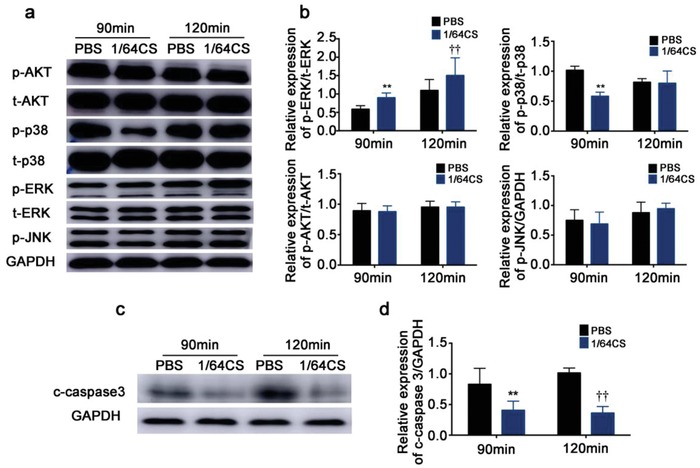
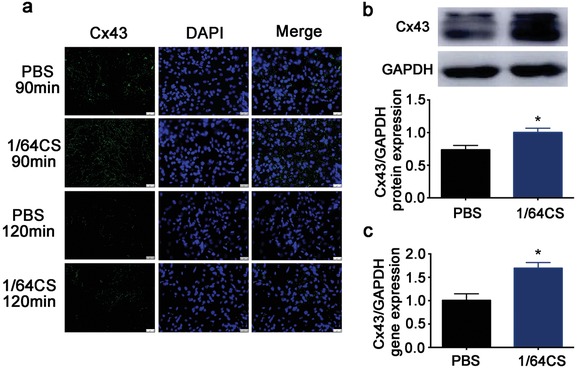
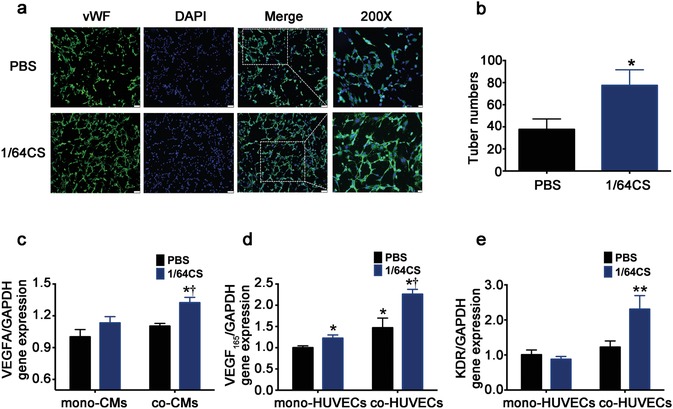
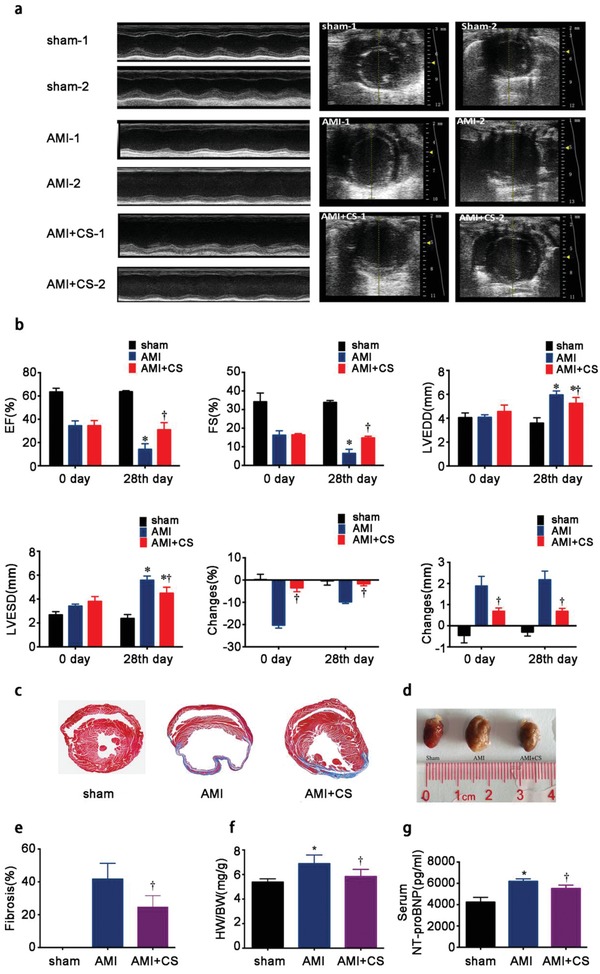
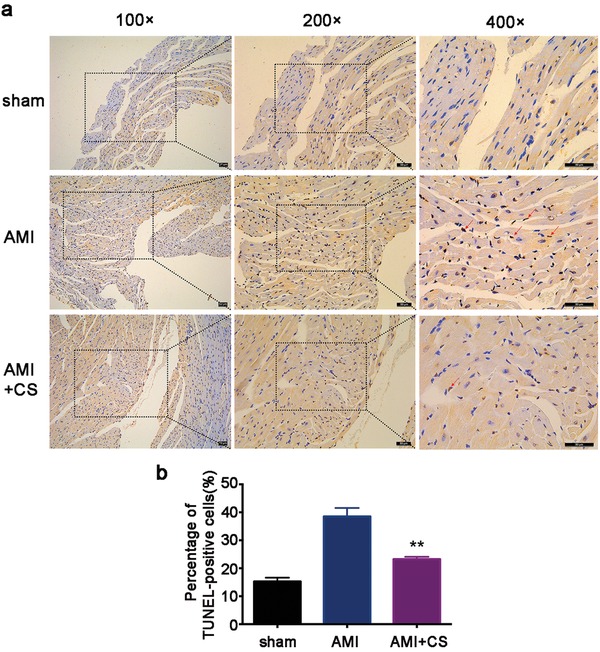
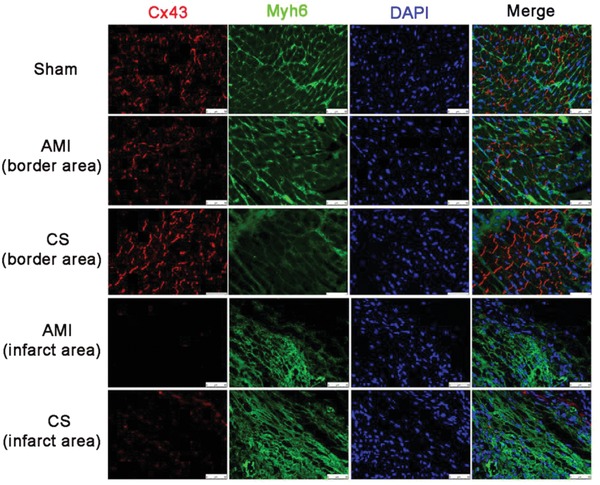
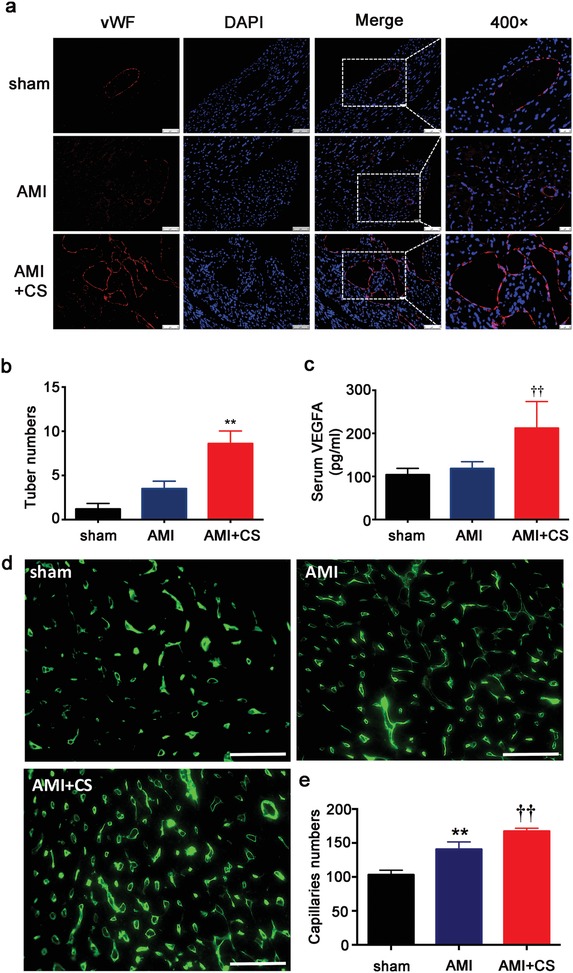
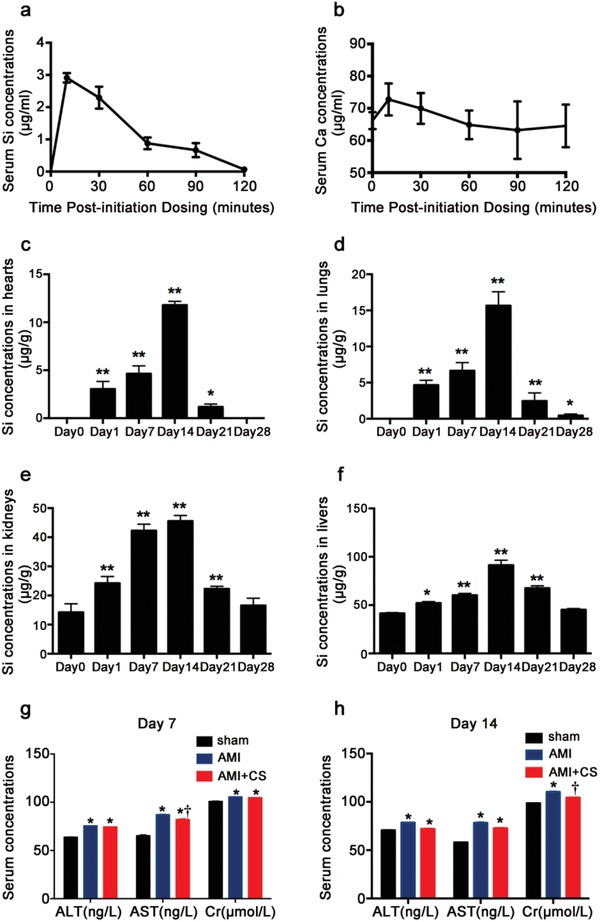
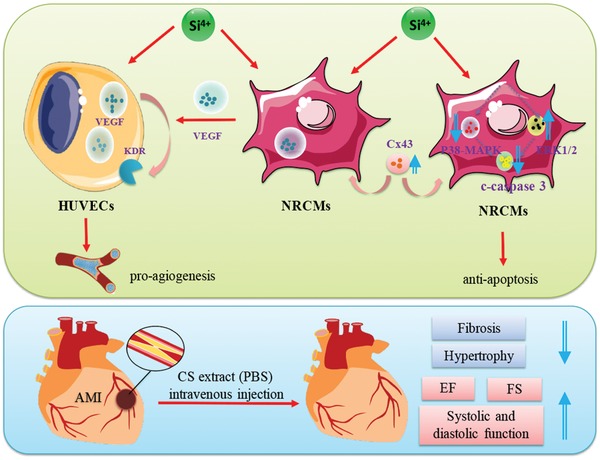
Although numerous therapies are widely applied clinically and stem cells and/or biomaterial based in situ implantations have achieved some effects, few of these have observed robust myocardial regeneration. The beneficial effects on cardiac function and structure are largely acting through paracrine signaling, which preserve the border-zone around the infarction, reduce apoptosis, blunt adverse remodeling, and promote angiogenesis. Ionic extracts from biomaterials have been proven to stimulate paracrine effects and promote cell-cell communications. Here, the paracrine stimulatory function of bioactive ions derived from biomaterials is integrated into the clinical concept of administration and proposed "ion therapy" as a novel strategy for myocardial infarction. In vitro, silicon- enriched ion extracts significantly increase cardiomyocyte viability and promote cell-cell communications, thus stimulating vascular formation via a paracrine effect under glucose/oxygen deprived conditions. In vivo, by intravenous injection, the bioactive silicon ions act as "diplomats" and promote crosstalk in myocardial cells, stimulate angiogenesis, and improve cardiac function post-myocardial infarction.

Keywords: acute myocardial infarction; bioactive ions; therapy.


Figures

Figure 1
Figure 1
Effects of silicon‐enriched ion extracts on NRCMs cell viability under normal and glucose/oxygen deprived conditions. a) NRCM cell viability cultured in different CS extracts diluted with DMEM for 1, 3, and 5 d under normoxia conditions (*p < 0.01 vs control group for Day 1; †p < 0.01 vs control group for Day 3; ‡ p < 0.01 vs control group for Day 5; n = 6 for each group). b) NRCMs cell viability cultured in different CS extracts diluted with PBS for 90 and 120 min under glucose/oxygen deprived conditions. Control group was cultured in normal condition for an equivalent time (*p < 0.01 versus control group for 90 min; †p < 0.01 vs control group for 120 min; ‡p < 0.01 vs PBS group for 90 min; §p < 0.01 vs PBS group for 120 min; n = 6 for each group). All data are obtained from three independent experiments; mean ± SD.
Figure 2
Figure 2
Effect of silicon‐enriched ion extract on apoptosis of NRCMs under glucose/oxygen deprived conditions in vitro. a) Representative pictures of NRCMs with TUNEL staining (green) and DAPI (blue) under glucose/oxygen deprived conditions in vitro. Red arrows show TUNEL‐positive NRCMs. Scale bar represents 50 µm and all data are obtained from three independent experiments. b) Quantitative analysis of TUNEL‐positive NRCMs (10 pictures for each group). *p < 0.05 versus PBS‐90 min, †p < 0.05 versus PBS‐120 min; mean ± SD.
Figure 3
Figure 3
Effect of silicon‐enriched ion extract on the expression of apoptotic‐associated MAPK family proteins and cleaved‐caspase 3 in NRCMs under glucose/oxygen deprived conditions in vitro. a) MAPK family protein expression measured by western blot and GAPDH was served as the loading control. b) Quantification of bands by densitometry. c) Cleaved‐caspase 3 protein expression measured by western blot and GAPDH was served as the loading control. d) Quantification of bands by densitometry. Data are obtained from three independent experiments. **p < 0.01 versus PBS‐90 min, ††p < 0.01 versus PBS‐120 min; mean ± SD.
Figure 4
Figure 4
Effect of silicon‐enriched ion extract on the expression of gap junction associated Cx43 in NRCMs under glucose/oxygen deprived conditions in vitro. a) Representative images of Cx43 immunofluorescence staining of NRCMs cultured in silicon‐enriched ion extracts under glucose/oxygen deprived conditions for 90 and 120 min, respectively. Scale bars represent 25 µm. b) Protein expression of Cx43 measured by western blot and GAPDH was served as the loading control. c) Gene expression of Cx43 in NRCMs under glucose/oxygen deprived conditions measured by RT‐qPCR. All data are obtained from three independent experiments. *p < 0.01 versus PBS‐90 min; mean ± SD.
Figure 5
Figure 5
Effect of silicon‐enriched ion extract on VEGF‐mediated angiogenesis of NRCMs and HUVECs co‐cultures under glucose/oxygen deprived conditions in vitro. a) Representative fluorescence images of vWF‐stained tube formation of co‐HUVECs under glucose/oxygen deprived conditions in vitro. Scale bars represent 75 µm. b) Quantification of tune numbers in coculture systems (10 pictures for each group). *p < 0.01 versus PBS group; mean ± SD. c) Gene expression of VEGFA in mono and co‐NRCMs under glucose/oxygen deprived conditions. d) Gene expression of VEGF165 in mono and co‐HUVECs under glucose/oxygen deprived conditions. e) Gene expression of KDR in mono‐ and co‐HUVECs under glucose/oxygen deprived conditions for 120 min; *p < 0.05 versus PBS group. **p < 0.01 versus mono‐cultured PBS group; †p < 0.05 versus cocultured PBS. Data are obtained from three independent experiments; mean ± SD.
Figure 6
Figure 6
Effect of “ion therapy” on cardiac function and heart remodeling as well as hypertrophy post‐MI in vivo. a) Representative echocardiograms (left) and measurements of different groups obtained from the mid‐papillary muscle region of the left ventricle (right) of each groups before “ion therapy”(right after LAD ligation) and post “ion therapy” (4 weeks after LAD ligation); sham‐1,AMI‐1 and AMI+CS‐1: right after LAD ligation; sham‐2,AMI‐2 and AMI+CS‐2: 4 weeks after LAD ligation. b) Cardiac function measured by left ventricular end‐diastolic diameter (LVEDD), LV end‐systolic diameter (LVESD), the percentage of LV ejection fraction (EF) and fractional shortening (FS) values and changes before and post “ion therapy”. *p < 0.05 versus AMI group, †p < 0.01 versus AMI group. c) Representative Masson's trichrome staining of heart sections evaluating collagen deposition 4 weeks after surgery. d) Representative pictures of heart samples indicating hypertrophy degrees. e) Quantitative analysis of the area of fibrosis. Sham group was set as 0% and †p < 0.001 versus AMI group (10 pictures for each group). f) Heart weight/body weight (HW/BW) ratio in each groups. g) Serum expression of NT‐proBNP level in in each groups. Sham group n = 4; AMI group n = 7 and AMI+CS group n = 13. *p < 0.05 versus sham group, †p < 0.05 versus AMI group; mean ± SD.
Figure 7
Figure 7
Effect of “ion therapy” on cardiac apoptosis in vivo post‐AMI. a) Representative immunohistochemical pictures of TUNEL staining in border‐zone of infarction. Total nuclei (DAPI staining, blue) and TUNEL positive nuclei (brown‐yellow). Red arrows show TUNEL‐positive cardiomyocytes. Scale bar represents 50 µm. b) Quantitative analysis of TUNEL‐positive cardiomyocytes (10 pictures for each group). Sham group n = 4; AMI group n = 7 and AMI+CS group n = 13. **p < 0.01 versus AMI group; mean ± SD.
Figure 8
Figure 8
Effect of “ion therapy” on the expression of gap junction associated Cx43 in cardiomyocytes in vivo post‐AMI. Representative immunofluorescence images of Myh6 (green) and gap junction associated Cx43 (red) staining in the infarcted myocardium 4 weeks after surgery. Scale bars represent 50 µm.
Figure 9
Figure 9
Effect of “ion therapy” on VEGF‐mediated angiogenesis in border area of ischemic in vivo post‐ AMI. a) Representative immunofluorescence images of vWF‐stained blood vessels in the border area of infarcted myocardium 4 weeks after surgery. Scale bars represent 75 or 50 µm, respectively. b) Quantification of tube number/HPF in the border regions of infarctions (10 pictures for each group). **p < 0.01 versus AMI group; mean ± SD. c) Serum VEGFA expression post‐AMI. d) Representative immunofluorescence images of isolectin IB4‐stained capillaries in the border area of infarcted myocardium 4 weeks after surgery. Scale bars represent 50 µm. e) Quantification of capillaries numbers/HPF in the border regions of infarctions (five pictures for each group). **p < 0.01 versus sham group, ††p < 0.01 versus AMI group. Sham group n = 4; AMI group n = 7 and AMI+CS group n = 13; mean ± SD.
Figure 10
Figure 10
Bio‐distribution and metabolism of Si and acute toxicity of “ion therapy.” a) Serum Si concentrations after initiation injection in AMI mouse (n = 4). b) Serum Ca ion concentrations after initiation injection in AMI mouse (n = 4). c) Si concentrations in hearts before and after “ion therapy” for 1, 7, 14, 21, and 28 d (n = 3 for each group). d) Si concentrations in lungs before and after “ion therapy” for 1, 7, 14, 21, and 28 d (n = 3 for each group). e) Si concentrations in kidneys before and after “ion therapy” for 1, 7, 14, 21, and 28 d (n = 3 for each group). f) Si concentrations in liver before and after “ion therapy” for 1, 7, 14, 21, and 28 d (n = 3 for each group). g) Serum expression of ALT, AST, and Cr level in each groups after injection for 7 d. h) Serum expression of ALT, AST, and Cr level in each groups after injection for 14 d. Sham group n = 4; AMI group n = 7 and AMI+CS group n = 13. *p < 0.05 versus sham group or day 0, **p < 0.01 versus Day 0, †p < 0.05 versus AMI group; mean ± SD.
Figure 11
Figure 11
Overall effects and mechanism of “ion therapy” on AMI treatment. “Ion therapy” can significantly improve cardiac function in mice post‐AMI by stimulating Cx43 mediated gap junction thus promoting VEGF‐mediated angiogenesis and by inhibiting caspase 3‐associated apoptosis.

Similar articles

Cited by

References

    1. Roger V. L., Go A. S., Lloyd‐Jones D. M., Adams R. J., Berry J. D., Brown T. M., Carnethon M. R., Dai S., De Simone G., Ford E. S., Fox C. S., Fullerton H. J., Gillespie C., Greenlund K. J., Hailpern S. M., Heit J. A., Ho P. M., Howard V. J., Kissela B. M., Kittner S. J., Lackland D. T., Lichtman J. H., Lisabeth L. D., Makuc D. M., Marcus G. M., Marelli A., Matchar D. B., Mcdermott M. M., Meigs J. B., Moy C. S., Mozaffarian D., Mussolino M. E., Nichol G., Paynter N. P., Rosamond W. D., Sorlie P. D., Stafford R. S., Turan T. N., Turner M. B., Wong N. D., Wylie‐Rosett J., American Heart Association Statistics Committee and Stroke Statistics Subcommittee , Circulation 2011, 123, e18. - PubMed
    1. Benjamin E. J., Virani S. S., Callaway C. W., Chamberlain A. M., Chang A. R., Cheng S., Chiuve S. E., Cushman M., Delling F. N., Deo R., De Ferranti S. D., Ferguson J. F., Fornage M., Gillespie C., Isasi C. R., Jimenez M. C., Jordan L. C., Judd S. E., Lackland D., Lichtman J. H., Lisabeth L., Liu S., Longenecker C. T., Lutsey P. L., Mackey J. S., Matchar D. B., Matsushita K., Mussolino M. E., Nasir K., O'flaherty M., Palaniappan L. P., Pandey A., Pandey D. K., Reeves M. J., Ritchey M. D., Rodriguez C. J., Roth G. A., Rosamond W. D., Sampson U. K. A., Satou G. M., Shah S. H., Spartano N. L., Tirschwell D. L., Tsao C. W., Voeks J. H., Willey J. Z., Wilkins J. T., Wu J. H., Alger H. M., Wong S. S., Muntner P., American Heart Association Council on Epidemiology and Prevention Statistics Committee and Stroke Statistics Subcommittee , Circulation 2018, 137, e67. - PubMed
    1. Heldman A. W., Difede D. L., Fishman J. E., Zambrano J. P., Trachtenberg B. H., Karantalis V., Mushtaq M., Williams A. R., Suncion V. Y., Mcniece I. K., Ghersin E., Soto V., Lopera G., Miki R., Willens H., Hendel R., Mitrani R., Pattany P., Feigenbaum G., Oskouei B., Byrnes J., Lowery M. H., Sierra J., Pujol M. V., Delgado C., Gonzalez P. J., Rodriguez J. E., Bagno L. L., Rouy D., Altman P., Foo C. W., Da Silva J., Anderson E., Schwarz R., Mendizabal A., Hare J. M., JAMA 2014, 311, 62. - PMC - PubMed
    1. Segers V. F., Lee R. T., Circ. Res. 2011, 109, 910. - PubMed
    1. Terrovitis J., Lautamaki R., Bonios M., Fox J., Engles J. M., Yu J., Leppo M. K., Pomper M. G., Wahl R. L., Seidel J., Tsui B. M., Bengel F. M., Abraham M. R., Marban E., J. Am. Coll. Cardiol. 2009, 54, 1619. - PMC - PubMed

LinkOut - more resources