. 2019 Apr;176(7):864-878.
doi: 10.1111/bph.14575. Epub 2019 Mar 6.

Probe dependence of allosteric enhancers on the binding affinity of adenosine A1 -receptor agonists at rat and human A1 -receptors measured using NanoBRET

Affiliations

Probe dependence of allosteric enhancers on the binding affinity of adenosine A1 -receptor agonists at rat and human A1 -receptors measured using NanoBRET

Samantha L Cooper et al. Br J Pharmacol. 2019 Apr.

Abstract

Background and purpose: Adenosine is a local mediator that regulates a number of physiological and pathological processes via activation of adenosine A1 -receptors. The activity of adenosine can be regulated at the level of its target receptor via drugs that bind to an allosteric site on the A1 -receptor. Here, we have investigated the species and probe dependence of two allosteric modulators on the binding characteristics of fluorescent and nonfluorescent A1 -receptor agonists.

Experimental approach: A Nano-luciferase (Nluc) BRET (NanoBRET) methodology was used. This used N-terminal Nluc-tagged A1 -receptors expressed in HEK293T cells in conjunction with both fluorescent A1 -receptor agonists (adenosine and NECA analogues) and a fluorescent antagonist CA200645.

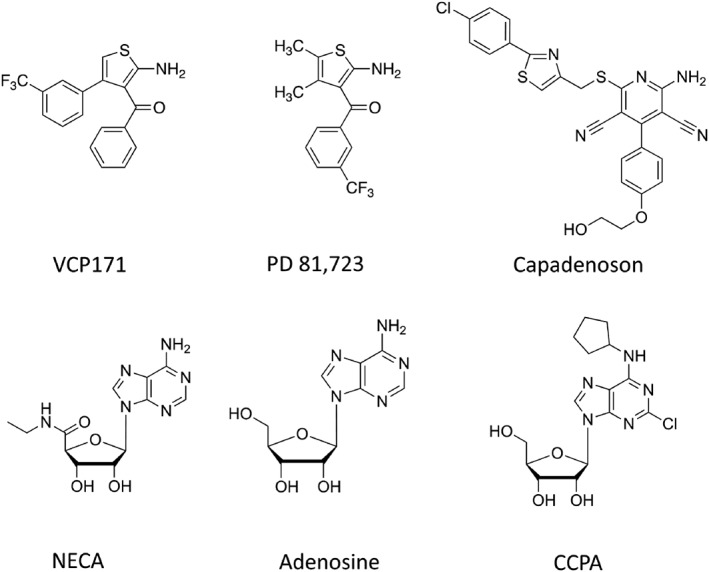
Key results: PD 81,723 and VCP171 elicited positive allosteric effects on the binding affinity of orthosteric agonists at both the rat and human A1 -receptors that showed clear probe dependence. Thus, the allosteric effect on the highly selective partial agonist capadenoson was much less marked than for the full agonists NECA, adenosine, and CCPA in both species. VCP171 and, to a lesser extent, PD 81,723, also increased the specific binding of three fluorescent A1 -receptor agonists in a species-dependent manner that involved increases in Bmax and pKD .

Conclusions and implications: These results demonstrate the power of the NanoBRET ligand-binding approach to study the effect of allosteric ligands on the binding of fluorescent agonists to the adenosine A1 -receptor in intact living cells. Furthermore, our studies suggest that VCP171 and PD 81,723 may switch a proportion of A1 -receptors to an active agonist conformation (R*).


Conflict of interest statement

The authors declare no conflicts of interest.

Figures

Figure 1
Figure 1
Chemical structures of VCP171, PD 81,723, and A1‐receptor agonists
Figure 2
Figure 2
Effect of PD 81,723 and VCP171 on agonist binding to the human Nluc‐A1R. The effect of the allosteric modulators PD 81,723 and VCP171 on the ability of adenosine A1‐receptor agonists (adenosine, capadenoson, CCPA, and NECA) to inhibit CA200645 (25 nM) binding was monitored using BRET. (a) Adenosine and PD 81,723; (b) capadenoson and PD 81,723; (c) NECA and PD 81,723; (d) CCPA and PD 81,723; (e) adenosine and VCP171; (f) capadenoson and VCP171; (g) NECA and VCP171; and (h) CCPA and VCP171. Figures shown are single representative experiments from five (a, c, g) or six (b, d–f, h) separate experiments that were each performed in triplicate. Data are expressed as mean ± SEM of the triplicate data
Figure 3
Figure 3
Effect of PD 81,723 and VCP171 on agonist binding to the rat Nluc‐A1R. The effect of the allosteric modulators PD 81,723 and VCP171 on the ability of adenosine A1‐receptor agonists (adenosine, capadenoson, CCPA, and NECA) to inhibit CA200645 (25 nM) binding was monitored using BRET. (a) Adenosine and PD 81,723; (b) capadenoson and PD 81,723; (c) NECA and PD 81,723; (d) CCPA and PD81,723; (e) adenosine and VCP171; (f) capadenoson and VCP171; (g) NECA and VCP171; and (h) CCPA and VCP171. Figures shown are single representative experiments from five (a–f, h) or six (g) separate experiments that were each performed in triplicate. Data are expressed as mean ± SEM of the triplicate data
Figure 4
Figure 4
Chemical structure of three fluorescent agonists (BY630‐X‐ABA, BY630‐X‐ABEA, and BY630‐Ala‐Ala‐Gly‐ABEA) and the fluorescent antagonist CA200645
Figure 5
Figure 5
Effect of VCP171 and PD 81,723 on the binding of ABA‐X‐BY630 (ABA) to the human and rat adenosine A1‐receptors. Effect of VCP171 (a, c) or PD 81,723 (b, d) on the binding of ABA‐X‐BY630 to the human (a, b) or rat (c, d) A1‐receptors. Figures show combined data from five separate experiments (each performed in triplicate). Data are expressed as mean ± SEM. *P < 0.05 fitted parameters (both K D and B max) curves significantly different from control (without allosteric modulator; partial F test). # P < 0.05 fitted parameter for B max significantly different from control (partial F test)
Figure 6
Figure 6
Effect of VCP171 and PD 81,723 on the binding of ABEA‐X‐BY630 (ABEA) to the human and rat adenosine A1‐receptors. Effect of VCP171 (a, c) or PD 81,723 (b, d) on the binding of ABEA‐X‐BY630 to the human (a, b) or rat (c, d) A1‐receptors. Figures show combined data from six (a, d) or five (b, c) separate experiments (each performed in triplicate). Data are expressed as mean ± SEM. *P < 0.05 fitted parameters (both K D and B max) curves significantly different from control (without allosteric modulator; partial F test)
Figure 7
Figure 7
Effect of VCP171 and PD 81,723 on the binding of BY630‐X‐(D)‐A‐(D)‐A‐G‐ABEA (AAG‐ABEA) to the human and rat adenosine A1‐receptors. Effect of VCP171 (a, c) or PD 81,723 (b, d) on the binding of BY630‐X‐(D)‐A‐(D)‐A‐G‐ABEA to the human (a, b) or rat (b, d) A1‐receptors. Figures show combined data from six (a) or five (b, c, d) separate experiments (each performed in triplicate). Data are expressed as mean ± SEM. *P < 0.05 fitted parameters (both K D and B max) curves significantly different from control (without allosteric modulator; partial F test). # P < 0.05 fitted parameter for K D significantly different from control (partial F test)
Figure 8
Figure 8
Crystal structures of the human A1‐receptor bound to (a, c) the orthosteric antagonist DU172 (PDB: 5UEN; Glukhova et al., 2017) or (b, d) bound to the endogenous agonist adenosine in the presence of a Gi‐α subunit (PDB: 6D9H; Draper‐Joyce et al., 2018). Structures show the ligand binding pocket from a top‐down view. (c, d) Surface projection of the transmembrane helices, ECL1, ECL2, and ECL3 to demonstrate the closing of the binding pocket in the agonist‐bound active structure (d) compared to the antagonist‐bound inactive structure (c). The orthosteric (dashed red circle) and the position of the potential secondary allosteric binding site (dashed yellow circle) identified by Glukhova et al. (2017) in the antagonist‐bound structure are also shown (c). These positions have also been extrapolated to the agonist‐bound structure (d). 3D structures were produced using the programme PyMol (Schrodinger, Cambridge, MA, USA)
Figure 9
Figure 9
(a) Amino acid sequence of extracellular loop 2 (ECL2) of the human (Hu) A1‐receptor showing those residues suggested by mutagenesis studies (Nguyen, Vecchio, et al., 2016) to be involved in the allosteric effects on the binding of NECA of PD 81,723 (red circles) and VCP171 (blue circles). The helical region is highlighted in grey. E172 (green circle) is also indicated. The amino acids that differ between the human and rat ECL2 sequences are also highlighted (blue letters). (b) Crystal structure of the human A1‐receptor bound to the orthosteric antagonist DU172 (PDB: 5UEN; Glukhova et al., 2017) with both orthosteric and putative allosteric binding sites shown. (c) Crystal structure of the human A1‐receptor bound to the endogenous agonist adenosine (PDB: 6D9H; Draper‐Joyce et al., 2018) with orthosteric and allosteric binding sites shown. Note the allosteric binding site in (c) and does not overlap with the orthosteric binding site. 3D structures were produced using the program PyMol (Schrodinger, Cambridge, MA, USA)

References

    1. Albrecht‐Kupper, B. E. , Leineweber, K. , & Nell, P. G. (2012). Partial adenosine A1‐receptor agonists for cardiovascular therapies. Purinergic Signalling, 8, S91–S99. - PMC - PubMed
    1. Alexander, S. P. H. , Christopoulos, A. , Davenport, A. P. , Kelly, E. , Marrion, N. V. , Peters, J. A. , … CGTP Collaborators (2017). The concise guide to pharmacology 2017/18: G protein‐coupled receptors. British Journal of Pharmacology, 174(Suppl 1), S17–S129. 10.1111/bph.13878 - DOI - PMC - PubMed
    1. Aurelio, L. , Valant, C. , Flynn, B. L. , Sexton, P. M. , Christopoulos, A. , & Scammells, P. J. (2009). Allosteric modulators of the adenosine A1 receptor: Synthesis and pharmacological evaluation of 4‐substituted 2‐amino‐3‐benzoylthiophenes. Journal of Medicinal Chemistry, 52, 4543–4547. 10.1021/jm9002582 - DOI - PubMed
    1. Aurelio, L. , Valant, C. , Flynn, B. L. , Sexton, P. M. , White, J. M. , Christopoulos, A. , & Scammells, P. J. (2010). Effects of conformational restriction of 2‐amino‐3‐benzoylthiophenes on A1 adenosine receptor modulation. Journal of Medicinal Chemistry, 53, 6550–6559. 10.1021/jm1008538 - DOI - PubMed
    1. Briddon, S. J. , Middleton, R. J. , Yates, A. S. , George, M. W. , Kellam, B. , & Hill, S. J. (2004). Application of fluorescence correlation spectroscopy to the measurement of agonist binding to a G‐protein coupled receptor at the single cell level. Faraday Discussions, 26, 197–207. - PubMed

Publication types