. 2019 Apr 5;18(4):1513-1531.
doi: 10.1021/acs.jproteome.8b00800. Epub 2019 Jan 31.

Quantifying Competition among Mitochondrial Protein Acylation Events Induced by Ethanol Metabolism

Affiliations

Quantifying Competition among Mitochondrial Protein Acylation Events Induced by Ethanol Metabolism

Hadi R Ali et al. J Proteome Res. .

Abstract

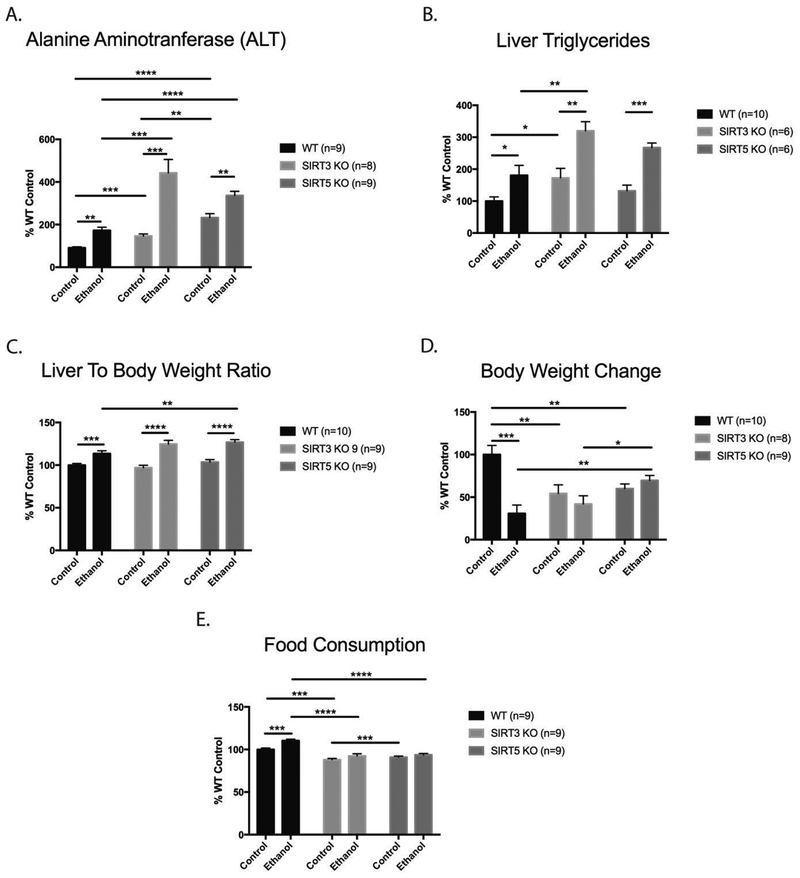
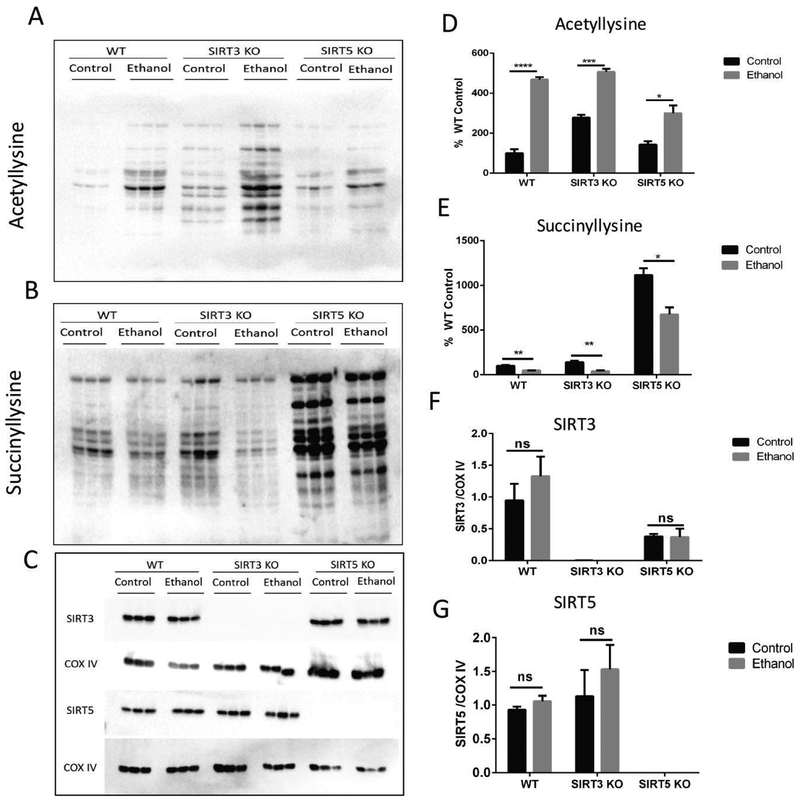
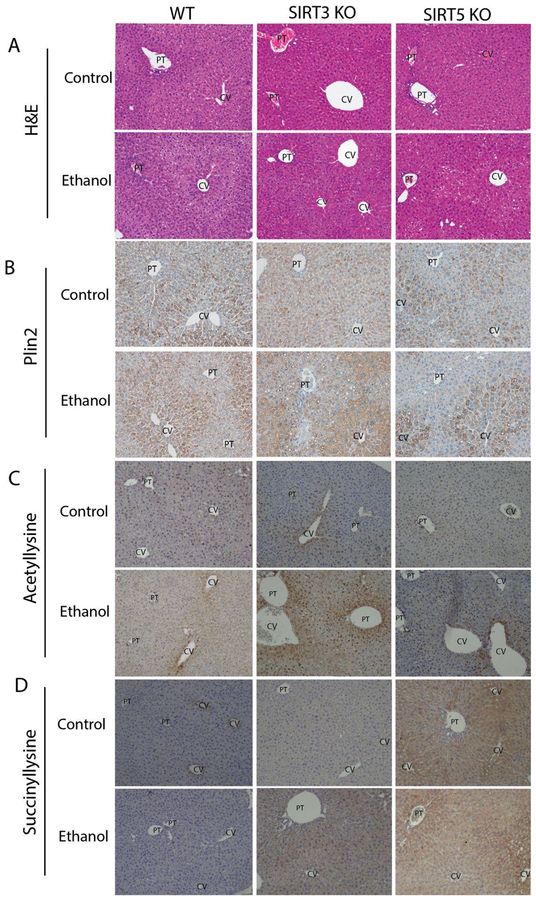
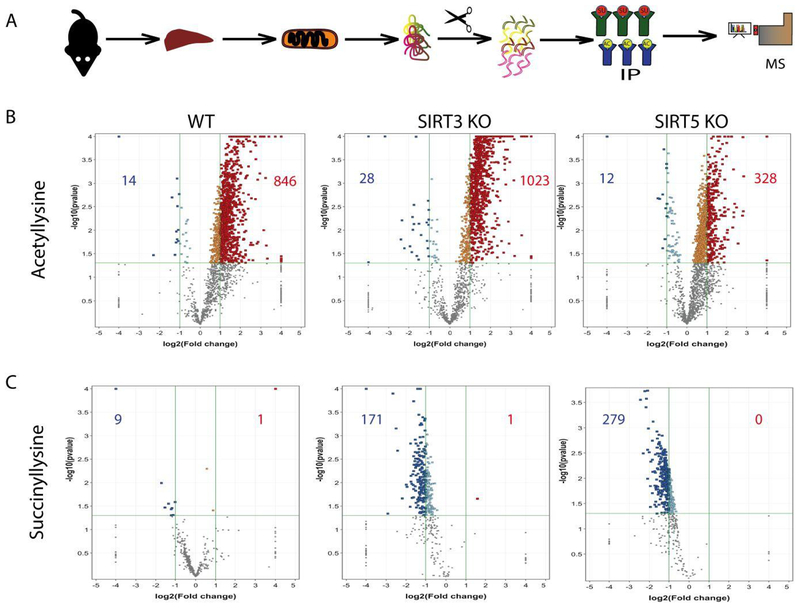
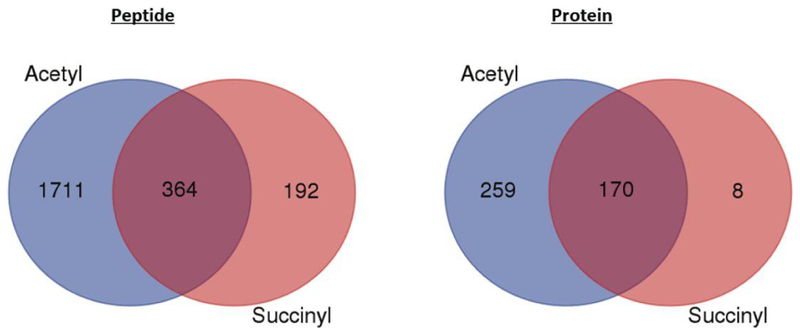
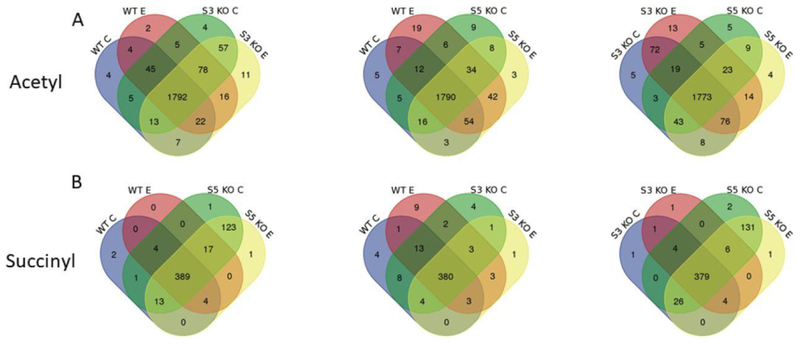
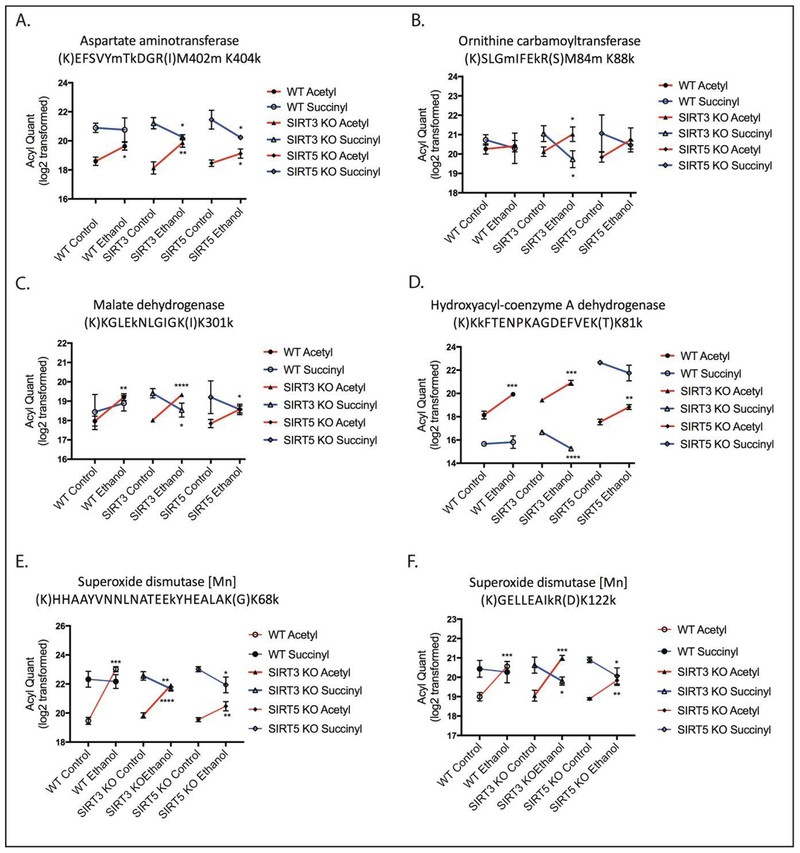
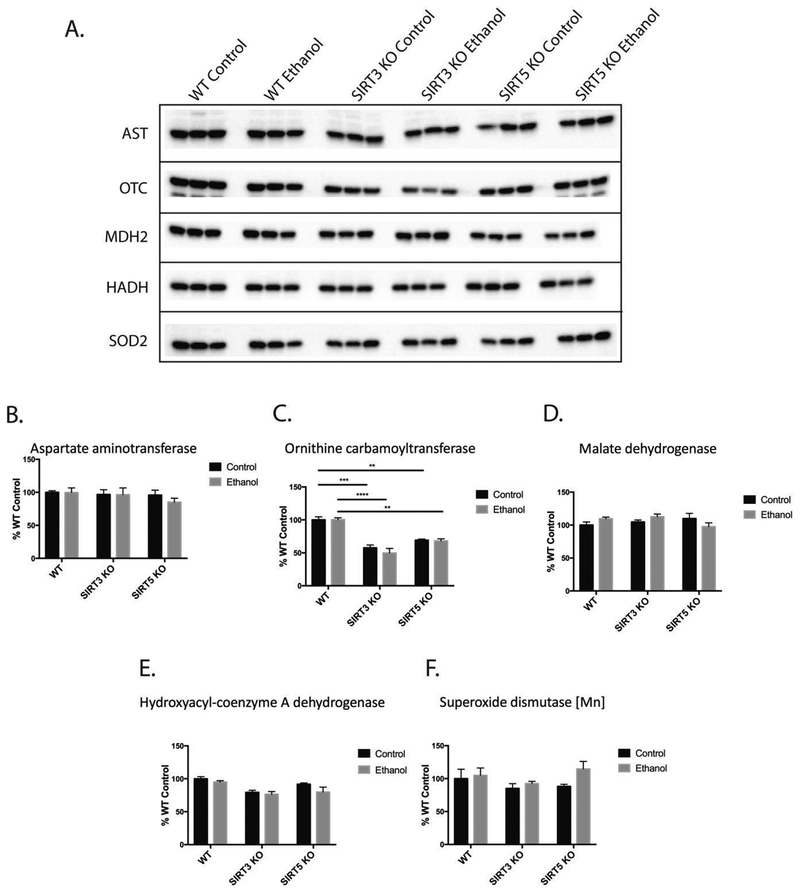
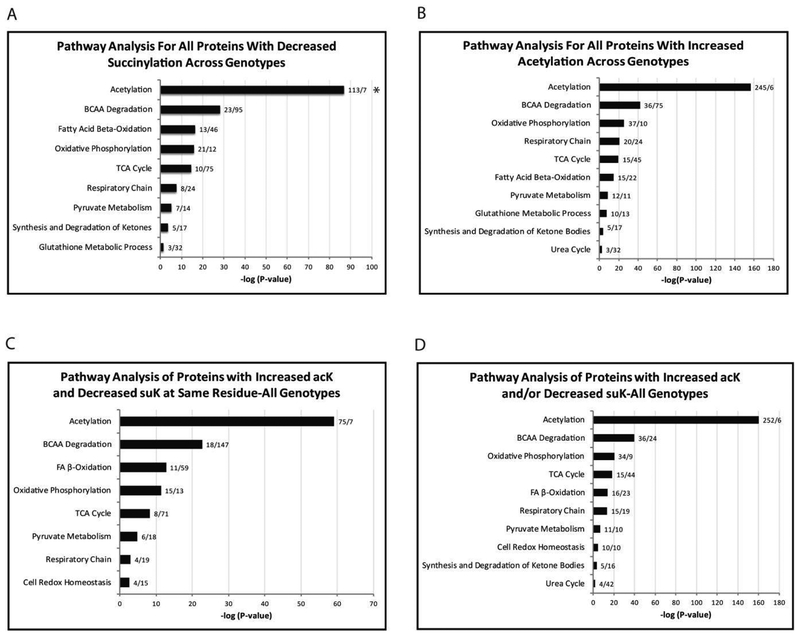
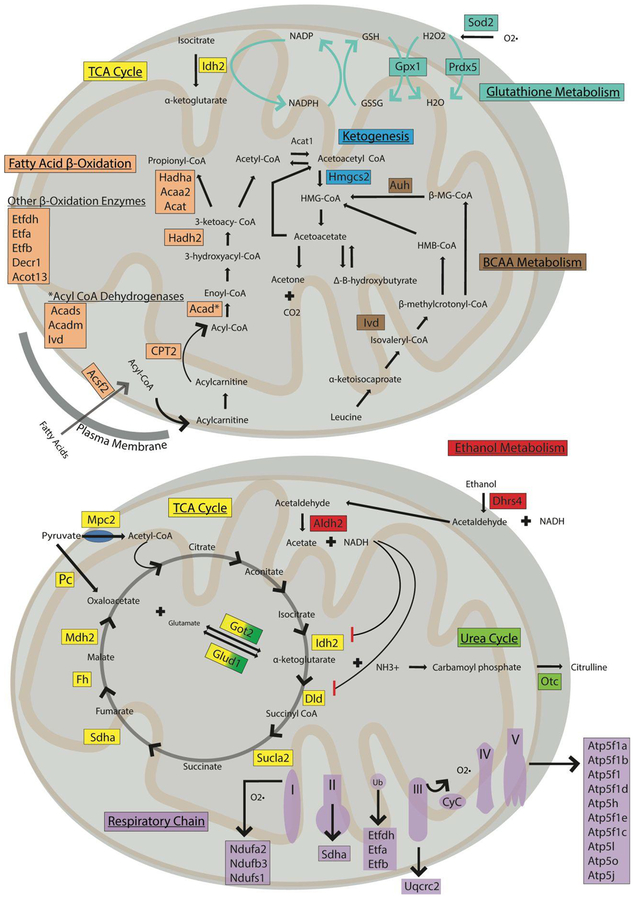
Mitochondrial dysfunction is one of many key factors in the etiology of alcoholic liver disease (ALD). Lysine acetylation is known to regulate numerous mitochondrial metabolic pathways, and recent reports demonstrate that alcohol-induced protein acylation negatively impacts these processes. To identify regulatory mechanisms attributed to alcohol-induced protein post-translational modifications, we employed a model of alcohol consumption within the context of wild type (WT), sirtuin 3 knockout (SIRT3 KO), and sirtuin 5 knockout (SIRT5 KO) mice to manipulate hepatic mitochondrial protein acylation. Mitochondrial fractions were examined by label-free quantitative HPLC-MS/MS to reveal competition between lysine acetylation and succinylation. A class of proteins defined as "differential acyl switching proteins" demonstrate select sensitivity to alcohol-induced protein acylation. A number of these proteins reveal saturated lysine-site occupancy, suggesting a significant level of differential stoichiometry in the setting of ethanol consumption. We hypothesize that ethanol downregulates numerous mitochondrial metabolic pathways through differential acyl switching proteins. Data are available via ProteomeXchange with identifier PXD012089.

Keywords: acetylation; alcoholic liver disease; mass spectrometry; mitochondria; proteomics; sirtuins; succinylation.


Conflict of interest statement

The authors declare no competing interests.

Figures

Figure 1.
Figure 1.
Chronic ethanol ingestion increases biochemical markers of liver damage in WT, SIRT3 KO, and SIRT5 KO mice. (A) Analysis of plasma alanine aminotransferase (ALT). (B) Liver Triglycerides. (C) Liver to body weight ratio. (D) Body weight change. (E) Food consumption. Data are presented as mean ± SEM. Statistical significance was determined by unpaired Student’s t-test between each group of mice, *=p<0.05, **= p<0.005, ***=p<0.0005, ****= p<0.0001
Figure 2.
Figure 2.
Ethanol increases lysine acetylation and decreases succinylation of mitochondrial proteins in WT, SIRT3 KO, and SIRT5 KO mouse livers. (A) Representative anti-acetyllysine Western blot. (B) Representative anti-succinyllysine Western blot. (C) Representative SIRT3, SIRT5, and loading control (COXIV) Western blots. (D-G) Corresponding densitometry quantification using unpaired Student’s t-test (mean ± SEM, n=3, *=p<0.05, **=p<0.005, ***=p<0.0005, ****=p<0.0001).
Figure 3.
Figure 3.
Ethanol metabolism alters hepatic protein acylation and lipid deposition in WT, SIRT3 KO, and SIRT5 KO mice. Paraffin embedded formalin fixed hepatic tissue sections were analyzed using (A) hematoxylin and eosin (H&E) staining and IHC for (B) Plin2, (C) acetyllysine, and (D) succinyllysine. [CV = central vein, PT= portal vein. (10× mag), (n=3)] See also Figures S1–S3.
Figure 4.
Figure 4.
Quantification of lysine acetylation and succinylation sites on peptides from WT, SIRT3 KO, and SIRT5 KO mouse liver mitochondria. (A) Experimental approach for the enrichment, identification, and quantification of acetylated and succinylated peptides. (B and C) Listed in the boxes for each volcano plot are the numbers of peptides with significant changes in acetylation or succinylation due to ethanol consumption, (n=3, log2(fold change) ≥2 or ≤−2, p<0.05)
Figure 5.
Figure 5.
Overlap of acetylated and succinylated mitochondrial peptides and proteins in all genotypes. Venn diagrams showing the overlap of acetylation and succinylation on peptides and proteins for all genotypes.
Figure 6.
Figure 6.
Comparison of acetylated and succinylated peptides from mitochondrial proteins in WT, SIRT3 KO, and SIRT5 KO mice fed an ethanol diet or a control diet. (A and B) Number of acetylated and succinylated peptides identified in hepatic mitochondrial samples from WT, SIRT3 KO, and SIRT5 KO mice fed control or ethanol diet.. [WT C = wild-type mice fed CD. WT E = wild-type mice fed ED. S3 KO C = SIRT3 KO mice fed CD. S3 KO E = SIRT3 KO mice fed ED. S5 KO C = SIRT5 KO mice fed CD. S5 KO E = SIRT5 KO mice fed ED]
Figure 7.
Figure 7.
Label-free acyl-quantitation of differential acyl switching peptides on lysine residues at or near regulatory sites. Acetylation and succinylation relative quantitation of (A) aspartate aminotransferase K404 from amino acid metabolism, (B) ornithine carbamoyltranferase K88 from the urea cycle, (C) malate dehydrogenase K301 from the TCA cycle, (D) hyroxyacyl-coenzyme A dehydrogenase from fatty acid oxidation, (E) superoxide dismutase 2 K68, and (F) K122 from redox pathways and glutathione metabolism (mean ± SEM, n=3, *=p<0.05, **=p<0.005, ***=p<0.0005, ****=p<0.0001). The y-axes reflect MS quantification of acetylated and succinylated peptides obtained from each enrichment.
Figure 8.
Figure 8.
Western blot analysis reveals that the abundance of differential acyl switching proteins shown in figure 7 are unchanged in control and ethanol groups within each genotype, confirming that increases in acetylation and decreases in succinylation on these proteins are driven by post-translational modification and not a shift in protein abundance. (A) Representative western blot images for aspartate aminotransferase (AST), ornithine transcarbamylase (OTC), malate dehydrogenase 2 (MDH2), hydroxyacyl-coenzyme A dehydrogenase (HADH), and superoxide dismutase 2 (SOD2). (B-F) Corresponding densitometry quantification using unpaired Student’s t-test (mean ± SEM, n=3, *=p<0.05, **=p<0.005, ***=p<0.0005, ****=p<0.0001).
Figure 9.
Figure 9.
Pathway analysis of acetylated and succinylated mitochondrial proteins common to WT, SIRT3 KO and SIRT5 KO mice. (A) Pathway analysis of all WT, SIRT3 KO and SIRT5 KO mouse liver mitochondrial proteins with decreased succinylation. (B) Pathway analysis of all WT, SIRT3 KO and SIRT5 KO mouse liver mitochondrial proteins with increased acetylation. (C) Pathway analysis of all WT, SIRT3 KO and SIRT5 KO mouse liver mitochondrial proteins with increased acetylation and decreased succinylation at the same lysine residue as a function of chronic ethanol feeding (differential acyl switching proteins). (D) Pathway analysis of all WT, SIRT3 KO and SIRT5 KO mouse liver mitochondrial proteins with increased acetylation and/or decreased succinylation on different lysine residues as a function of chronic ethanol feeding. * The first number after each bar on the graph represents the number of acetylated and/or succinylated proteins identified per pathway. The second number represents the fold enrichment for that pathway.
Figure 10.
Figure 10.
Ethanol induces hyperacetylation and hyposuccinylation of mitochondrial proteins involved in diverse metabolic pathways. Map depicts the main mitochondrial pathways showing differential acyl switching proteins identified in each pathway in colored boxes. See also Figures Sl–S5 and Table S1.

References

    1. CDC Alcohol and Public Health: Alcohol-Related Disease Impact (ARDI) Average for United States 2006–2010 Alcohol-Attributable Deaths Due to Excessive Alcohol Use. https://www.cdc.gov/mmwr/Dreview/mmwrhtml/mm6310a2.htm: Center for Disease Control and Prevention: Atlanta, GA, 2013.
    1. NIAAA, NIAAA Alcohol Facts and Statistics https://www.niaaa.nih.gov/alcohol-health/overview-alcohol-consumption/al....
    1. WHO Global Status Report on Alcohol and Health 2014. http://aDDS.who.int/iris/bitstream/handle/10665/112736/9789240692763_eng....; World Health Organization:Geneva, 2014.
    1. Sacks JJ; Gonzales KR; Bouchery EE; Tomedi LE; Brewer RD, 2010 National and State Costs of Excessive Alcohol Consumption. American journal of preventive medicine 2015,49 (5), e73–e79. - PubMed
    1. Cederbaum AI, Alcohol metabolism. Clin Liver Dis 2012,16 (4), 667–85. - PMC - PubMed

Publication types