. 2019 Mar 1;129(3):1387-1401.
doi: 10.1172/JCI125456. Epub 2019 Feb 18.

CD33 recruitment inhibits IgE-mediated anaphylaxis and desensitizes mast cells to allergen

Affiliations

CD33 recruitment inhibits IgE-mediated anaphylaxis and desensitizes mast cells to allergen

Shiteng Duan et al. J Clin Invest. .

Abstract

Allergen immunotherapy for patients with allergies begins with weekly escalating doses of allergen under medical supervision to monitor and treat IgE mast cell-mediated anaphylaxis. There is currently no treatment to safely desensitize mast cells to enable robust allergen immunotherapy with therapeutic levels of allergen. Here, we demonstrated that liposomal nanoparticles bearing an allergen and a high-affinity glycan ligand of the inhibitory receptor CD33 profoundly suppressed IgE-mediated activation of mast cells, prevented anaphylaxis in Tg mice with mast cells expressing human CD33, and desensitized mice to subsequent allergen challenge for several days. We showed that high levels of CD33 were consistently expressed on human skin mast cells and that the antigenic liposomes with CD33 ligand prevented IgE-mediated bronchoconstriction in slices of human lung. The results demonstrated the potential of exploiting CD33 to desensitize mast cells to provide a therapeutic window for administering allergen immunotherapy without triggering anaphylaxis.

Keywords: Glycobiology; Immunology; Mast cells; Nanotechnology; Therapeutics.


Conflict of interest statement

Conflict of interest: The authors have declared that no conflict of interest exists.

Figures

Figure 1
Figure 1. Display of CD33L on antigenic liposomes suppresses IgE-dependent degranulation of LAD2 cells.
(A) Schematic representation of an antigenic liposome (TNP-LP, left) or an antigenic liposome displaying human CD33 ligands (TNP-LP-CD33L, right). (B) Antibody staining of various Siglecs (Sig-) on LAD2 cells analyzed by flow cytometry. (C) Flow cytometric analysis of binding of fluorescent liposomes with or without CD33L (20 μM) to LAD2 cells pretreated with isotype control or anti-CD33 (clone WM53). (D) Calcium flux of LAD2 cells induced by addition (arrow) of TNP-LP or TNP-LP-CD33 (2.5 μM) or PBS (1 μl). Graph shows quantification of the AUC of calcium flux induced by 2.5 μM TNP-LP or TNP-LP-CD33L. Results were combined from 2 independent experiments. (E) Degranulation induced by TNP-LP or TNP-LP-CD33L as measured by the percentage of β-hex release (n = 3 per condition; values are plotted as the mean ± SD). (F) Degranulation induced by TNP-LP (30 μM), TNP-LP-CD33L (30 μM), or a mixture of TNP-LP and LP-CD33L (30 μM each). (G) Degranulation induced by TNP-LP or TNP-LP-CD33L (30 μM) in the presence of LP-CD33L (10 μM). Control cells received buffer only. (H) Degranulation induced by TNP-LP or TNP-LP-CD33L (30 μM) in the presence of isotype or anti-CD33 (clone WM53, 1 μg/ml). (I) Degranulation induced by Ah2-LP or Ah2-LP-CD33L (30 μM), with final Ah2 at 750 ng/ml using LAD2 cells sensitized with atopic plasma reactive to peanut (PlasmaLab). (J) Degranulation induced by OVA-LP or OVA-LP-CD33L (30 μM), with the final OVA dose at 1.5 μg/ml using LAD2 cells sensitized with human anti–OVA-IgE. Results in EJ are representative of 3 independent experiments. ***P < 0.001 and ****P < 0.0001, by 2-tailed Student’s t test (D and E) and 1-way ANOVA followed by Tukey’s test (FJ). α, anti; Max, maximum.
Figure 2
Figure 2. Tg mice with mast cells expressing functional human CD33.
(A) Flow cytometric analysis of GFP expression on representative peritoneal mast cells harvested from C57BL/6J, control-Tg (Mcpt5-CreRosa26-Stopfl/fl-CD33+), and CD33-Tg (Mcpt5-Cre+/–Rosa26-Stopfl/fl-CD33+) mice. Mast cells were defined as PICD45+c-Kit+. Baseline GFP signal was determined by mast cells from C57BL/6J mice. (B) Quantification of the percentage of GFP+ peritoneal mast cells from mice of the 3 genotypes. Tg mice bearing 1 or 2 copies of CD33 were used. Both male and female mice 8 weeks or older were analyzed, with no difference observed. (C) Numbers of peritoneal mast cells from the same mice of the 3 genotypes as in B. (AC) Results were compiled from 6 experiments. (D) Staining of peritoneal cells harvested from control-Tg or CD33-Tg mice with anti-CD33 (clone WM53) or isotype control, as analyzed by flow cytometry. (E) Binding of fluorescent liposome, with or without CD33L (20 μM), to peritoneal mast cells (c-Kit+FcεRI+CD45+). (F) Degranulation of CD33+ BMMCs induced by TNP-LP or TNP-LP-CD33L. (G) Cytokine induction of CD33+ BMMCs following treatment with TNP-LP (40 μM), TNP-LP-CD33L (40 μM), LP-CD33L (40 μM), or a mixture of TNP-LP and LP-CD33L (40 μM each). Supernatant from the unstimulated cells was subtracted as a background. (H) Degranulation of CD33+ BMMCs induced by TNP-LP or TNP-LP-CD33L (30 μM) in the presence of anti-CD33 (2 μg/ml). (I and J) Cytokine production of CD33+ BMMCs induced by TNP-LP or TNP-LP-CD33L (40 μM) in the presence of anti-CD33 (10 μg/ml). Supernatant from untreated cells was subtracted as a background. Results shown are representative of 3 (DG) or 2 (HJ) independent experiments. (FJ) Values are plotted as the mean ± SD (n = 3 per condition). ***P < 0.001 and ****P < 0.0001, by 2-tailed Student’s t test (F) and 1-way ANOVA followed by Tukey’s test (C and GJ).
Figure 3
Figure 3. Recruitment of CD33 suppresses IgE/FcεRI signaling.
(A) Phosphorylation of Syk, PLCγ1, MEK, and ERK in LAD2 cells after a 3-, 10-, or 30-minute stimulation using TNP-LP or TNP-LP-CD33L (2 μM), as evaluated by Western blotting. (B) Phosphorylation of Syk and ERK in LAD2 cells after a 10-minute stimulation using TNP-LP, TNP-LP-CD33L, or LP-CD33L (2 μM), as evaluated by Western blotting. (C) Phosphorylation of Syk, PLCγ1, PLCγ2, JNK, AKT, and ERK in CD33+ BMMCs cells after a 10-minute stimulation with TNP-LP, TNP-LP-CD33L, or LP-CD33L (2 μM), as evaluated by Western blotting. (AC) Total Syk and ERK were used as loading controls. (DF) Proposed mechanisms of IgE/FcεRI signaling induced by antigenic liposomes and recruitment of CD33 by CD33L. (D) TNP-LP stabilizes the anti–TNP-IgE–FcεRI complex in lipid rafts with Src kinases that initiate the FcεRI signaling cascade. We propose that CD33 has no basal impact on signaling, because it is not constitutively localized in the same microdomain with FcεRI. (E) TNP-LP-CD33L recruits CD33 to the anti–TNP-IgE–FcεRI immunological synapse. Our results suggest that the cytoplasmic ITIMs of CD33 were phosphorylated by Src kinases and then recruited tyrosine phosphatases such as Shp-1, which dephosphorylated Syk, and other kinases. (F) Proposed model showing that monoclonal anti-CD33 antibodies (or LP-CD33L) block recruitment of CD33 to the IgE-FcεRI complex and enable mast cell degranulation induced by TNP-LP-CD33L.
Figure 4
Figure 4. Suppression of IgE-mediated anaphylaxis.
Display of CD33L on antigenic liposomes suppresses PCA and PSA in CD33-Tg mice (Mcpt5-Cre+/–Rosa26-Stopfl/fl-CD33+), but not in control-Tg mice (Mcpt5-Cre Rosa26-Stopfl/fl-CD33+). Mice bearing 1 or 2 copies of the CD33 transgene were used. In I, Mcpt5-Cre+/– mice expressing human CD33 (CD33-Tg) were crossed with Ptpn6fl/fl mice to yield mice with mast cells expressing CD33 and no Shp-1 (CD33-Tg/Shp-1–KO). (A) Injection scheme for the PCA model. The genotypes of the mice were determined by PCR after the experiments. (B) Representative images of vascular leakage induced by TNP-LP or TNP-LP-CD33L (50 μg) in control-Tg mice. (C) Quantification of local mast cell activation (absorbance at 650 nm) induced by TNP-LP (50 μg, n = 14) or TNP-LP-CD33L (50 μg, n = 28) in control-Tg mice. (D) Representative images of vascular leakage induced by TNP-LP or TNP-LP-CD33L (50 μg) in CD33-Tg mice. (E) Quantification of local mast cell activation (absorbance at 650 nm) induced by TNP-LP (50 μg, n = 21) or TNP-LP-CD33L (50 μg, n =27) in CD33-Tg mice. (F) Injection scheme for the PSA model. (GI) Decrease in rectal temperature induced by TNP-LP or TNP-LP-CD33L (150 μg) in control-Tg mice (G), CD33-Tg mice (H), and CD33-Tg mice lacking Shp-1 (I) that were sensitized with 10 μg anti–TNP-IgE. (GI) Values are plotted as the mean ± SEM at the indicated time points. Data are from 1 experiment (G and I) or were compiled from 3 (H) or 9 sets of experiments (C and E). ***P < 0.001 and ****P < 0.0001, by 1-way ANOVA followed by Tukey’s test (C and E), repeated-measures (RM) 2-way ANOVA (G and H), and RM 2-way ANOVA followed by Tukey’s test (I).
Figure 5
Figure 5. Antigenic liposomes with CD33L desensitize CD33-Tg mice to antigen challenge.
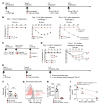
(A) Injection scheme for desensitization to TNP. CD33-Tg mice were used in the TNP-LP-CD33L–treated group (red). Both CD33-Tg and control-Tg mice were used in the 2 untreated groups (black, gray). (B) Changes in rectal temperature induced by treatment or the challenges indicated in A. (C) Injection scheme to determine antigen specificity of desensitization. CD33-Tg mice were used in the OVA-LP-CD33L–treated group (red circles and squares). Both CD33-Tg and control-Tg mice were used in the untreated group (gray circles and squares). (D) Rectal temperature induced by the treatment or challenge illustrated in C. (B and D) Values are plotted as the mean ± SEM. (E) Injection scheme used to evaluate the impact of TNP-LP-CD33L on mast cell frequency and anti–TNP-IgE on mast cells. Control mice received 200 μl PBS. (F) Frequencies of mast cells from peritoneal fluid from mice treated in E. Mast cell frequencies were determined by c-Kit+CD45+PI cells. (G) In vitro binding of fluorescent TNP-LP (20 μM) to peritoneal mast cells harvested from mice treated as illustrated in C. (H) MFI of fluorescent TNP-LP binding to peritoneal mast cells quantified in G. The background was determined using untreated cells from a naive mouse. (I) Serum anti–TNP-IgE quantified prior to and 6 hours and 24 hours after treatment with TNP-LP-CD33L (450 μg) using CD33-Tg mice sensitized with 10 μg anti–TNP-IgE. Control mice received 200 μl PBS. Data in B were compiled from 2 experiments. Data are representative of 2 (FH) or 3 (I) independent experiments. **P < 0.01, ***P < 0.001, and ****P < 0.0001, by RM 2-way ANOVA (B), RM 2-way ANOVA followed by Tukey’s test (D), and unpaired, 2-tailed Student’s t test (FI).
Figure 6
Figure 6. CD33 is expressed on human mast cells and inhibits IgE-mediated human airway bronchoconstriction.
(A) Flow cytometric analysis of mast cells isolated from discarded human skin (c-KithiFcεRI+ gated on PICD45+CD3CD19CD56 cells) (left) and overlay of isotype control and anti-CD33 staining of gated mast cells (right). (B) MFI of antibody staining of Siglecs on mast cells isolated from skin that was discarded following surgical procedures (n = 1 to 10 donors). (C) Time course of the percentage of bronchoconstriction of hPCLSs. Lung slices were sensitized with human IgE (4 mg/ml, gray) or anti–TNP-IgE (10 μg/ml, black and red) with recombinant human SCF (200 ng/ml, R&D Systems) overnight. Slices were challenged with anti–human IgE (20 μg/ml, gray), TNP-LP (50 μM, black), or TNP-LP-CD33L (50 μM, red) over a 10-minute period. The airway luminal area over time was compared with the baseline luminal area and expressed as the percentage of bronchoconstriction. Values represent the mean ± SEM. (D) AUC induced by the indicated treatments. AUC values below 0 are plotted as 0. (E) Percentage of bronchoconstriction induced by the indicated agents at 10 minutes. (F) Following stimulation with the indicated reagents, the percentage of bronchoconstriction induced by CCh (0.1 mM) was measured. *P < 0.05 and **P < 0.01, by 1-way ANOVA followed by Tukey’s test (DF). Gating of skin mast cells in A is representative of the 10 donors. Data in CF were compiled from 5 or 9 lung slices from 2 donors.

Comment in

References

    1. Pawankar R. Allergic diseases and asthma: a global public health concern and a call to action. World Allergy Organ J. 2014;7(1):12. - PMC - PubMed
    1. NIAID-Sponsored Expert Panel, et al. Guidelines for the diagnosis and management of food allergy in the United States: report of the NIAID-sponsored expert panel. J Allergy Clin Immunol. 2010;126(6 Suppl):S1–S58. - PMC - PubMed
    1. Gupta RS, et al. The prevalence, severity, and distribution of childhood food allergy in the United States. Pediatrics. 2011;128(1):e9–e17. doi: 10.1542/peds.2011-0204. - DOI - PubMed
    1. Wood RA, et al. Anaphylaxis in America: the prevalence and characteristics of anaphylaxis in the United States. J Allergy Clin Immunol. 2014;133(2):461–467. doi: 10.1016/j.jaci.2013.08.016. - DOI - PubMed
    1. Galli SJ, Tsai M. IgE and mast cells in allergic disease. Nat Med. 2012;18(5):693–704. doi: 10.1038/nm.2755. - DOI - PMC - PubMed

Publication types