. 2019 Jan 15;17(1):e3000059.
doi: 10.1371/journal.pbio.3000059. eCollection 2019 Jan.

Adding function to the genome of African Salmonella Typhimurium ST313 strain D23580

Affiliations

Adding function to the genome of African Salmonella Typhimurium ST313 strain D23580

Rocío Canals et al. PLoS Biol. .

Abstract

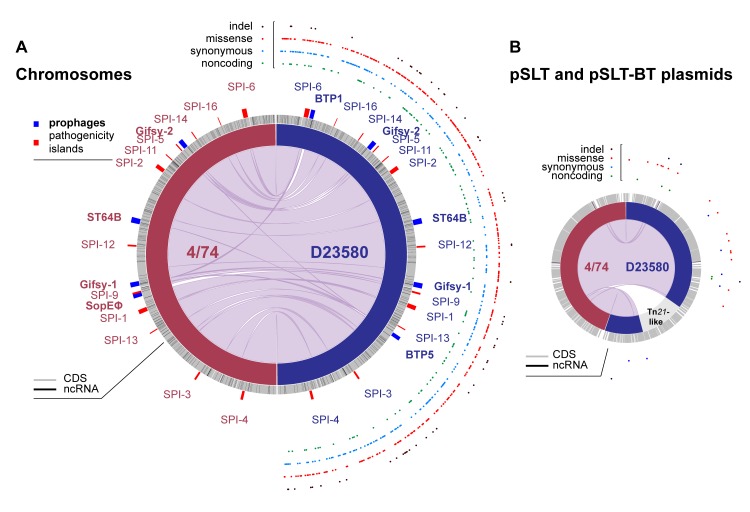
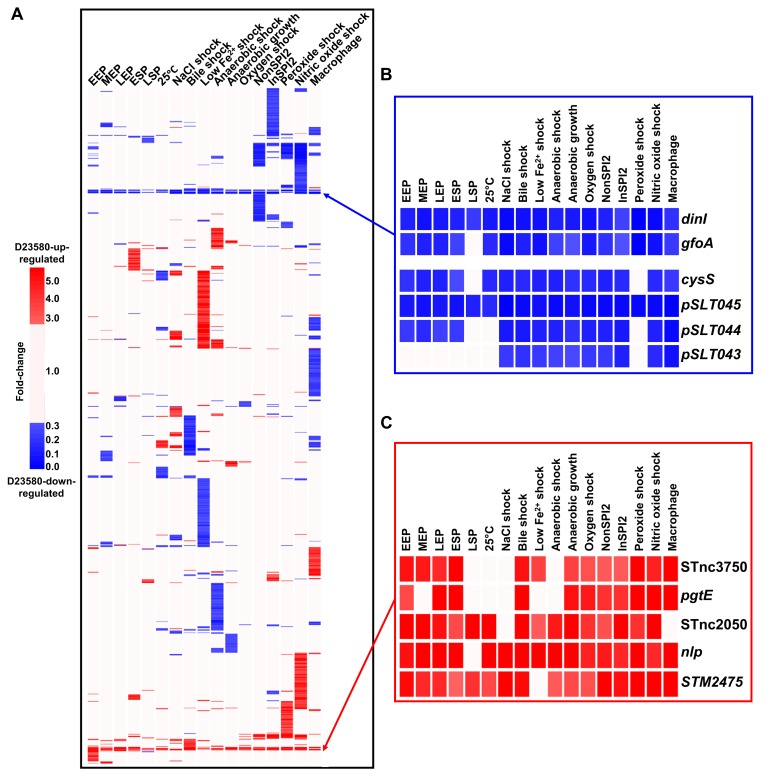
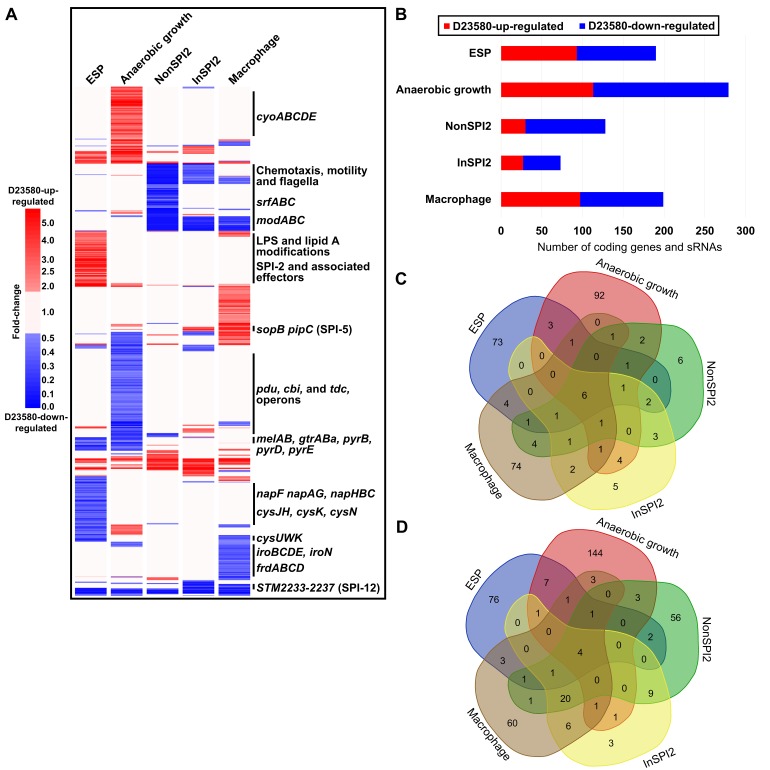
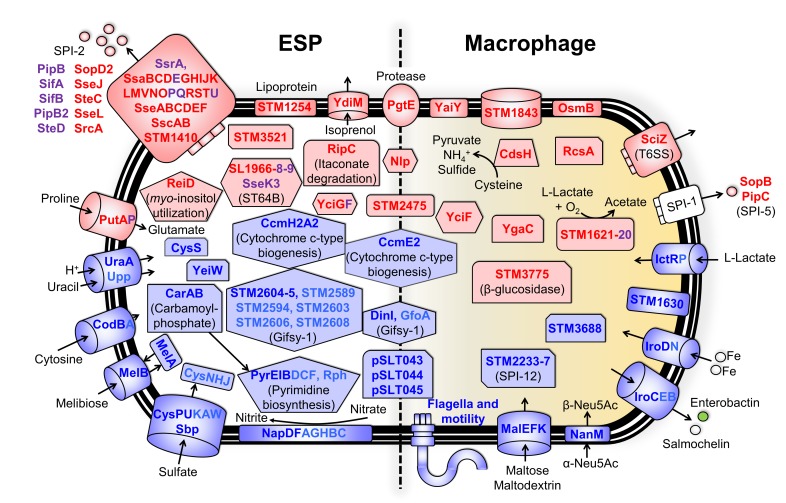
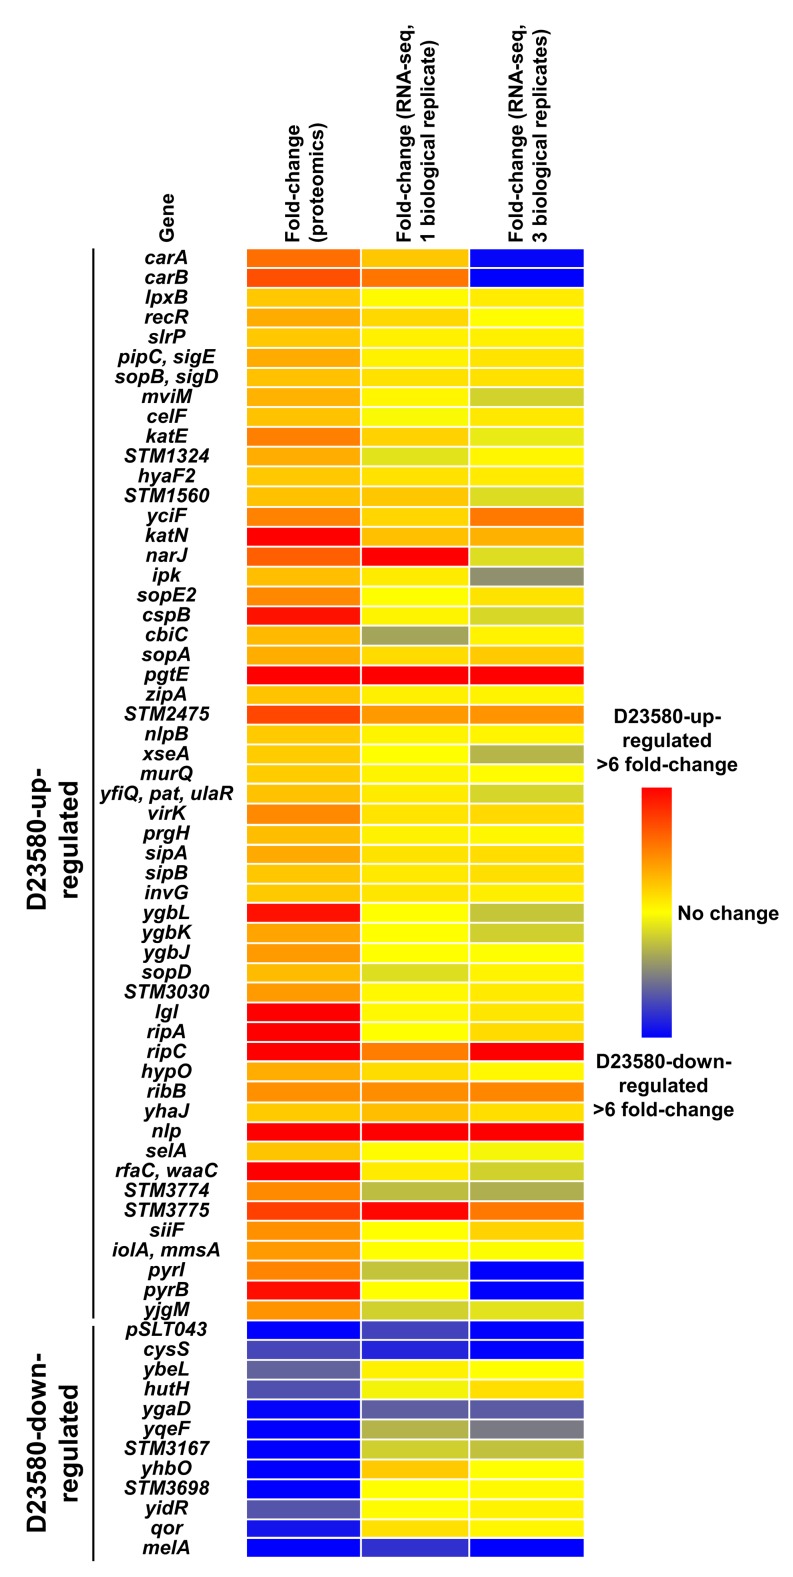
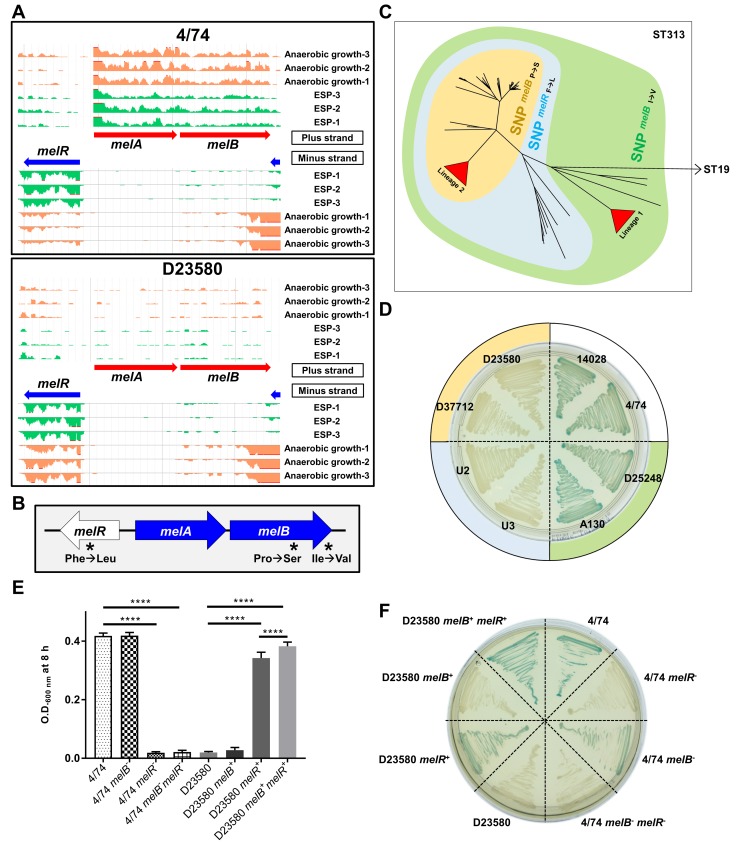
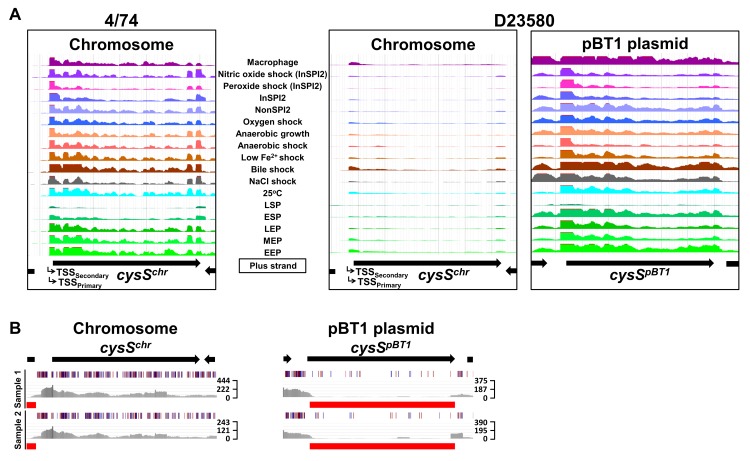
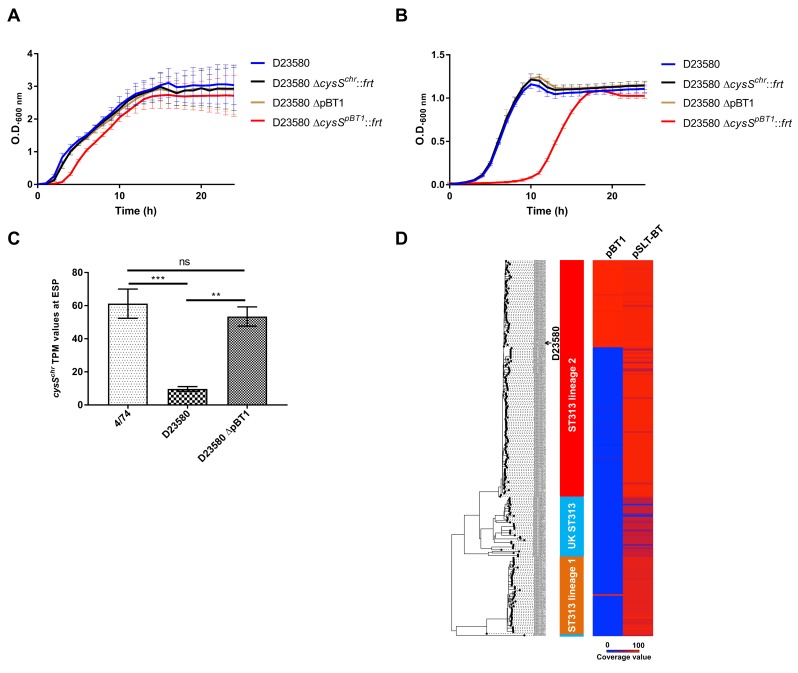
Salmonella Typhimurium sequence type (ST) 313 causes invasive nontyphoidal Salmonella (iNTS) disease in sub-Saharan Africa, targeting susceptible HIV+, malarial, or malnourished individuals. An in-depth genomic comparison between the ST313 isolate D23580 and the well-characterized ST19 isolate 4/74 that causes gastroenteritis across the globe revealed extensive synteny. To understand how the 856 nucleotide variations generated phenotypic differences, we devised a large-scale experimental approach that involved the global gene expression analysis of strains D23580 and 4/74 grown in 16 infection-relevant growth conditions. Comparison of transcriptional patterns identified virulence and metabolic genes that were differentially expressed between D23580 versus 4/74, many of which were validated by proteomics. We also uncovered the S. Typhimurium D23580 and 4/74 genes that showed expression differences during infection of murine macrophages. Our comparative transcriptomic data are presented in a new enhanced version of the Salmonella expression compendium, SalComD23580: http://bioinf.gen.tcd.ie/cgi-bin/salcom_v2.pl. We discovered that the ablation of melibiose utilization was caused by three independent SNP mutations in D23580 that are shared across ST313 lineage 2, suggesting that the ability to catabolize this carbon source has been negatively selected during ST313 evolution. The data revealed a novel, to our knowledge, plasmid maintenance system involving a plasmid-encoded CysS cysteinyl-tRNA synthetase, highlighting the power of large-scale comparative multicondition analyses to pinpoint key phenotypic differences between bacterial pathovariants.


Conflict of interest statement

The authors have declared that no competing interests exist.

Figures

Fig 1
Fig 1. Comparative genomic analysis between S. Typhimurium 4/74 and D23580.
Plots were obtained using the Circa software (http://omgenomics.com/circa/). (A) 4/74 and D23580 chromosomes; (B) 4/74 pSLT and D23580 pSLT-BT plasmids. In both panels, 4/74 data are represented on the left and D23580 data on the right. The four functional types of variants between D23580 and 4/74 are shown on the right-hand side of each panel (S3 Table). CDS and ncRNAs for S. Typhimurium D23580 are detailed in S2 Table and have already been reported for 4/74 in Kröger and colleagues [35]. CDS, coding sequence; ncRNA, noncoding RNA; SPI, Salmonella pathogenicity island; ST, sequence type.
Fig 2
Fig 2. Interstrain transcriptomic comparison of S. Typhimurium D23580 versus 4/74.
Expression of orthologous coding genes and sRNAs was compared between strains D23580 and 4/74 (reanalyzed data from Kröger and colleagues [37] and Srikumar and colleagues [40]) during growth in 17 infection-relevant conditions. The TPM value for each coding gene and sRNA in each condition in D23580 was divided by the TPM value for the same gene/sRNA and condition in 4/74. Heat maps were obtained using the GeneSpring GX7.3 software (Agilent, Santa Clara, CA, USA). Cluster analysis was performed using data with ≥3 fold-change. (A) Heat map of the 1,031 coding genes and sRNAs that showed significant difference (≥3 fold-change) between the two strains in at least one condition (S5 Table). The ≥3 fold-changes are shown in red (D23580-up-regulated) or blue (D23580-down-regulated). (B) Heat map representing D23580-down-regulated genes observed in all or most growth conditions. (C) Heat map of the D23580-up-regulated coding genes and sRNAs observed in most growth conditions. EEP, early exponential phase; ESP, early stationary phase; InSPI2, SPI-2-inducing; LEP, late exponential phase; LSP, late stationary phase; MEP, middle exponential phase; NonSPI2, SPI-2-noninducing; SPI, Salmonella pathogenicity island; sRNA, small RNA; TPM, transcripts per million.
Fig 3
Fig 3. Transcriptional signature of S. Typhimurium D23580.
Differential expression analysis of orthologous coding genes and sRNAs between strains D23580 and 4/74 during growth in five infection-relevant conditions. (A) Heat map highlighting biological relevant clusters. The CPM values of three biological replicates for each coding gene and sRNA in each condition in D23580 were compared to the CPM values for the same gene/sRNA and condition in 4/74. The heat map was obtained using GeneSpring GX7.3 (Agilent). Cluster analysis was performed with CPM values of the 677 coding genes and sRNAs that showed ≥2 fold-change and ≤0.001 of FDR in the differential expression analysis generated using Degust in at least one condition. Only fold-changes ≥2 with an FDR ≤0.001 are represented in red (D23580-up-regulated) or blue (D23580-down-regulated) (S6 Table). (B) Number of coding genes and sRNAs differentially expressed in each of the five growth conditions, based on Degust results (≥2 fold-change, ≤0.001 FDR). (C) Venn diagram of the D23580-up-regulated genes in the five growth conditions (http://bioinformatics.psb.ugent.be/webtools/Venn/) (S6 Table). (D) Venn diagram of the D23580-down-regulated genes in the five growth conditions (S6 Table). CPM, counts per million; ESP, early stationary phase; FDR, false discovery rate; InSPI2, SPI-2-inducing; LPS, lipopolysaccharide; NonSPI2, SPI-2-noninducing; SPI, Salmonella pathogenicity island; sRNA, small RNA.
Fig 4
Fig 4. Differentially expressed genes between S. Typhimurium 4/74 and D23580 in ESP and the intra-macrophage environment.
Differential gene expression of D23580 versus 4/74 in the ESP (on the left) and the macrophage (on the right) conditions. Colors refer to fold-changes of D23580 versus 4/74 from differential expression analysis using Degust; red = D23580-up-regulated, blue = D23580-down-regulated. The figure includes genes that are differentially expressed ≥4 fold-change with ≤0.001 FDR (red and blue font color). Purple and light blue font colors represent up-regulated or down-regulated genes, respectively, that are related to the previous functional groups of genes but have a fold-change ≤4 and ≥2 (≤0.001 FDR). ESP, early stationary phase; FDR, false discovery rate; SPI, Salmonella pathogenicity island.
Fig 5
Fig 5. Differentially expressed proteins between S. Typhimurium D23580 and 4/74.
Representation of significant D23580-up-regulated proteins (red dots) and D23580-down-regulated proteins (blue dots) in the ESP growth condition by Log2 fold-change and the chromosome location in D23580 (≥2 unique peptides, ≥2 fold-change, p-value <0.05). Gray dots refer to proteins that showed nonsignificant differences. ESP, early stationary phase.
Fig 6
Fig 6. Heat map of the 66 proteins that are differentially expressed between S. Typhimurium 4/74 and D23580.
Data represent levels of gene expression at the proteomic level in the ESP growth condition and in two independent ESP RNA-seq datasets (one biological replicate versus three biological replicates). ESP, early stationary phase; RNA-seq, RNA sequencing.
Fig 7
Fig 7. Melibiose phenotype differentiates the S. Typhimurium ST19 and ST313 strains.
(A) Visualization of RNA-seq data with three biological replicates in the ESP and anaerobic growth conditions using JBrowse [52] for the melibiose utilization operon. The scale of the mapped reads was 1 to 100. (B) Presence of three nonsynonymous SNPs in the melibiose utilization genes (4/74 → D23580). (C) Accumulation of SNPs in the melibiose utilization genes during the evolution of ST313 in the context of a whole-genome-core SNP phylogeny. Isolate names, ST313 lineage, and genotype for the three SNPs are included in S8 Table. (D) Alpha-galactosidase activity of representatives of ST19 and ST313 strains on Pinnacle Salmonella ABC medium (Lab M, Heywood, UK); green = positive, colorless = negative. The colors of the external circle correlate with the colors represented in the tree in (C). (E) Bacterial growth in minimal M9 medium supplemented with 0.4% melibiose (S1 Data). Statistical analysis was performed using one-way ANOVA and Tukey’s multiple comparison test. Bars represent the mean of seven biological replicates and standard deviation. Significant differences (****) indicate p-value <0.0001. (F) Alpha-galactosidase activity of 4/74 and D23580 WT strains and corresponding mutants. The ability to use melibiose is rescued in D23580 by exchange of the three SNP mutations. ESP, early stationary phase; RNA-seq, RNA sequencing; SNP, single-nucleotide polymorphism; ST, sequence type; WT, wild type.
Fig 8
Fig 8. The pBT1 plasmid encodes the functional cysteinyl-tRNA synthetase in S. Typhimurium D23580.
(A) RNA-seq data for cysS in 4/74 and chromosomal and pBT1-plasmid-encoded cysS in D23580 from the online JBrowse resources provided in this study. The scale of the mapped reads was 1 to 500. (B) Transposon library results for the cysSchr and cysSpBT1 genes in D23580. Figures were obtained using the Dalliance genome viewer [60]. Black arrows at the top represent genes. Each sample is represented by three tracks. The first track contains blue and red lines that correspond to transposon-insertion sites; red = orientation of the transposon is the same as the direction of the gene, blue = opposite direction. The second track shows raw data for the Illumina sequencing reads. The third track highlights in red those genes that were considered “required” for growth in that condition based on an insertion index. The insertion index was calculated for each gene as explained in [59,61], and genes with insertion index values <0.05 were considered as “required” for growth in the Lennox rich medium. The scale on the right represents sequence read coverage. EEP, early exponential phase; ESP, early stationary phase; InSPI2, SPI-2-inducing; LEP, late exponential phase; LSP, late stationary phase; MEP, middle exponential phase; NonSPI2, SPI-2-noninducing; RNA-seq, RNA sequencing; SPI, Salmonella pathogenicity island; tRNA, transfer RNA; TSS, transcriptional start site.
Fig 9
Fig 9. The pBT1-encoded cysS is required for optimal growth of S. Typhimurium D23580.
(A) Growth curves of D23580 WT, D23580 ΔcysSchr::frt, D23580 pBT1-cured strain, and D23580 ΔcysSpBT1::frt strains in LB medium, n = 8 (standard deviations are represented) (S1 Data). (B) Growth curves in minimal M9 medium supplemented with 0.4% glucose, n = 5 (standard deviations are represented) (S1 Data). (C) Comparison of cysSchr expression levels (TPM values) of 4/74 (n = 3), D23580 (n = 3), and the D23580 pBT1-cured strain (n = 2) in the ESP growth condition (S1 Data). Bars represent mean values and standard deviations. Significant differences (***) indicate p-value <0.001. (D) The pBT1 plasmid is present in a subset of ST313 isolates of lineage 2 and in one isolate from lineage 1. Isolate names, ST313 lineage, and coverage value for pBT1 and pSLT-BT are included in S8 Table. ESP, early stationary phase; LB, Lennox broth; ns, not significant; OD, optical density; ST, sequence type; TPM, transcripts per million; WT, wild type.

References

    1. Feasey NA, Dougan G, Kingsley RA, Heyderman RS, Gordon MA. Invasive non-typhoidal salmonella disease: an emerging and neglected tropical disease in Africa. Lancet. 2012;379: 2489–2499. 10.1016/S0140-6736(11)61752-2 - DOI - PMC - PubMed
    1. Ao TT, Feasey NA, Gordon MA, Keddy KH, Angulo FJ, Crump JA. Global Burden of Invasive Nontyphoidal Salmonella Disease, 20101. Emerg Infect Dis. 2015;21: 941–949. 10.3201/eid2106.140999 - DOI - PMC - PubMed
    1. Uche IV, MacLennan CA, Saul A. A Systematic Review of the Incidence, Risk Factors and Case Fatality Rates of Invasive Nontyphoidal Salmonella (iNTS) Disease in Africa (1966 to 2014). PLoS Negl Trop Dis. 2017;11: e0005118 10.1371/journal.pntd.0005118 - DOI - PMC - PubMed
    1. Okoro CK, Kingsley RA, Connor TR, Harris SR, Parry CM, Al-Mashhadani MN, et al. Intra-continental spread of human invasive Salmonella Typhimurium pathovariants in sub-Saharan Africa. Nat Genet. 2012;44: 1215–1221. 10.1038/ng.2423 - DOI - PMC - PubMed
    1. Ashton PM, Owen SV, Kaindama L, Rowe WPM, Lane CR, Larkin L, et al. Public health surveillance in the UK revolutionises our understanding of the invasive Salmonella Typhimurium epidemic in Africa. Genome Med. 2017;9(1):92 10.1186/s13073-017-0480-7 - DOI - PMC - PubMed

Publication types