. 2019 Apr;62(4):687-703.
doi: 10.1007/s00125-018-4800-2. Epub 2019 Jan 15.

The discovery of novel predictive biomarkers and early-stage pathophysiology for the transition from gestational diabetes to type 2 diabetes

Affiliations

The discovery of novel predictive biomarkers and early-stage pathophysiology for the transition from gestational diabetes to type 2 diabetes

Saifur R Khan et al. Diabetologia. 2019 Apr.

Erratum in

Abstract

Aims/hypothesis: Gestational diabetes mellitus (GDM) affects up to 20% of pregnancies, and almost half of the women affected progress to type 2 diabetes later in life, making GDM the most significant risk factor for the development of future type 2 diabetes. An accurate prediction of future type 2 diabetes risk in the early postpartum period after GDM would allow for timely interventions to prevent or delay type 2 diabetes. In addition, new targets for interventions may be revealed by understanding the underlying pathophysiology of the transition from GDM to type 2 diabetes. The aim of this study is to identify both a predictive signature and early-stage pathophysiology of the transition from GDM to type 2 diabetes.

Methods: We used a well-characterised prospective cohort of women with a history of GDM pregnancy, all of whom were enrolled at 6-9 weeks postpartum (baseline), were confirmed not to have diabetes via 2 h 75 g OGTT and tested anually for type 2 diabetes on an ongoing basis (2 years of follow-up). A large-scale targeted lipidomic study was implemented to analyse ~1100 lipid metabolites in baseline plasma samples using a nested pair-matched case-control design, with 55 incident cases matched to 85 non-case control participants. The relationships between the concentrations of baseline plasma lipids and respective follow-up status (either type 2 diabetes or no type 2 diabetes) were employed to discover both a predictive signature and the underlying pathophysiology of the transition from GDM to type 2 diabetes. In addition, the underlying pathophysiology was examined in vivo and in vitro.

Results: Machine learning optimisation in a decision tree format revealed a seven-lipid metabolite type 2 diabetes predictive signature with a discriminating power (AUC) of 0.92 (87% sensitivity, 93% specificity and 91% accuracy). The signature was highly robust as it includes 45-fold cross-validation under a high confidence threshold (1.0) and binary output, which together minimise the chance of data overfitting and bias selection. Concurrent analysis of differentially expressed lipid metabolite pathways uncovered the upregulation of α-linolenic/linoleic acid metabolism (false discovery rate [FDR] 0.002) and fatty acid biosynthesis (FDR 0.005) and the downregulation of sphingolipid metabolism (FDR 0.009) as being strongly associated with the risk of developing future type 2 diabetes. Focusing specifically on sphingolipids, the downregulation of sphingolipid metabolism using the pharmacological inhibitors fumonisin B1 (FB1) and myriocin in mouse islets and Min6 K8 cells (a pancreatic beta-cell like cell line) significantly impaired glucose-stimulated insulin secretion but had no significant impact on whole-body glucose homeostasis or insulin sensitivity.

Conclusions/interpretation: We reveal a novel predictive signature and associate reduced sphingolipids with the pathophysiology of transition from GDM to type 2 diabetes. Attenuating sphingolipid metabolism in islets impairs glucose-stimulated insulin secretion.

Keywords: Gestational diabetes mellitus; Glucose-stimulated insulin secretion; Lipidomic study; Machine learning; Multiple logistic regression; Pathophysiology; Predictive biomarker; Prospective cohort; Sphingolipid metabolism; Type 2 diabetes.


Figures

Fig. 1
Fig. 1
The schematic flow diagram of the study design. This was a nested case–control study within the SWIFT study, a prospective cohort of 1035 women diagnosed with GDM and followed up to 2 years postpartum. A total of 140 women were selected out of the 1035 SWIFT participants. These women did not have type 2 diabetesmellitus (T2DM) at 6–9 weeks postpartum(study baseline) based on 2 h 75 g OGTT. Of the 140 selected, 55 women were diagnosed as having T2DM, via 2 h 75 g OGTTs, within 2 years post baseline. This group was termed as ‘case’. The remaining 85 women did not develop T2DMbased on the results of the 2 h 75 g OGTTs within 2 years post baseline. This group was termed ‘control’ (non-T2DM). The fasting plasma from the baseline examination was used for LC-MS-based targeted lipidomics aimed at finding the relation in terms of a predictive signature and the earlier stage pathophysiology of T2DM prospectively within the 2 year follow-up period
Fig. 2
Fig. 2
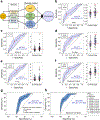
Predictive signatures/biomarkers for progression to type 2 diabetes. (a) Schematic flow diagram of the predictive signatures/biomarkers. (b) Univariate ROC analysis and box plot for FPG. The FPG value at 5.7 mmol/l (red circle) is the optimal cut-off for the mean AUC 0.64 within the 95% CI. (c) Univariate ROC analysis and box plot for HOMA-IR. The HOMA-IR value at −0.17 (red circle) is the optimal cut-off and provides the mean AUC 0.65 within the 95% CI. (d) Univariate ROC analysis and the box plot for 2 h post-load glucose in 75 g OGTT (2 h Glu). The 2 h glucose value at 6.58 mmol/l (red circle) is the optimal cut-off and provides the mean AUC 0.71 within the 95% CI. (e) Univariate ROC analysis and box plot for total fasting TAGs (T-TAG). The T-TAG value at 1.12 mmol/l (red circle) is the optimal cut-off and provides the mean AUC 0.61 within the 95% CI. (f) Univariate ROC analysis and box plot for the top AUC exhibiting lipid metabolite TAG54:0-FA16:0. The value at −0.03 mmol/l (red circle) is the optimal cut-off and provides the mean AUC 0.69 within the 95% CI. In the box plots (b–f), the distribution of population (case and control) based on FPG, HOMA-IR, 2 h glucose, T-TAG and TAG54:0-FA16:0 is shown, with the y-axis in mmol/l, except for HOMA-IR (unitless). The bottom and top of the box are the Q1 and Q3 (25th and 75th percentile), respectively, and the central band is the median (Q2 or 50th percentile). The bottom whisker is located within 1.5 IQR of the lower quartile, and the upper whisker is located within 1.5 IQR of the upper quartile. Outliers are presented in the outside of whiskers. The red line in each box plot shows the point that separates the whole population into two groups, case and control, to provide maximum class separation. A two-tailed, paired t test was carried out for each comparison; unadjusted p values: *p<0.05, **p<0.01, ***p<0.001 vs control. (g) In stepwise MLR with clinical variables, the signature with three variables (2 h glucose, FPG and family history of diabetes) provides the mean AUC 77%. (h) In stepwise MLR with lipid metabolites, the signature with 12 variables (lipids, shown on the right) provides the mean AUC 84%
Fig. 3
Fig. 3
The machine learning approach in predictive signature discovery. (a, b) ROC curve for type 2 diabetes (T2DM) cases (a) and control participants (b) in the filtered classifier algorithm. The mean AUC was 0.92 for both case (a) and control (b) within the 95% CI. (c) The decision tree generated from the filtered classifier algorithm. (d) The selection of cross-validation through the ‘one standard error’ rule where K=45 was selected. (e) Comparison table for the top biomarkers found using the different approaches
Fig. 4
Fig. 4
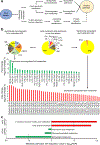
The putative pathway analysis for the development of type 2 diabetes. (a) Schematic flow diagram of the putative pathway analysis. (b) The distribution of the differentially expressed lipid species (75) within the final dataset (626); the bar graphs show the binary logarithm of fold changes (case/control) of all significant metabolites with ± SEM. (c) Pathway analysis: metabolite set enrichment (MSE) analysis based on FDR <0.05 (−log10 of FDR <1.3) and KEGG pathway analysis based on FDR <0.05 (−log10 of FDR <1.3). Red bars, upregulation; green bars, downregulation. HCer, hexosylceramide
Fig. 5
Fig. 5
In vivo functional studies. (a) Schematic flow diagram of the sphingolipid metabolism pathway showing targets of FB1 (pharmacological inhibitor). (b) The in vivo study design (n≥14): the control group of mice was injected with vehicle while the treatment group was injected with FB1 (1 mg/kg) daily. Every week, the weight gain and the FPG were monitored. At the end of the third week, GTT and ITT were performed. Finally, all mice were euthanised to collect whole pancreases and plasma. (c) So concentration in control and FB1-treated mice (n=3). (d) Representative chromatogram of So. (e) Comparison of the four Cer species found to significantly differ in the SWIFT cohort (values were mean-centred [n=3] and divided by the SD of each variable). In the boxplots (c, e), the bottom and top of the box are the Q1 and Q3 (25th and 75th percentile), respectively, and the central band is the median (Q2 or 50th percentile). The bottom whisker is located within 1.5 IQR of the lower quartile, and the upper whisker is located within 1.5 IQR of the upper quartile. (f) GTT single time point comparison between control (black line) and FB1 group (green line) at the end of 3 weeks treatment (n≥7). (g) ITT single time point comparison between control (black line) and FB1 group (green line) at the end of 3 weeks treatment (n≥7); inset shows AUC (mmol/l × min). (h, i) Representative insulin-stained pancreas (5 μm thickness, longitudinally sectioned through the pancreatic headto-tail axis) from control (h) and FB1-treated mice (i); scale bars, 3 mm; insets show ×40 magnification. (j) Insulin-positive area in pancreases of control and FB1-treated mice (n≥5). A two-tailed, unpaired t test was carried out for each comparison. Data are presented as mean ± SEM; unadjusted p values: *p<0.05 vs control
Fig. 6
Fig. 6
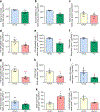
GSIS studies in vitro. (a–h) In Min6 K8 cells, FB1 treatment (green) did not alter basal (LG) insulin secretion (a) but significantly decreased GSIS (high glucose [HG]-stimulated) (b). Myriocin treatment (pink) did not alter basal insulin secretion (c) but significantly decreased GSIS (d). FB1 treatment significantly decreased KCl-stimulated insulin secretion (e) and total insulin (f). Myriocin treatment significantly decreased both KCl-stimulated insulin secretion (g) and total insulin (h). In Min6 K8 cells, 0 mmol/l glucose was used for LG and 10 mmol/l glucose was used in HG stimulation. For KCl stimulation, 25 mmol/l KCl was added to HG solution. (i–l) In murine islets, FB1 treatment significantly decreased both basal insulin secretion (i) and GSIS (j). Myriocin treatment significantly increased basal insulin secretion (k) and significantly decreased GSIS (l). In murine islets, 2.8 mmol/l glucose was used for LG and 16.7 mmol/l glucose was used in HG stimulation. For KCl stimulation, 25 mmol/l KCl was added to HG solution. Vehicle included 0.04% (v/v) DMSO for FB1 treatments (blue) or 0.0001 (v/v) DMSO for myriocin treatments (white). Data are presented as mean ± SEM (n=3 for FB1 in Min6 cells, n=5 for myriocin in Min6 cells, n≥6 for FB1 in C57BL/6 murine islets, n=3 for myriocin in C57BL/6 murine islets). A two-tailed, unpaired t test was carried out for each comparison (unadjusted p values: *p<0.05, **p<0.01, ***p<0.001 vs vehicle)

References

    1. Koning SH, Hoogenberg K, Lutgers HL, van den Berg PP, Wolffenbuttel BHR (2016) Gestational Diabetes Mellitus:current knowledge and unmet needs. J Diabetes 8(6):770–781. 10.1111/1753-0407.12422 - DOI - PubMed
    1. Hunt KJ, Schuller KL (2007) The increasing prevalence of diabetes in pregnancy. Obstet Gynecol Clin N Am 34(2):173–199, vii. 10.1016/j.ogc.2007.03.002 - DOI - PMC - PubMed
    1. Idris N, Wong SF, Thomae M, Gardener G, McIntyre DH (2010) Influence of polyhydramnios on perinatal outcome in pregestational diabetic pregnancies. Ultrasound Obstet Gynecol 36(3):338–343. 10.1002/uog.7676 - DOI - PubMed
    1. Metzger BE, Buchanan TA, Coustan DR et al. (2007) Summary and Recommendations of the Fifth International Workshop-Conference on Gestational Diabetes Mellitus. Diabetes Care 30(Supplement 2): S251–S260. 10.2337/dc07-s225 - DOI - PubMed
    1. Gunderson EP, Lewis CE, Tsai AL et al. (2007) A 20-year prospective study of childbearing and incidence of diabetes in young women, controlling for glycemia before conception: the Coronary Artery Risk Development in Young Adults (CARDIA) Study. Diabetes 56(12):2990–2996. 10.2337/db07-1024 - DOI - PMC - PubMed

Publication types

MeSH terms