. 2019 Jan 14;35(1):125-139.e9.
doi: 10.1016/j.ccell.2018.11.018.

The ERBB-STAT3 Axis Drives Tasmanian Devil Facial Tumor Disease

Affiliations

The ERBB-STAT3 Axis Drives Tasmanian Devil Facial Tumor Disease

Lindsay Kosack et al. Cancer Cell. .

Abstract

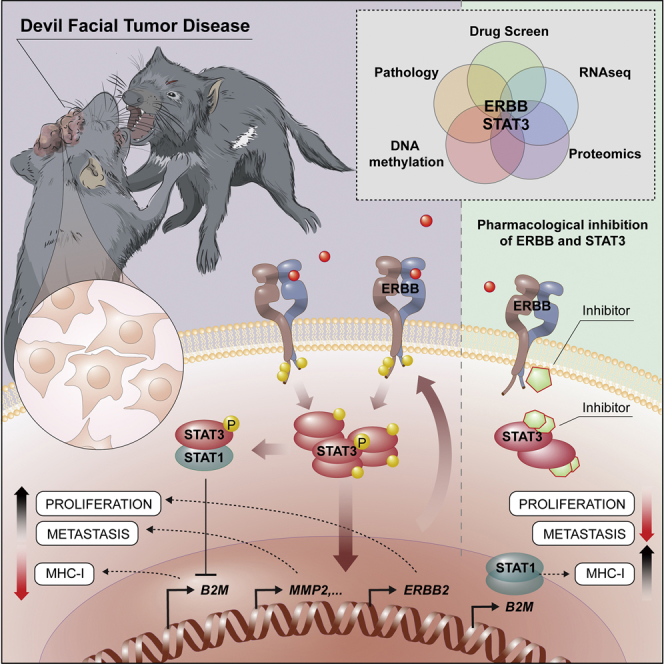
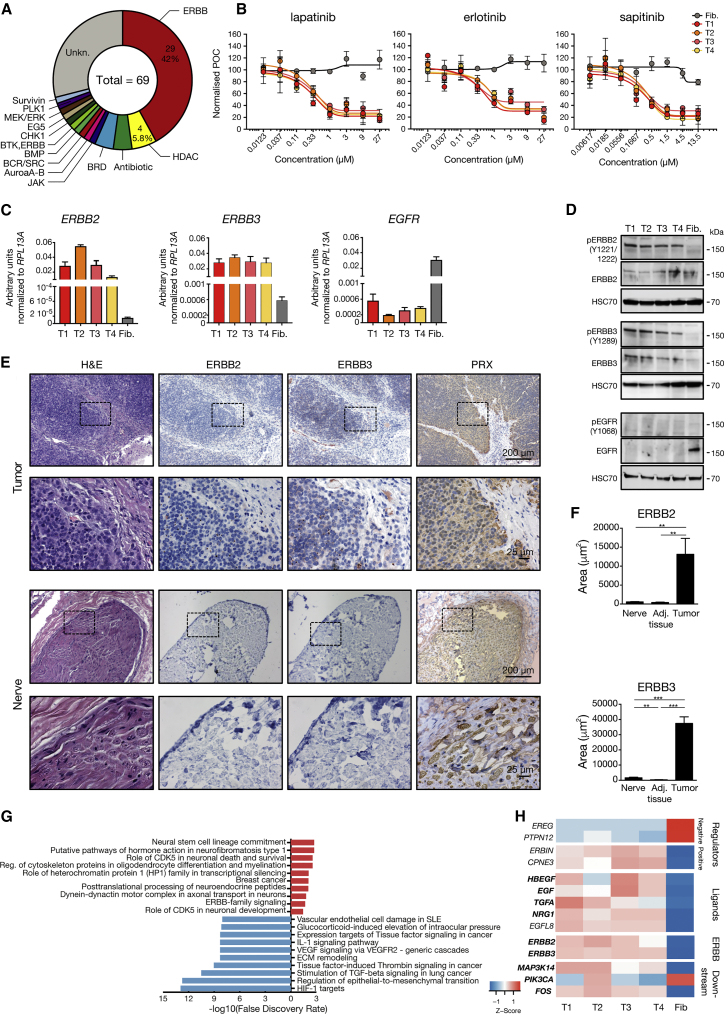
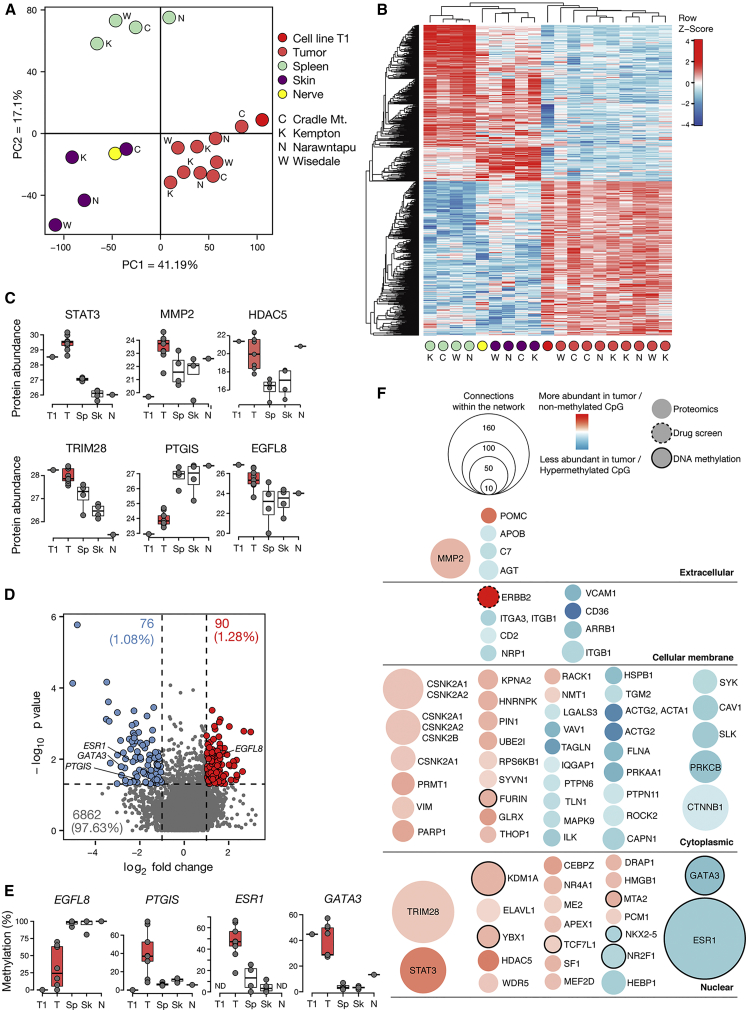
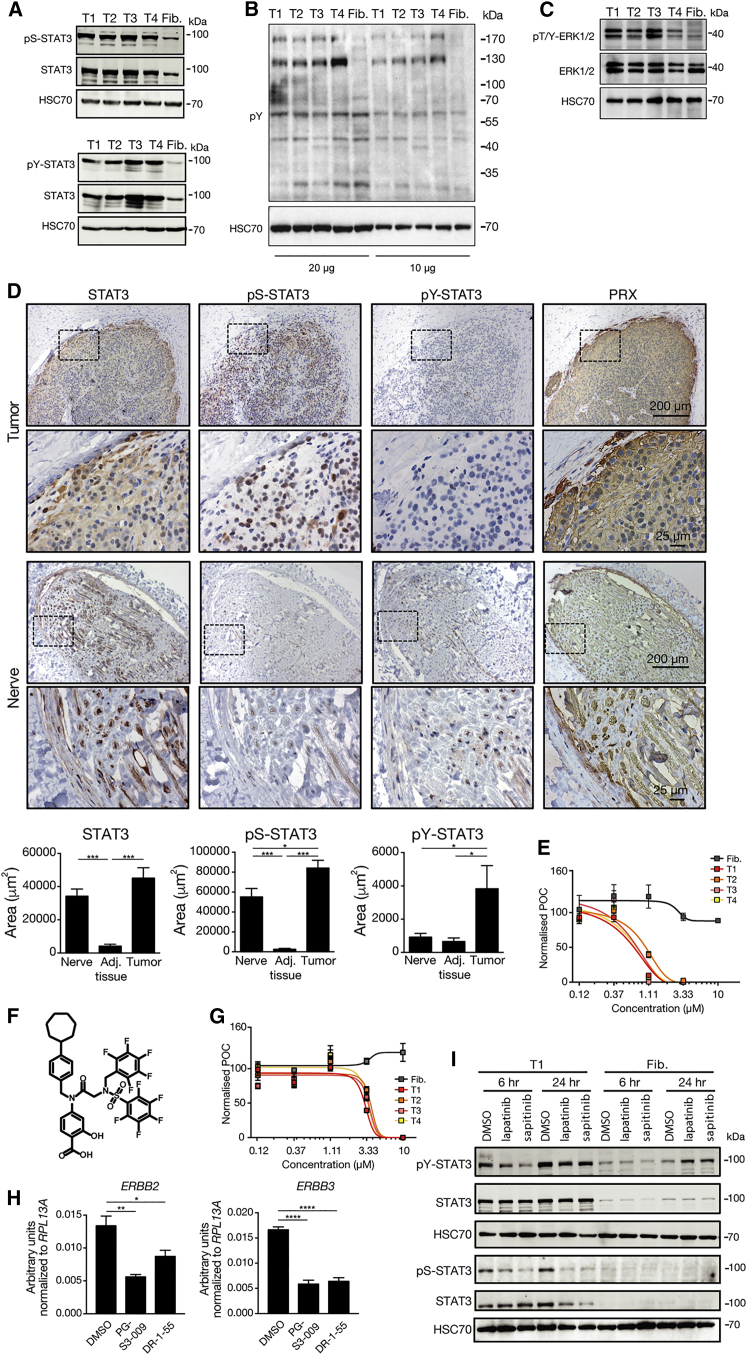
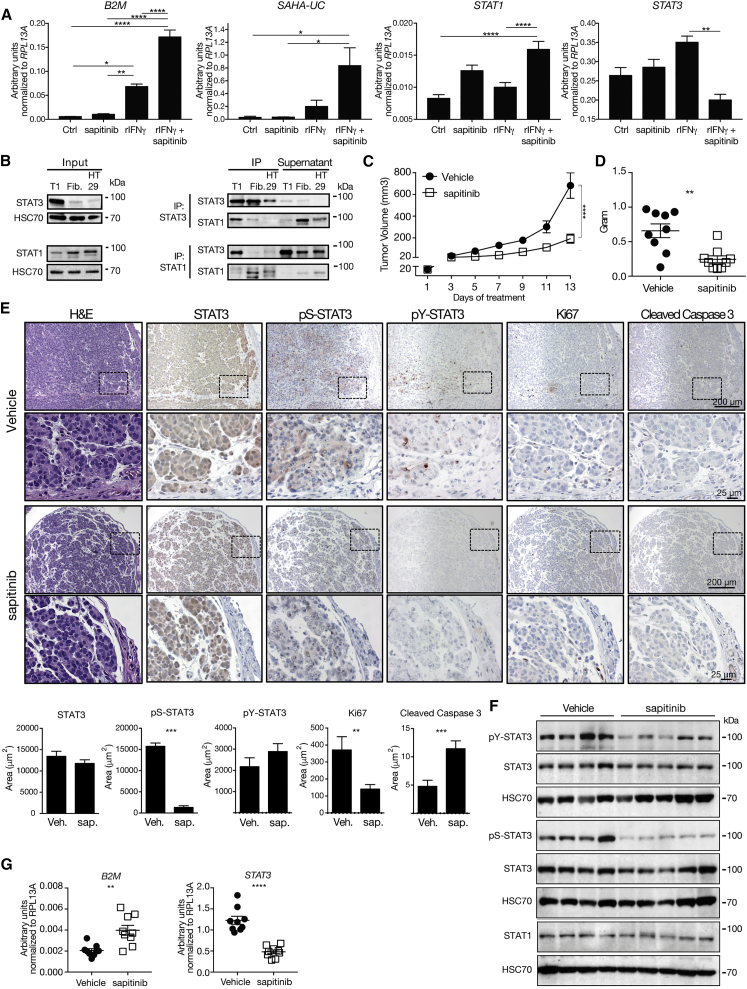
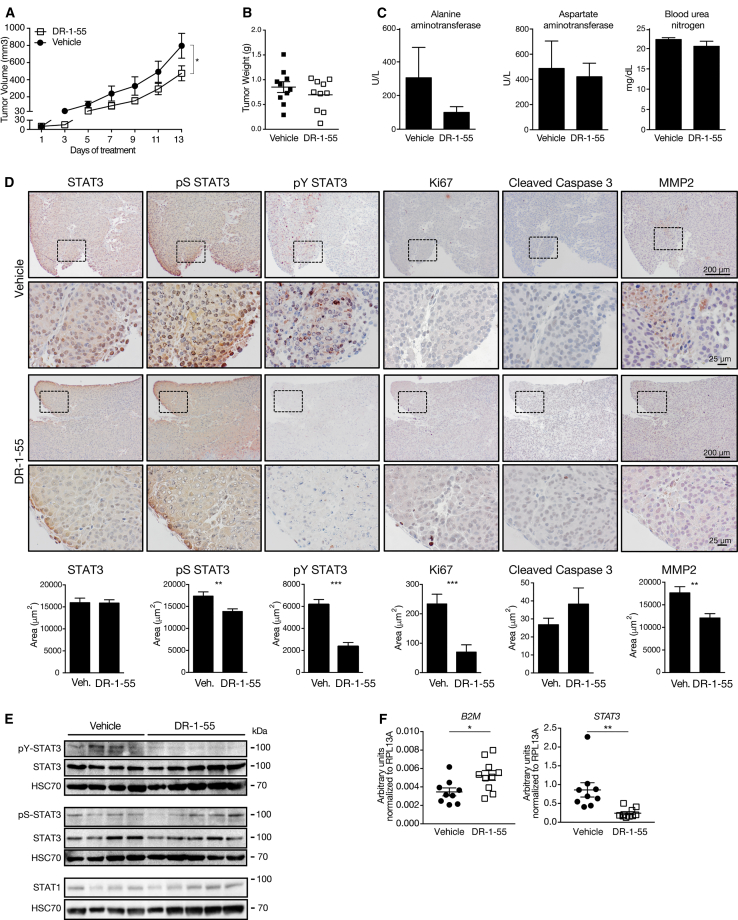
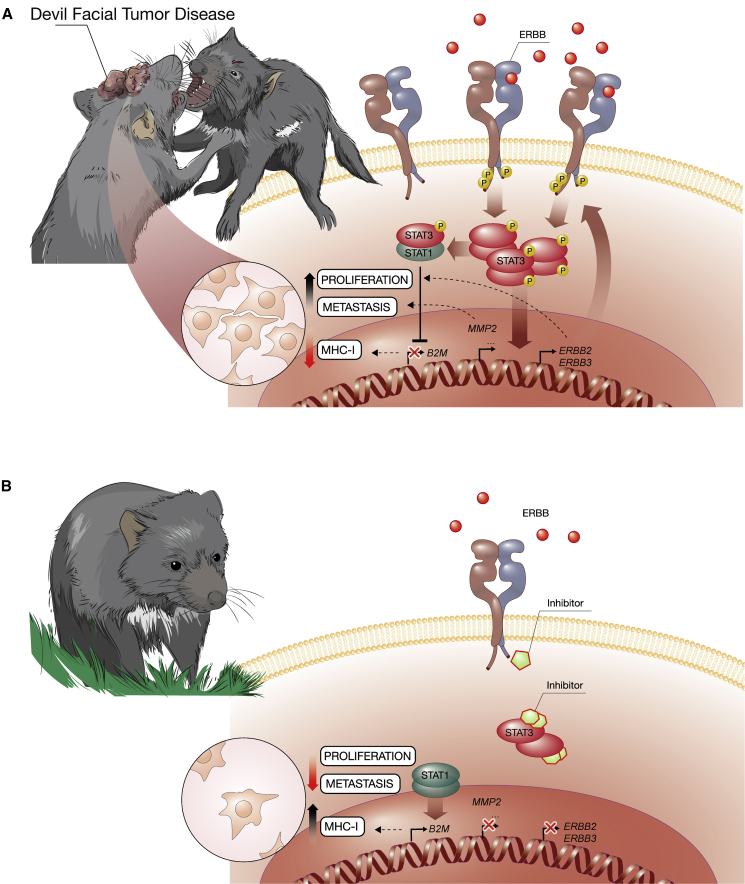
The marsupial Tasmanian devil (Sarcophilus harrisii) faces extinction due to transmissible devil facial tumor disease (DFTD). To unveil the molecular underpinnings of this transmissible cancer, we combined pharmacological screens with an integrated systems-biology characterization. Sensitivity to inhibitors of ERBB tyrosine kinases correlated with their overexpression. Proteomic and DNA methylation analyses revealed tumor-specific signatures linked to the evolutionary conserved oncogenic STAT3. ERBB inhibition blocked phosphorylation of STAT3 and arrested cancer cells. Pharmacological blockade of ERBB or STAT3 prevented tumor growth in xenograft models and restored MHC class I expression. This link between the hyperactive ERBB-STAT3 axis and major histocompatibility complex class I-mediated tumor immunosurveillance provides mechanistic insights into horizontal transmissibility and puts forward a dual chemo-immunotherapeutic strategy to save Tasmanian devils from DFTD. VIDEO ABSTRACT.

Keywords: ERBB; MHC class I; STAT3; Tasmanian devil; horizontal transmission; receptor tyrosine kinases; systems biology; transmissible cancer; tumor vulnerability; xenograft.


Figures

None
Graphical abstract
Figure 1
Figure 1
A Pharmacological Screen Identified ERBB-Specific Vulnerability of DFTD (A) The targets of the 69 drug hits in the 4-point drug screen showing a reduction in cell viability in at least 1 of the 4 DFTD cell lines compared with healthy fibroblasts. (B) Eight-point dose-response curves for lapatinib, erlotinib, and sapitinib in four tumor cell lines (T1–T4) and fibroblasts (Fib.) shown as normalized percentage of control (POC). (C) Expression of the ERBB family members quantified by real-time PCR (n = 3 replicates). (D) Western blots of the three annotated ERBB proteins (total and phosphorylated). (E) Histopathological analysis of tumor and peripheral nerve biopsies for H&E and immunohistochemistry (IHC) against Periaxin (PRX), ERBB2, and ERBB3 on serial consecutive sections. Dotted rectangles indicate magnified areas. Scale bars, 200 and 25 μm. (F) Quantification of ERBB2 and ERBB3 signal in tumor biopsies, adjacent tissue, and peripheral nerve tissue. Statistical significance was calculated by unpaired t test. (G) MetaCore pathway maps enrichments separately for up- (red) and downregulated (blue) transcripts in tumor cell lines versus fibroblasts. Only the first ten pathways and with a false discovery rate ≤0.05 are reported. (H) Heatmap of RNA-seq expression for genes driving the MetaCore pathway “ERBB-family signaling” (bold gene symbols) as well as known positive (ERBIN and CPNE3) and negative (EREG and PTPN12) regulators of the ERBB pathway and EGFL8 in four DFTD cell lines (T1–T4) and fibroblasts (Fib.). Graphs represent the mean ± SEM. See also Figure S1 and Tables S1, S2, S3, and S4.
Figure 2
Figure 2
Integrative Systems-Level Analysis of DFTD (A) Principal-component analysis of the 3,894 proteins quantified in all samples. Sampling locations are indicated in capital letters. Cell line denotes the DFTD cell line 06/2887 (T1) and “Nerve” stands for a healthy nerve biopsy. (B) Hierarchical clustering of the 987 differentially modulated proteins between tumor and healthy biopsies. (C) Boxplots of selected protein abundance across conditions in DFTD cell line (T1) and biopsies of tumor (T), spleen (Sp), skin (Sk), and nerve tissue (N). (D) Volcano plot of genes with differentially methylated promoters between healthy and tumor biopsies (hypermethylated in tumor [blue], hypomethylated in tumor [red]). (E) Boxplot of differentially methylated gene promoters for selected genes. (F) Direct connection proteins network among the 987 tumor-modulated proteins, 166 tumor differentially methylated gene promoters, and ERBB2 and ERBB3 from the drug screen and RNA-seq. The direct network interactions were built with MetaCore based on protein-protein binding, transcriptional regulation, and phosphorylation interactions. Tumor signature proteins do not have a border, while methylation candidates are represented with a black border. The ERBB2 candidate from the drug screen has a dashed black border. Of the 632 entities showing direct connectivity, only nodes with ten or more connections in MetaCore are displayed. The area of each entity is proportional to the number of connections within the network. Modulation on tumor versus healthy proteomics differential analysis, or healthy versus tumor for methylation, is colored from blue (down-modulated) to red (up-modulated). Boxplot boundaries mark the first and third quartiles, whiskers extending to 1.5 interquartile range from the boundaries, with the median in the center. See also Figures S2 and S3 and Tables S5 and S6.
Figure 3
Figure 3
Molecular Dissection of ERBB-STAT3 Axis in DFTD (A) Western blots of total STAT3, pS-STAT3, and pY-STAT3 of four DFTD cell lines (T1–T4) and fibroblasts (Fib.). (B) Total protein phosphorylation immunoblots from lysates of four DFTD cell lines (T1–T4) and fibroblasts (Fib.) using a global anti-pY monoclonal antibody (4G10) in different input amounts. (C) Western blots of total ERK1/2 and pT/Y-ERK1/2 of four DFTD cell lines (T1–T4) and fibroblasts (Fib.). (D) Representative images of IHC for total STAT3, pS-STAT3, pY-STAT3, and PRX in primary tumor and peripheral nerve biopsy on serial consecutive sections and quantification of total STAT3, pS-STAT3, and pY-STAT3 in tumor biopsies, adjacent tissue, and peripheral nerve tissue. Dotted rectangles indicate magnified areas. Scale bars, 200 and 25 μm. (E) Five-point dose-response curve of cell lines to the STAT3 inhibitor PG-S3-009 with DFTD and fibroblast cell lines. (F) Structure of DR-1-55. (G) Five-point dose-response curve of cell lines to the STAT3 inhibitor DR-1-55 with DFTD and fibroblast cell lines. (H) DFTD cells treated with 2 μM PG-S3-009, 4 μM DR-1-55, or DMSO as control. Twenty-four hours after treatment, expression of ERBB2 and ERBB3 was measured by real-time PCR (n = 3 replicates). (I) Western blots of total STAT3, pS-STAT3, and pY-STAT3 upon treatment with the ERBB inhibitors lapatinib (1 μM) and sapitinib (1 μM). Statistical significance was calculated by (D and H) unpaired t test. Graphs represent the mean ± SEM. See also Figure S4.
Figure 4
Figure 4
Blockade of ERBB Induces MHC Class I Gene Expression (A) DFTD tumor cell line T1 was treated with recombinant interferon-γ (rIFN-γ) and/or 1 μM sapitinib. Control cells were treated with solvents. Forty-eight hours after treatment, expression of B2M, SAHA-UC, STAT1, and STAT3 were measured by real-time PCR (n = 3 replicates). (B) Reciprocal co-immunoprecipitation of STAT3 and STAT1 followed by western blots for STAT3 and STAT1 in DFTD tumor cell line (T1), fibroblasts, and human HT29 colon cancer cells as control. (C and D) Tumor volume (C) and tumor weight (D) of DFTD tumor cell line T1 transplanted into NSG mice and treated with either vehicle or 50 mg/kg sapitinib once daily (bilateral tumors, n = 5 mice per group). One out of two representative experiments is shown. (E) H&E and IHC analyses for total STAT3, pS-STAT3, pY-STAT3, Ki67, and Cleaved Caspase 3 of tumor tissues. Pictures shown are from contiguous sections. Dotted rectangles indicate magnified areas. Quantification of total STAT3, pS-STAT3, pY-STAT3, Ki67, and Cleaved Caspase 3. Scale bars, 200 and 25 μm. (F) Western blots for total STAT3, pY-STAT3, pS-STAT3, and STAT1 from representative xenograft tumors. (G) Expression of B2M and STAT3 by real-time PCR from xenograft tumor tissue. Statistical significance was calculated by (A) one-way or (C) two-way ANOVA with Bonferroni correction or (D, E, and G) unpaired t test. Graphs represent the mean ± SEM. See also Figures S5 and S6.
Figure 5
Figure 5
Xenograft Model with STAT3 Inhibitor DR-1-55 (A and B) Tumor volume (A) and tumor weight (B) of NSG mice transplanted with DFTD tumor cell line T1 and, 22 days after transplantation, treated with either vehicle or 10 mg/kg DR-1-55 each day (bilateral tumors, n = 5 mice per group). (C) Serum concentration of alanine aminotransferase, aspartate aminotransferase, and blood urea nitrogen. (D) Tumor tissue immunohistochemically stained and quantified for total STAT3, pS-STAT3, pY-STAT3, Ki67, Cleaved Caspase 3, and MMP2. Pictures shown are from contiguous sections. Dotted rectangles indicate magnified areas. Scale bars, 200 and 25 μm. (E) Western blots for total STAT3, pY-STAT3, pS-STAT3, and STAT1 from representative xenograft tumors. (F) Expression of B2M and STAT3 by real-time PCR from xenograft tumor tissue. Statistical significance was calculated by (A) two-way ANOVA with Bonferroni correction or (B–D and F) unpaired t test. Graphs represent the mean ± SEM. See also Figure S6.
Figure 6
Figure 6
Working Model for the Impact of the ERBB-STAT3 Axis in DFTD (A) Aggressive social interactions in the highly inbred population of Tasmanian devils enabled the rapid spread of DFTD with fatal consequences. The hyperactive ERBB-STAT3 axis induces the expression of downstream metastasis-related genes (i.e., MMP2) while suppressing the expression of MHC class I genes (i.e., B2M). We hypothesize that highly abundant phosphorylated STAT3 protein traps unphosphorylated STAT1 proteins in heterodimers, thereby preventing the transcriptional regulation of STAT1 downstream target genes such as B2M. This may contribute to immune evasion and the known lack of tumor rejection upon horizontal transmission. (B) Interference with the ERBB-STAT3 axis by using either ERBB inhibitors or STAT3 inhibitors results in killing of DFTD tumor cells.

Comment in

  • The Deadly Bite of STAT3.
    Schwenzer H, Fassati A. Schwenzer H, et al. Cancer Cell. 2019 Jan 14;35(1):5-7. doi: 10.1016/j.ccell.2018.12.004. Cancer Cell. 2019. PMID: 30645976

References

    1. Ali A.M., Gomez-Biagi R.F., Rosa D.A., Lai P.S., Heaton W.L., Park J.S., Eiring A.M., Vellore N.A., de Araujo E.D. Disarming an electrophilic warhead: retaining potency in tyrosine kinase inhibitor (TKI)-resistant cml lines while circumventing pharmacokinetic liabilities. ChemMedChem. 2016;11:850–861. - PMC - PubMed
    1. Appert-Collin A., Hubert P., Cremel G., Bennasroune A. Role of ErbB receptors in cancer cell migration and invasion. Front. Pharmacol. 2015;6:283. - PMC - PubMed
    1. Arthur-Farraj P.J., Morgan C.C., Adamowicz M., Gomez-Sanchez J.A., Fazal S.V., Beucher A., Razzaghi B., Mirsky R., Jessen K.R., Aitman T.J. Changes in the coding and non-coding transcriptome and DNA methylome that define the Schwann cell repair phenotype after nerve injury. Cell Rep. 2017;20:2719–2734. - PMC - PubMed
    1. Assenov Y., Muller F., Lutsik P., Walter J., Lengauer T., Bock C. Comprehensive analysis of DNA methylation data with RnBeads. Nat. Methods. 2014;11:1138–1140. - PMC - PubMed
    1. Bae J.H., Schlessinger J. Asymmetric tyrosine kinase arrangements in activation or autophosphorylation of receptor tyrosine kinases. Mol. Cells. 2010;29:443–448. - PubMed

Publication types

MeSH terms

Substances