. 2019 Jan 14;35(1):33-45.e6.
doi: 10.1016/j.ccell.2018.12.001.

An Interferon-Driven Oxysterol-Based Defense against Tumor-Derived Extracellular Vesicles

Affiliations

An Interferon-Driven Oxysterol-Based Defense against Tumor-Derived Extracellular Vesicles

Angelica Ortiz et al. Cancer Cell. .

Abstract

Tumor-derived extracellular vesicles (TEV) "educate" healthy cells to promote metastases. We found that melanoma TEV downregulated type I interferon (IFN) receptor and expression of IFN-inducible cholesterol 25-hydroxylase (CH25H). CH25H produces 25-hydroxycholesterol, which inhibited TEV uptake. Low CH25H levels in leukocytes from melanoma patients correlated with poor prognosis. Mice incapable of downregulating the IFN receptor and Ch25h were resistant to TEV uptake, TEV-induced pre-metastatic niche, and melanoma lung metastases; however, ablation of Ch25h reversed these phenotypes. An anti-hypertensive drug, reserpine, suppressed TEV uptake and disrupted TEV-induced formation of the pre-metastatic niche and melanoma lung metastases. These results suggest the importance of CH25H in defense against education of normal cells by TEV and argue for the use of reserpine in adjuvant melanoma therapy.

Keywords: 25-hydroxycholesterol; IFNAR1; adjuvant therapy; exosomes; extracellular vesicles; interferon; melanoma; metastasis; pre-metastatic niche; reserpine.


Figures

Figure 1:
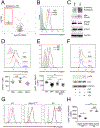
Figure 1:. TEV downregulate IFNAR1 in normal cells
A. Volcano plot summarizing SILAC-based plasma membrane profiling results from THP-1 cells treated with 1205Lu human melanoma TEV. Mean log2(fold change) and -log10(p value) are shown for 366 proteins identified by >1 unique peptide and quantitated in every replicate. Downregulated proteins with a fold change >2 and p<0.05 are outlined in red. B. Representative histogram of IFNAR1 cell surface levels measured by flow cytometry on THP-1 cells treated with 1205Lu human melanoma TEV (10 μg/106 cells for 2 hr) or PBS. C. Effects of TEV (10 μg/106 cells for 30 min) on IFNAR1 phosphorylation and ubiquitination in THP-1 cells. Immunoblot (IB) analyses of immunoprecipitated (IP) IFNAR1 using indicated antibodies are shown. Immunoblot analysis of βTRCP and GADPH levels in the whole cell lysate are also shown. D. Flow cytometry analysis of IFNAR1 cell surface levels on THP-1 cells treated with extracellular vesicles (5 μg for 2 hr) isolated from plasma of healthy donors (HDEV, n=8) or melanoma patients (MPEV, n=13) or PBS (n=7). A representative histogram (top) and quantification (bottom) are shown. E. IFNAR1 cell surface levels on peripheral blood leukocytes from healthy donors (HD; n=10) or melanoma patients (MP) from two independent cohorts: MP1 (40 patients of stages I-IV) and MP2 20 patients in each of two groups that were positive (SLN+) or negative (SLN) for sentinel lymph node metastases. A representative histogram (top) and ΔMFI quantification (bottom) are shown. F. Effect of extracellular vesicles from B16F10 (TEV, 10 μg/106 cells, 2 hr) or from primary mouse lung fibroblasts (FEV, 20 μg/106 cells, 2 hr) on IFNAR1 surface level (analyzed by flow cytometry, top) or p38 activation (analyzed by immunoblotting, bottom) in primary mouse splenocytes. G. Effect of B16F10 TEV treatment (10 μg/106 cells for 2 hr) on IFNAR1 surface level on splenocytes of indicated genotypes. H. Analysis of IFNAR1 cell surface levels on peripheral blood leukocytes from WT and SA mice (naive or bearing B16F10 tumors of equal size ~200 mm2, each n=4) Data are represented as mean ± SEM; p values: * p<0.05; ** p<0.01; *** p<0.001; NS, not significant from unpaired Student’s t test (panels A, D, E, H). See also Figure S1 and Table S1
Figure 2:
Figure 2:. TEV and IFN counteract effects of each other
A. Effect of pre-treatment with B16F10 TEV (10 μg/106 cells for 90 min) on activation of STAT1 by IFNβ (250 IU/mL for 30 min) or IFNγ (50 IU/mL for 30 min) in indicated mouse splenocytes analyzed by immunoblotting. B. qPCR analysis of mRNA for indicated genes in indicated mouse splenocytes treated with PBS, or extracellular vesicles from primary lung fibroblasts (FEV, n=3), or B16F10 (TEV, n=8) at 10 μg for 4 hr. C. qPCR analysis of mRNA for indicated genes in THP-1 cells treated with PBS (n=7) or with vesicles (5 μg for 4 hr) from healthy donors (HDEV) (n=8) or melanoma patients (MPEV). (n=13) D. Uptake of DiD-labeled B16F10 TEV (10 μg for 4 hr) by WT or SA splenocytes pre-treated with PBS or mouse IFNβ (1000 IU/mL for 8 hr); n=6 for each group. E. Uptake of DiD-labeled B16F10 TEV (10 μg for 4 hr) by indicated splenocytes (106/mL) pre-treated with IgG control or anti-IFNAR1 (0.33 μg/mL for 1 hr); n=6 for each group. F. In vivo uptake of i.v. administered DiD-labeled B16F10 TEV (30 μg for 24 hr) by splenocytes and bone marrow cells of indicated mice; n=6 for each group. Data are represented as mean ± SEM; p values: * p<0.05; ** p<0.01; *** p<0.001; NS, not significant from Student’s t test. See also Figure S2
Figure 3:
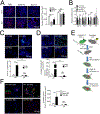
Figure 3:. Inactivation of IFNAR1 promotes education of normal cells by TEV and generation of the pre-metastatic niche
A. Immunofluorescence and quantification of IFNAR1 levels in lung tissues collected from indicated mice treated with indicated TEV (8 μg, 3× per week, 3 weeks). Red, IFNAR1; Blue, DAPI; Scale bar, 100 μm; Quantification representing averages from 10 random fields in sections from each of 3 different animals is shown in the right panel B. qPCR analysis of mRNA for indicated genes from lung tissues from panel A C. Immunofluorescence analysis of CD11b+ (green) clusters (>2 cells) in the lungs of WT and SA animals treated with PBS or B16F10 TEV (i.v., 8 μg 3× per week, 3 weeks). Scale bar - 100 μm; quantification representing averages from 7 random fields in sections from each of 3 different animals is shown in the bottom panel D. Immunofluorescence analysis of fibronectin (green) deposits in the lungs of WT and SA animals treated with PBS or B16F10 TEV (i.v., 8 μg 3× per week, 3 weeks). Scale bar, 100 μm; quantification representing averages from 7 random fields in sections from each of 3 different animals is shown in the bottom panel. E. Schematic of the experiments to evaluate the education of WT and SA bone marrow-derived cells by TEV and effect of this education on B16F10 tumor growth and metastasis F. Analysis and quantification of lungs from the td-Tomato-B16F10 tumors-bearing WT hosts that received GFP+ bone marrow derived cells (BMDCs) from WT or SA mice educated or not by TEV. Scale bar, 100 μm. Quantification represents averages from 7 random fields in sections from each of four different animals is shown in the right panel. Data are represented as mean ± SEM; p values: * p<0.05; *** p<0.001; NS, not significant from Student’s t test. See also Figure S3
Figure 4:
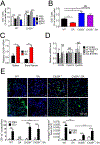
Figure 4:. CH25H functions downstream of IFNAR1 to limit education of normal cells by TEV
A. Uptake of DiD-labeled B16F10 TEV (10 μg for 4 hr) by splenocytes from indicated mice pre-treated with IFNβ (1000 IU/mL for 8 hr) or 25HC (4 μM for 2 hr) or vehicles as indicated; n=6 for each group. B. Analysis of DiD+ splenocytes and bone marrow cells isolated from mice of indicated genotypes 24 hr after i.v. administration of DiD-labeled B16F10 (30 μg); n=6 for each group. C. qPCR analysis of relative Ch25h mRNA levels in B16-F10 TEV-treated (10 μg, 4 hr) splenocytes or bone marrow cells of indicated genotypes (value of 1.0 ascribed to untreated WT cells) ; n=4 for each group. D. qPCR analysis of relative mRNA levels of Ch25h and other genes encoding cholesterol monooxygenases (Cyp27a and Cyp46a) in the lungs of WT or SA mice administered with PBS or B16F10 TEV (i.v., 8 μg, 3× per week, 3 weeks); n=4 for each group. E. Analysis of CD11b+ cell clusters and fibronectin deposits in the lungs of indicated mice treated with B16-F10 TEV (i.v., 8 μg, 3× per week, 3 weeks). Quantifications averaging from 7 random fields in sections from each of three different animals are shown. Scale bar, 100 μm. Data are represented as mean ± SEM; p values: * p<0.05; ** p<0.01; *** p<0.001; NS, not significant from Student’s t test. See also Figure S4
Figure 5:
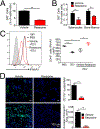
Figure 5:. Reserpine suppresses education of normal cells by TEV
A. Uptake of DiD-labeled 1205Lu TEV (10 μg for 4 hr) by THP-1 cells pre-treated with vehicle or reserpine (10 μM for 2 hr); n=3 for each group. B. Uptake of DiD-labeled B16F10 TEV (30 μg) by splenocytes and bone marrow cells isolated from WT mice 24 hr after i.p. injection of vehicle or reserpine (1 μg/kg i.p., given 30 min before TEV injection) followed by i.v. administration of TEV; n=6 for each group. C. Flow cytometry analysis of IFNAR1 levels on CD45+ peripheral blood leukocytes isolated from WT mice administered i.v. treatment with PBS or B16F10 TEV (8 μg, 3× per week, 3 weeks) and receiving i.p. vehicle or reserpine treatment (as in panel B) as indicated; n=3 for each group. D. Immunofluorescence analysis of CD11b+ cell clusters and fibronectin deposits in the lungs of WT mice receiving i.p. vehicle or reserpine treatment (as in panel B) followed by i.v. treatment with B16F10 TEV (8 μg, 3× per week, 3 weeks). Data are represented as mean ± SEM; p values: * p<0.05; ** p<0.01; *** p<0.001; NS – not significant from Student’s t test. See also Figure S5 and Table S2
Figure 6:
Figure 6:. The IFNAR1-CH25H pathway protects against melanoma progression and metastasis
A. qPCR analysis of CH25H mRNA levels in THP-1 cells treated with extracellular vesicles from healthy donors (HDEV, n=8) or melanoma patients (MPEV, n=13). B. qPCR analysis of CH25H mRNA levels in blood leukocytes from healthy donors (HD, n=10) or melanoma patients with (MET, n=17) or without (Non-MET, n=20) documented metastatic disease. C. Documented distant metastases in MP whose lymphocytes expressed greater (CH25Hhigh) or lower (CH25Hlow) levels of CH25H mRNA compared to healthy donors (HD); Fisher’s exact test: p value = 0.000661 D. Kaplan-Meier analysis of survival of melanoma patients classified as CH25Hhigh or CH25Hlow E. Representative H&E staining of lungs from indicated mice harvested 30 days after resection of s.c. B16F10 tumors of ~200 mm2. Examples of metastatic lesions are pointed by arrowheads. F. Quantification of total area of metastatic load in lungs from mice of indicated genotypes from panel G. Kaplan-Meier analysis of cancer-related survival of indicated mice that underwent resection of B16F10 tumors as described in panel E. Data are represented as mean ± SEM; p values: * p<0.05; ** p<0.01; *** p<0.001; NS, not significant from Student’s t test (panels A, B, F), Fisher test (panel C) or log-rank test (panels D, G). See also Figure S6
Figure 7:
Figure 7:. Activity of reserpine in the context of adjuvant/neoadjuvant therapy
A. Flow cytometry analysis of IFNAR1 cell surface levels on peripheral blood leukocytes from naive WT mice (n=4) or WT mice bearing similar sized B16F10 tumors treated with vehicle or reserpine (i.p. 1 mg/kg, 3x per week for 1 week; n=6 each). B. Kaplan-Meier survival analysis of B16F10 tumor bearing mice treated with vehicle or reserpine (i.p. 1 mg/kg every 48 hr for 1 week) C. Schematic description of experiments assessing activity of reserpine as neoadjuvant/adjuvant therapeutic agent D. Kaplan-Meier analysis of cancer-related survival of mice described in panel C. E. Quantification of total area of metastatic load in lungs from mice described in panel C (Vehicle n=12, Reserpine n=16). F. H&E staining of lungs from mice treated with vehicle or reserpine as in panel C and harvested 30 days after surgery. Examples of metastatic lesions are pointed by arrowheads. Data are represented as mean ± SEM; p values: * p<0.05; ** p<0.01; *** p<0.001 from Student’s t test (panels A, E) or log-rank test (panels B, D). See also Figure S7

Comment in

References

    1. Aleckovic M, and Kang Y (2015). Regulation of cancer metastasis by cell-free miRNAs. Biochim Biophys Acta 1855, 24–42. - PMC - PubMed
    1. Anggakusuma, Romero-Brey I, Berger C, Colpitts CC, Boldanova T, Engelmann M, Todt D, Perin PM, Behrendt P, Vondran FW, et al. (2015). Interferon-inducible cholesterol-25-hydroxylase restricts hepatitis C virus replication through blockage of membranous web formation. Hepatology 62, 702–714. - PubMed
    1. Baek AE, Yu YA, He S, Wardell SE, Chang CY, Kwon S, Pillai RV, McDowell HB, Thompson JW, Dubois LG, et al. (2017). The cholesterol metabolite 27 hydroxycholesterol facilitates breast cancer metastasis through its actions on immune cells. Nat Commun 8, 864. - PMC - PubMed
    1. Bar-Sagi D, and Prives J (1983). Trifluoperazine, a calmodulin antagonist, inhibits muscle cell fusion. The Journal of cell biology 97, 1375–1380. - PMC - PubMed
    1. Becker A, Thakur BK, Weiss JM, Kim HS, Peinado H, and Lyden D (2016). Extracellular Vesicles in Cancer: Cell-to-Cell Mediators of Metastasis. Cancer Cell 30, 836–848. - PMC - PubMed

Publication types

MeSH terms