Trends in Socioeconomic Inequalities and Prevalence of Anemia Among Children and Nonpregnant Women in Low- and Middle-Income Countries
- PMID: 30646183
- PMCID: PMC6324516
- DOI: 10.1001/jamanetworkopen.2018.2899
Trends in Socioeconomic Inequalities and Prevalence of Anemia Among Children and Nonpregnant Women in Low- and Middle-Income Countries
Abstract
Importance: Anemia remains a major challenge for women's and children's health in low- and middle-income countries (LMICs).
Objective: To assess the socioeconomic inequalities and prevalence of anemia among children and nonpregnant girls and women in LMICs over time.
Design, setting, and participants: This cross-sectional and repeated cross-sectional analysis used data from the Demographic and Health Surveys collected from January 1, 2000, through December 31, 2014. Initial cross-sectional data sets constructed from the most recent surveys included 163 419 children aged 6 to 59 months and 304 202 nonpregnant girls and women aged 15 to 49 years (hereinafter referred to as nonpregnant women) from 45 LMICs. Repeated cross-sectional data sets from the most recent and the earliest surveys consisted of 322 088 nonpregnant women from 25 LMICs and 182 273 children from 24 LMICs. Analyses were conducted from June 1, 2016, through July 3, 2018.
Main outcomes and measures: Total and severe anemia for children aged 6 to 59 months (hemoglobin level, <11 and <7 g/dL, respectively) and nonpregnant women aged 15 to 49 years (<12 and <8 g/dL, respectively) were defined according to the World Health Organization hemoglobin cutoff levels. The slope index of inequality (SII) and the relative index of inequality (RII) were calculated to determine anemia inequalities.
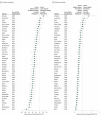
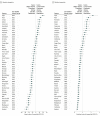
Results: Among the 163 419 children aged 6 to 59 months and the 304 202 nonpregnant women aged 15 to 49 years in the initial cross-sectional data sets, 34 of 45 countries had anemia prevalence levels for children greater than 40% and 37 of 45 had anemia prevalence levels greater than 20% for nonpregnant women. Among the 182 273 children from 24 LMICs and 322 088 nonpregnant women from 25 LMICs in the repeated cross-sectional data sets, the annualized absolute decreases in the prevalence of anemia ranged from 0.67 to 3.98 percentage points in 16 of the 24 LMICs; for cases of severe anemia, the decrease was 0.03 to 0.82 percentage points in 15 LMICs. Among 322 088 nonpregnant women from 25 LMICs in the repeated cross-sectional data sets, the annualized absolute decreases in the prevalence of anemia ranged from 0.49 to 2.59 percentage points in 17 of 25 LMICs; for severe anemia, the decrease was 0.03 to 0.29 percentage points in 15 LMICs. The SII was significantly negative and the RII was significantly less than 1 in 37 of the 45 LMICs among children and in 26 of the 45 LMICs for nonpregnant women. The annualized changes in the SII approached 0 in 16 of the 24 LMICs among children and in 11 of 25 LMICs among nonpregnant women.
Conclusions and relevance: Most LMICs continue to exhibit a high prevalence of anemia among children and nonpregnant women, although the prevalence of total and severe anemia have decreased in many LMICs. Anemia inequalities among children and nonpregnant women persist in most LMICs.
Conflict of interest statement
Figures


References
-
- World Health Organization Worldwide Prevalence of Anemia 1993–2005: WHO Global Database on Anemia. Geneva, Switzerland: World Health Organization; 2008.
Publication types
MeSH terms
Substances
LinkOut - more resources
Full Text Sources
Medical

