. 2018 Oct 5;1(6):e183146.
doi: 10.1001/jamanetworkopen.2018.3146.

Factors Associated With Cancer Disparities Among Low-, Medium-, and High-Income US Counties

Affiliations

Factors Associated With Cancer Disparities Among Low-, Medium-, and High-Income US Counties

Jeremy M O'Connor et al. JAMA Netw Open. .

Abstract

Background: There are concerns about the degree to which county income level might underlie the stark disparities in cancer death rates among US counties; at the same time, there is uncertainty about the factors that may mediate the disparities.

Objectives: To assess county-level cancer death rates and to identify possible mediators of the association between county-level median incomes and cancer death rates.

Design, setting, and participants: Cross-sectional study using death records from the National Center for Health Statistics in 2014, with data collected and analyzed between October 1, 2016, and July 31, 2017. All US counties and county equivalents were included.

Exposures: County-level median household income.

Main outcomes and measures: County-level age-standardized cancer death rate.

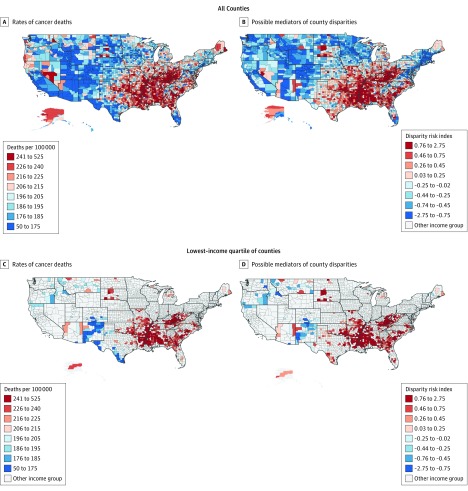
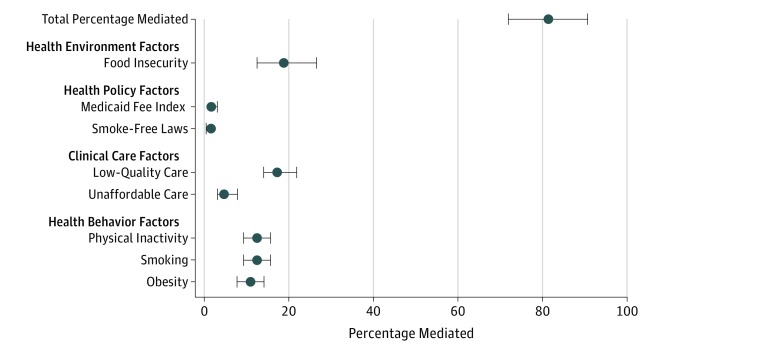
Results: In 3135 counties, median incomes ranged from $22 126 to $121 250 per year. Low-income counties (median income, $33 445) vs high-income counties (median income, $55 780) had higher proportions of residents who were non-Hispanic black, lived in rural areas, or reported poor or fair health. The mean (SD) cancer death rate was 185.9 (24.4) per 100 000 person-years in high-income counties, compared with 204.9 (26.3) and 229.7 (32.9) per 100 000 person-years in medium- and low-income counties, respectively. In mediation models, health risk behaviors (smoking, obesity, and physical inactivity); clinical care factors (unaffordable care and low-quality care); health environments (food insecurity); and health policies (state smoke-free laws and Medicaid payment rates) in aggregate accounted for more than 80% of the income-related disparity. The strongest possible mediators were food insecurity (explaining 19.1% [95% CI, 12.5%-26.5%] of the association between county incomes and cancer deaths), low-quality care (17.9%; 95% CI, 14.0%-21.8%), smoking (12.7%; 95% CI, 9.4%-15.6%), and physical inactivity (12.2%; 95% CI, 9.4%-15.6%).

Conclusions and relevance: There are wide gaps in cancer death rates between low-, medium-, and high-income counties. Future studies are needed to assess whether targeting the possible mediators might ameliorate the substantial socioeconomic cancer disparities.


Conflict of interest statement

Conflict of Interest Disclosures: Dr Gross has received support for research from 21st Century Oncology, Johnson & Johnson, Medtronic, and Pfizer. No other disclosures were reported.

Figures

Figure 1.
Figure 1.. Schema for Models of Mediation
We adapted schemas for single-mediator (A) and multiple-mediator (B) models from Preacher and Hayes. The subsequent models of mediation can be used to estimate the direct effects of E on O and the indirect effects of E on O that might be attributable to M. The subscripts in panel B identify the separate pathways for the multiple mediators (ie, M1 vs M2).
Figure 2.
Figure 2.. County Rates of Cancer Deaths and Potential Mediators of Disparities in Cancer Death Rates Between Low-, Medium-, and High-Income US Counties
A, Age-adjusted annual cancer death rate. B and D, Values for the disparity risk index, which we used to represent the geographic spread of the key factors that may act as mediators of county income-related disparities in cancer death rates. C, Income-adjusted annual cancer death rate in each county for the lowest-income quartile of counties.
Figure 3.
Figure 3.. Percentage Mediated by County-Level Factors in a Multivariable Model of the Association Between County-Level Median Household Incomes and Cancer Death Rates
For the definitions and the sources of the data for the factors that may serve as mediators, see eTable 1 in the Supplement. To calculate the percentage mediated, we used the β coefficients from the multiple mediator model reported in Table 2. Error bars represent 95% CIs.

References

    1. Siegel RL, Miller KD, Jemal A. Cancer statistics, 2016. CA Cancer J Clin. 2016;66(1):-. doi:10.3322/caac.21332 - DOI - PubMed
    1. Mokdad AH, Dwyer-Lindgren L, Fitzmaurice C, et al. . Trends and patterns of disparities in cancer mortality among US counties, 1980-2014. JAMA. 2017;317(4):388-406. doi:10.1001/jama.2016.20324 - DOI - PMC - PubMed
    1. Wheeler SB, Basch E. Translating cancer surveillance data into effective public health interventions. JAMA. 2017;317(4):365-367. doi:10.1001/jama.2016.20326 - DOI - PubMed
    1. Dwyer-Lindgren L, Bertozzi-Villa A, Stubbs RW, et al. . Inequalities in life expectancy among US counties, 1980 to 2014: temporal trends and key drivers. JAMA Intern Med. 2017;177(7):1003-1011. doi:10.1001/jamainternmed.2017.0918 - DOI - PMC - PubMed
    1. Hood CM, Gennuso KP, Swain GR, Catlin BB. County health rankings: relationships between determinant factors and health outcomes. Am J Prev Med. 2016;50(2):129-135. doi:10.1016/j.amepre.2015.08.024 - DOI - PubMed

Publication types