

Variation in and Hospital Characteristics Associated With the Value of Care for Medicare Beneficiaries With Acute Myocardial Infarction, Heart Failure, and Pneumonia
- PMID: 30646247
- PMCID: PMC6324438
- DOI: 10.1001/jamanetworkopen.2018.3519
Variation in and Hospital Characteristics Associated With the Value of Care for Medicare Beneficiaries With Acute Myocardial Infarction, Heart Failure, and Pneumonia
Abstract
Importance: Payers and policy makers have advocated for transitioning toward value-based payment models. However, little is known about what is the extent of hospital variation in the value of care and whether there are any hospital characteristics associated with high-value care.
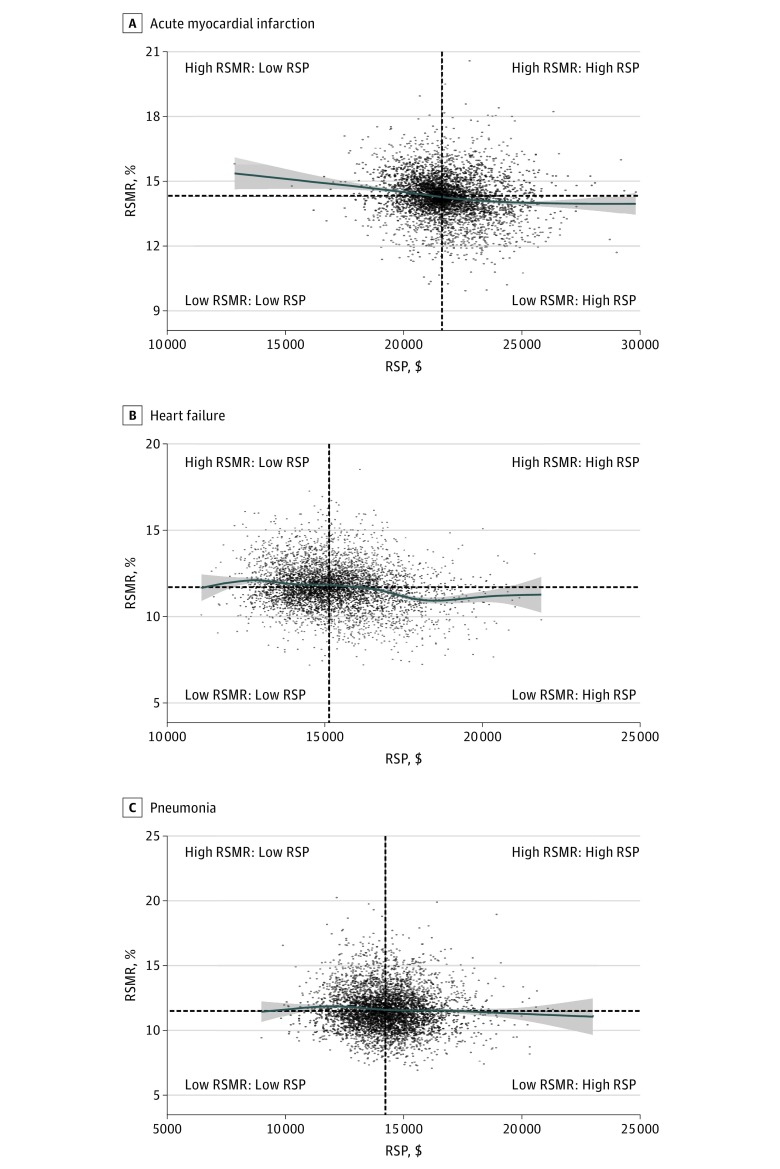
Objectives: To investigate the association between hospital-level 30-day risk-standardized mortality rates (RSMRs) and 30-day risk-standardized payments (RSPs) for acute myocardial infarction (AMI), heart failure (HF), and pneumonia (PNA); to characterize patterns of value in care; and to identify hospital characteristics associated with high-value care (defined by having lower than median RSMRs and RSPs).
Design, setting, and participants: This national cross-sectional study applied weighted linear correlation to investigate the association between hospital RSMRs and RSPs for AMI, HF, and PNA between July 1, 2011, and June 30, 2014, among all hospitals; examined correlations in subgroups of hospitals based on key characteristics; and assessed the proportion and characteristics of hospitals delivering high-value care. The data analysis was completed in October 2017. The setting was acute care hospitals. Participants were Medicare fee-for-service beneficiaries discharged with AMI, HF, or PNA.
Main outcomes and measures: Hospital-level 30-day RSMRs and RSPs for AMI, HF, and PNA.
Results: The AMI sample consisted of 4339 hospitals with 487 141 hospitalizations for mortality and 462 905 hospitalizations for payment. The HF sample included 4641 hospitals with 960 960 hospitalizations for mortality and 903 721 hospitalizations for payment. The PNA sample contained 4685 hospitals with 952 022 hospitalizations for mortality and 901 764 hospitalizations for payment. The median (interquartile range [IQR]) RSMRs and RSPs, respectively, was 14.3% (IQR, 13.8%-14.8%) and $21 620 (IQR, $20 966-$22 567) for AMI, 11.7% (IQR, 11.0%-12.5%) and $15 139 (IQR, $14 310-$16 118) for HF, and 11.5% (IQR, 10.6%-12.6%) and $14 220 (IQR, $13 342-$15 097) for PNA. There were statistically significant but weak inverse correlations between the RSMRs and RSPs of -0.08 (95% CI, -0.11 to -0.05) for AMI, -0.21 (95% CI, -0.24 to -0.18) for HF, and -0.07 (95% CI, -0.09 to -0.04) for PNA. The largest shared variance between the RSMRs and RSPs was only 4.4% (for HF). The correlations between the RSMRs and RSPs did not differ significantly across teaching status, safety-net status, urban/rural status, or the proportion of patients with low socioeconomic status. Approximately 1 in 4 hospitals (20.9% for AMI, 23.0% for HF, and 23.9% for PNA) had both lower than median RSMRs and RSPs.
Conclusions and relevance: These findings suggest that there is significant potential for improvement in the value of AMI, HF, and PNA care and also suggest that high-value care for these conditions is attainable across most hospital types.
Conflict of interest statement
Figures
Comment in
-
Measuring and Improving the Value of Hospital Care.JAMA Netw Open. 2018 Oct 5;1(6):e183517. doi: 10.1001/jamanetworkopen.2018.3517. JAMA Netw Open. 2018. PMID: 30646244 No abstract available.
References
-
- Smith M, Saunders R, Stuckhardt L, McGinnia JM; Committee on the Learning Health Care System in America, Institute of Medicine. Best care at lower cost: the path to continuously learning health care in America. http://www.nationalacademies.org/hmd/Reports/2012/Best-Care-at-Lower-Cos.... Released September 6, 2012. Updated October 19, 2015. Accessed September 14, 2018. - PubMed
-
- Dorsey K, Grady JN, Desai N, et al. Condition-specific measures updates and specifications report hospital-level 30-day risk-standardized mortality measures: acute myocardial infarction–version 10.0, chronic obstructive pulmonary disease–version 5.0, heart failure–version 10.0, pneumonia–version 0.0, stroke–version 5.0. https://www.qualitynet.org/dcs/ContentServer?c=Page&pagename=QnetPublic%.... Published 2016. September 14, 2018.
Publication types
MeSH terms
Grants and funding
LinkOut - more resources
Full Text Sources
Medical
Research Materials
Miscellaneous
