

Evaluation of Amphetamine-Related Hospitalizations and Associated Clinical Outcomes and Costs in the United States
- PMID: 30646256
- PMCID: PMC6324446
- DOI: 10.1001/jamanetworkopen.2018.3758
Evaluation of Amphetamine-Related Hospitalizations and Associated Clinical Outcomes and Costs in the United States
Abstract
Importance: Despite indications of increasing amphetamine availability and psychostimulant deaths in the United States, evidence across data sources is mixed, and data on amphetamine-related hospitalizations are lacking.
Objective: To clarify trends in amphetamine-related hospitalizations and their clinical outcomes and costs in the United States.
Design, setting, and participants: This repeated, cross-sectional study used hospital discharge data from the Healthcare Cost and Utilization Project National Inpatient Sample. The nationally representative sample included US adults (n = 1 292 300) who had amphetamine-related hospitalizations between January 1, 2003, and December 31, 2015. Multivariable logistic and Poisson regression models were used to examine in-hospital mortality and length of stay. Analysis of these data was conducted from November 2017 to August 2018.
Exposure: Amphetamine dependence or abuse or amphetamine poisoning.
Main outcomes and measures: Annual hospitalizations, in-hospital mortality, length of stay, transfer to another facility, and costs.
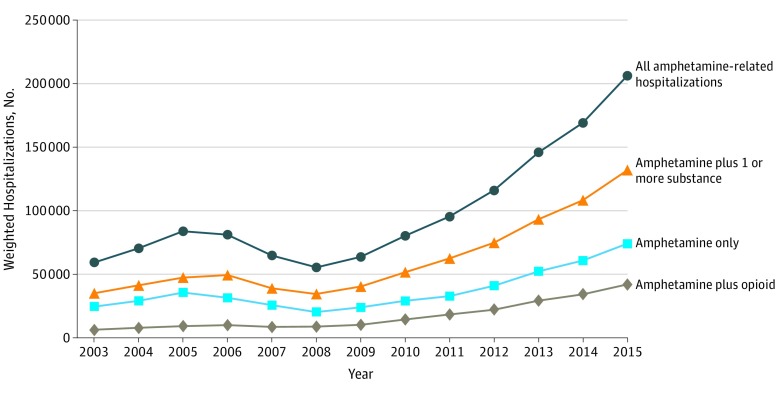
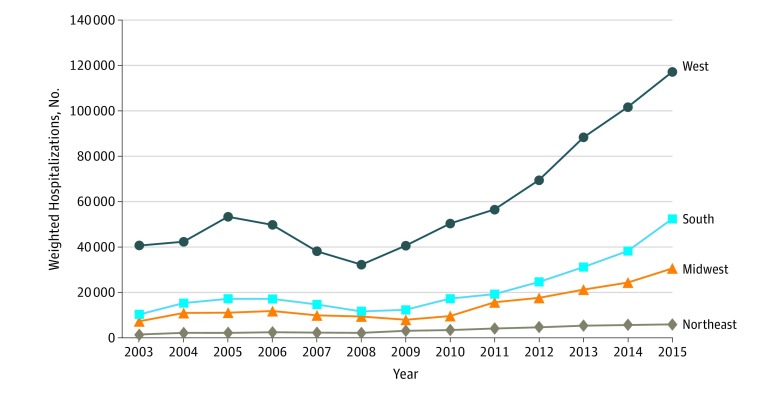
Results: Over the 2003 to 2015 study period, there were 1 292 300 weighted amphetamine-related hospitalizations. Of this population, 541 199 (41.9%) were female and 749 392 (58.1%) were male, with a mean age of 37.5 years (95% CI, 37.4-37.7 years). Amphetamine-related hospitalizations, compared with other hospitalizations, were associated with age younger than 65 years (98.0% vs 58.0%; P < .001), male sex (60.3% [95% CI, 59.7%-60.8%] vs 41.1% [95% CI, 40.9%-41.3%]), Medicaid coverage (51.2% [95% CI, 49.8%-52.7%] vs 17.8% [95% CI, 17.5%-18.1%]), and residence in the western United States (58.5% [95% CI, 55.9%-61.0%] vs 18.9% [95% CI, 18.0%-19.8%]). Amphetamine-related hospitalizations declined between 2005 and 2008, and then increased from 55 447 hospitalizations (95% CI, 44 936-65 959) in 2008 to 206 180 hospitalizations (95% CI, 95% CI, 189 188-223 172) in 2015. Amphetamine-related hospitalizations increased to a greater degree than hospitalizations associated with other substances. Adjusted mean length of stay (5.9 [95% CI, 5.8-6.0] vs 4.7 [95% CI, 4.7-4.8] days; P < .001), transfer to another facility (26.0% [95% CI, 25.3%-26.8%] vs 18.5% [95% CI, 18.3%-18.6%]; P < .001), and mean in-hospital mortality (28.3 [95% CI, 26.2-30.4] vs 21.9 [95% CI, 21.6-22.1] deaths per 1000 hospitalizations; P < .001) were higher for amphetamine-related than other hospitalizations. Annual hospital costs related to amphetamines increased from $436 million (95% CI, $312 million-$559 million) in 2003 to $2.17 billion (95% CI, $1.95 billion-$2.39 billion) by 2015.
Conclusions and relevance: Given that amphetamine-related hospitalizations and costs substantially increased between 2003 and 2015, pharmacologic and nonpharmacologic therapies for amphetamine use disorders and a coordinated public health response are needed to curb these rising rates.
Conflict of interest statement
Figures
References
-
- US Department of Justice Drug Enforcement Administration. 2017 National Drug Threat Assessment Washington, DC: US Department of Justice Drug Enforcement Administration; 2017. https://www.dea.gov/sites/default/files/2018-07/DIR-040-17_2017-NDTA.pdf. Accessed May 10, 2018.
-
- US Department of Justice Drug Enforcement Administration.Drugs of Abuse A DEA Resource Guide. Washington, DC: US Department of Justice Drug Enforcement Administration; 2017. https://www.dea.gov/documents/2017/06/15/drugs-abuse. Accessed May 10, 2018.
-
- Ingold J. More Coloradans died last year from drug overdoses than any year in the state’s history: that shows how the opioid epidemic is changing. Denver Post April 4, 2018. https://www.denverpost.com/2018/04/04/colorado-drug-overdoses-opioid-dea.... Accessed June 6, 2018.
-
- National Admissions to Substance Abuse Treatment Services. Treatment Episode Data Set (TEDS) 2004-2014. Rockville, MD: Substance Abuse and Mental Health Services Administration; 2016. https://wwwdasis.samhsa.gov/dasis2/teds_pubs/2014_teds_rpt_natl.pdf. Accessed May 10, 2018.
Publication types
MeSH terms
Substances
LinkOut - more resources
Full Text Sources
Medical
