

US National Trends in Pediatric Deaths From Prescription and Illicit Opioids, 1999-2016
- PMID: 30646334
- PMCID: PMC6324338
- DOI: 10.1001/jamanetworkopen.2018.6558
US National Trends in Pediatric Deaths From Prescription and Illicit Opioids, 1999-2016
Abstract
Importance: It is not yet known how many children and adolescents die each year from opioid poisonings and how mortality rates have changed over time.
Objective: To examine national trends in pediatric deaths from prescription and illicit opioids.
Design, setting, and participants: Cross-sectional in which serial mortality data from the Centers for Disease Control and Prevention were analyzed. The population included 8986 children and adolescents (age, <20 years) who died in all US settings from opioid poisonings between 1999 and 2016. Data were collected and analyzed between June 1 and October 31, 2018.
Exposures: All opioids.
Main outcomes and measures: Age-specific mortality rates per 100 000 were estimated with smoothing spline Poisson regression.
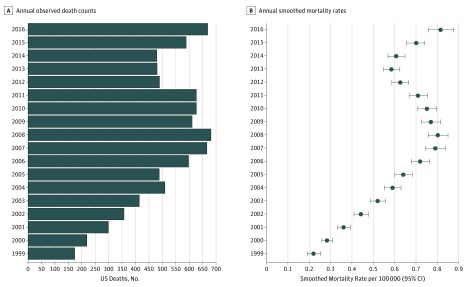
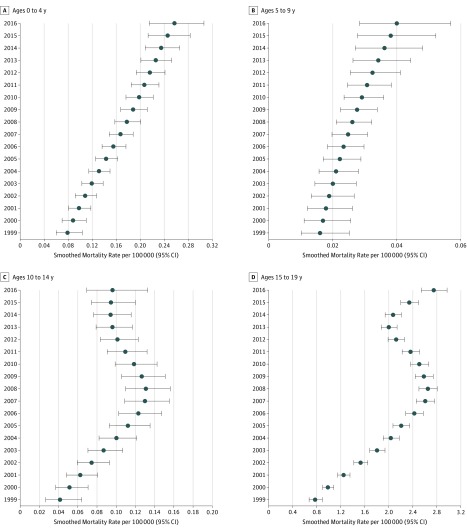
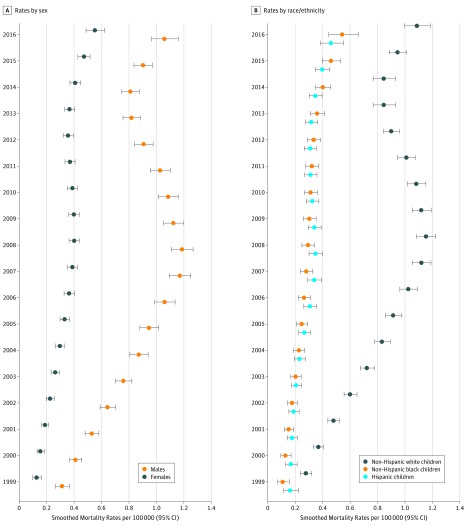
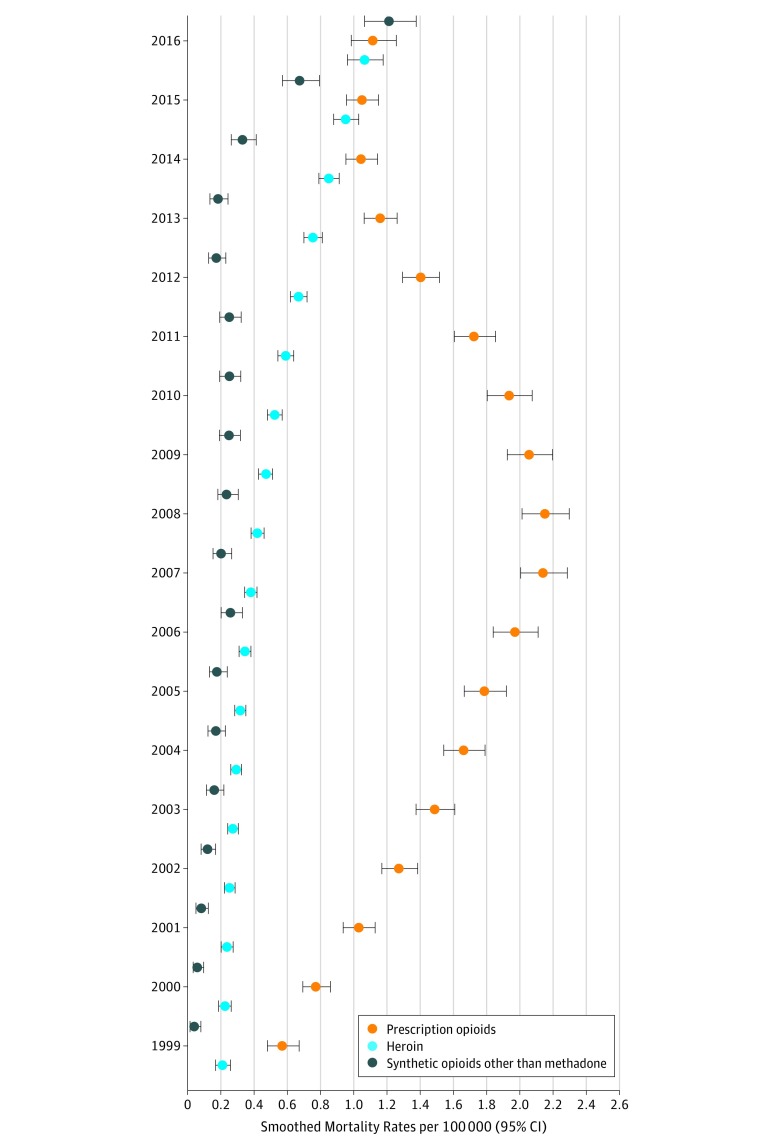
Results: Of the 8986 children and adolescents who died between 1999 and 2016 from prescription and illicit opioid poisonings, 6567 (73.1%) were male, 7921 (88.1%) were among adolescents aged 15 to 19 years, and 605 (6.7%) were among children aged 0 to 4 years. The overall pediatric mortality rate increased from 0.22 (95% CI, 0.19-0.25) to 0.81 (95% CI, 0.76-0.88) per 100 000, an increase of 268.2% (P for time effect <.001). The highest annual rates were among adolescents aged 15 to 19 years, but time trends revealed a steady linear increase among children aged 0 to 4 years and those aged 5 to 9 years as well as a steady linear increase until 2008 among the cohorts aged 10 to 14 years and 15 to 19 years, when rates briefly declined before rising again. Among adolescents aged 15 to 19 years, heroin was implicated in 1872 deaths: rates increased from 0.21 (95% CI, 0.17-0.25) to 1.06 (95% CI, 0.97-1.17), an increase of 404.8%, whereas rates for prescription opioids increased by 94.7% from 0.57 (95% CI, 0.49-0.66) to 1.11 (95% CI, 0.99-1.25) (all P for time effect <.001). Between 2014 and 2016, there were 1508 opioid deaths among adolescents aged 15 to 19 years; of these, 468 (31.0%) were attributed to synthetic opioids. Across time, 7263 (80.8%) of all pediatric deaths were unintentional, 5537 (61.6%) occurred outside of a medical facility, and 3419 (38.0%) children died at home or another residential setting. Among children younger than 5 years, 148 (24.5%) deaths were attributed to homicide.
Conclusions and relevance: Over 18 years, nearly 9000 children and adolescents died from opioid poisonings, and the mortality rate increased nearly 3-fold. These findings suggest that the opioid epidemic is likely to remain a growing public health problem in the young unless legislators, public health officials, clinicians, and parents take a wider view of the opioid crisis and implement protective measures that are pediatric specific and family centered.
Conflict of interest statement
Figures
References
-
- Hedegaard H, Warner M, Miniño AM. Drug overdose deaths in the United States, 1999-2016. NCHS Data Brief. 2017;(294):1-8. - PubMed
-
- Warner M, Trinidad JP, Bastian BA, Minino AM, Hedegaard H. Drugs most frequently involved in drug overdose deaths: United States, 2010-2014. Natl Vital Stat Rep. 2016;65(10):1-15. - PubMed
