

Association of Obesity With Mortality Over 24 Years of Weight History: Findings From the Framingham Heart Study
- PMID: 30646366
- PMCID: PMC6324399
- DOI: 10.1001/jamanetworkopen.2018.4587
Association of Obesity With Mortality Over 24 Years of Weight History: Findings From the Framingham Heart Study
Erratum in
-
Erroneous Word in Methods Section.JAMA Netw Open. 2018 Dec 7;1(8):e186657. doi: 10.1001/jamanetworkopen.2018.6657. JAMA Netw Open. 2018. PMID: 30646270 Free PMC article. No abstract available.
Abstract
Importance: Many studies of the association between obesity and mortality rely on weight status at a single point in time, making it difficult to adequately address bias associated with reverse causality.
Objective: To investigate the association between maximum body mass index (BMI) and all-cause mortality without the consequences of reverse causality.
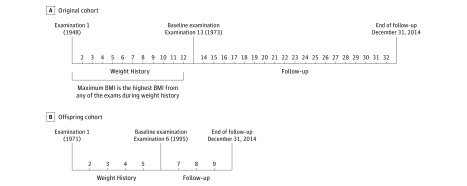
Design, setting, and participants: Prospective cohort studies for the original and offspring cohorts of the Framingham Heart Study. The follow-up period started from baseline examination 13 for the original cohort and from baseline examination 6 for the offspring cohort and ended December 31, 2014. The analyses were conducted in 2017. Participants were 6197 individuals with 3478 deaths during a mean of 17 years of follow-up.
Main outcomes and measures: Maximum BMI over 24 years of weight history before the beginning of follow-up for all-cause mortality and cause-specific mortality. All-cause mortality and cause-specific mortality (deaths due to cardiovascular disease, cancer, or other causes).
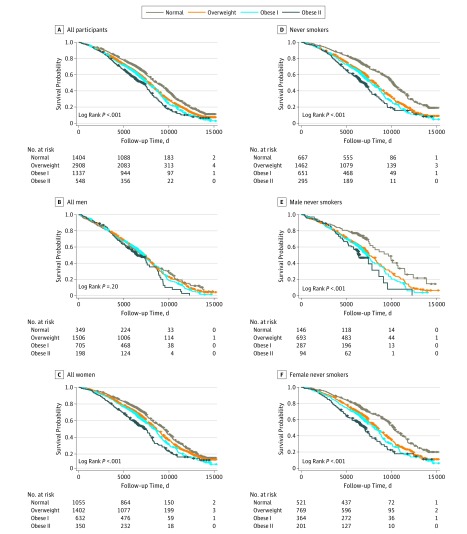
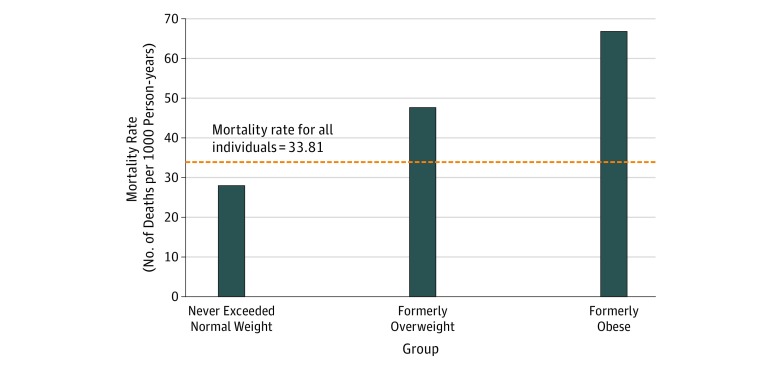
Results: Among 6197 participants (mean [SD] age at baseline, 62.79 [8.98] years; 55.5% female), 3478 (56.1%) died during the follow-up. A monotonic association was observed between maximum BMI and mortality, with increasing risks observed across obese I (BMI of 30 to <35; hazard ratio [HR], 1.27; 95% CI, 1.14-1.41) and obese II (BMI of 35 to <40; HR, 1.93; 95% CI, 1.68-2.20) categories. A significant association was not observed for the overweight category (BMI of 25 to <30; HR, 1.08; 95% CI, 0.99-1.18). Among never smokers, the risks increased, with a significant association emerging for individuals with maximum BMI in the overweight range (HR, 1.31; 95% CI, 1.13-1.51). The mortality rates of normal-weight individuals who were formerly overweight or obese were 47.48 and 66.67 per 1000 person-years, respectively, while individuals who never exceeded normal weight had a mortality rate of 27.93 per 1000 person-years.
Conclusions and relevance: A monotonic association was found between maximum BMI over 24 years of weight history and subsequent all-cause mortality. Maximum BMI in the normal-weight range was associated with the lowest risk of mortality in this cohort, highlighting the importance of obesity prevention.
Conflict of interest statement
Figures
Comment in
-
Long-term Body Mass Index and Mortality in the Framingham Heart Study: Unpacking an Ounce of Prevention.JAMA Netw Open. 2018 Nov 2;1(7):e184585. doi: 10.1001/jamanetworkopen.2018.4585. JAMA Netw Open. 2018. PMID: 30646362 No abstract available.
References
Publication types
MeSH terms
Grants and funding
LinkOut - more resources
Full Text Sources
Medical
