. 2019 Jan 15;12(1):9.
doi: 10.1186/s12920-018-0465-4.

Matrix association region/scaffold attachment region: the crucial player in defining the positions of chromosome breaks mediated by bile acid-induced apoptosis in nasopharyngeal epithelial cells

Affiliations

Matrix association region/scaffold attachment region: the crucial player in defining the positions of chromosome breaks mediated by bile acid-induced apoptosis in nasopharyngeal epithelial cells

Sang-Nee Tan et al. BMC Med Genomics. .

Abstract

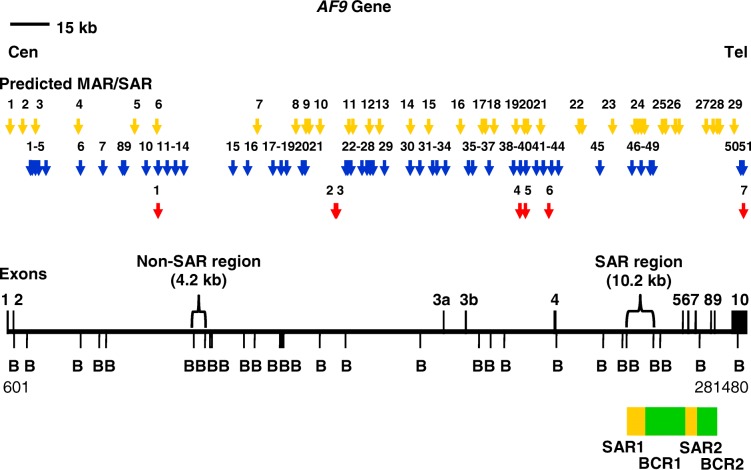
Background: It has been found that chronic rhinosinusitis (CRS) increases the risk of developing nasopharyngeal carcinoma (NPC). CRS can be caused by gastro-oesophageal reflux (GOR) that may reach nasopharynx. The major component of refluxate, bile acid (BA) has been found to be carcinogenic and genotoxic. BA-induced apoptosis has been associated with various cancers. We have previously demonstrated that BA induced apoptosis and gene cleavages in nasopharyngeal epithelial cells. Chromosomal cleavage occurs at the early stage of both apoptosis and chromosome rearrangement. It was suggested that chromosome breaks tend to cluster in the region containing matrix association region/scaffold attachment region (MAR/SAR). This study hypothesised that BA may cause chromosome breaks at MAR/SAR leading to chromosome aberrations in NPC. This study targeted the AF9 gene located at 9p22 because 9p22 is a deletion hotspot in NPC.

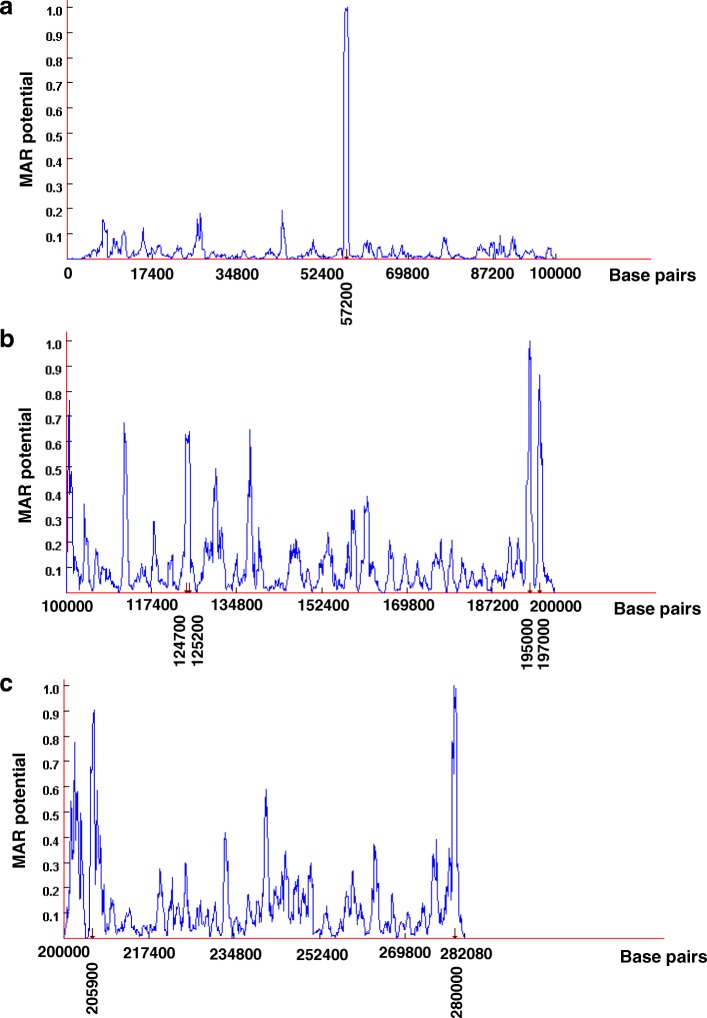
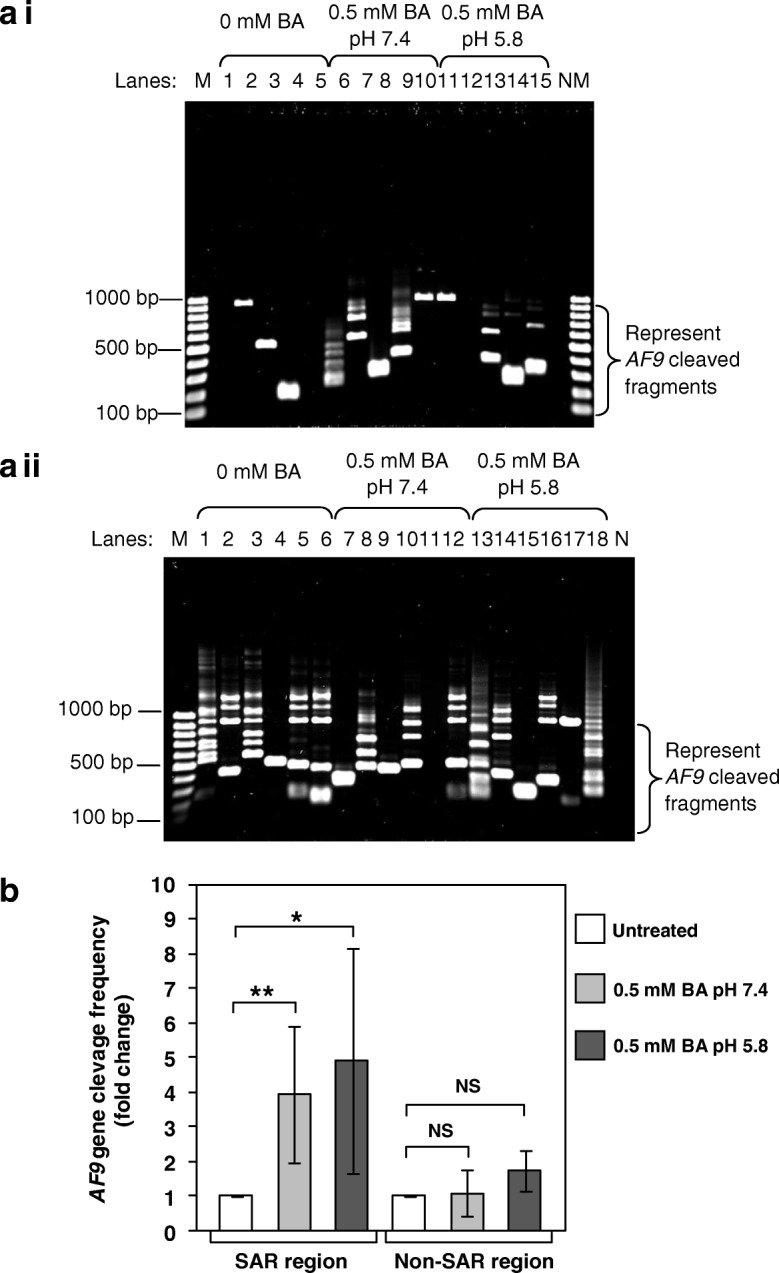
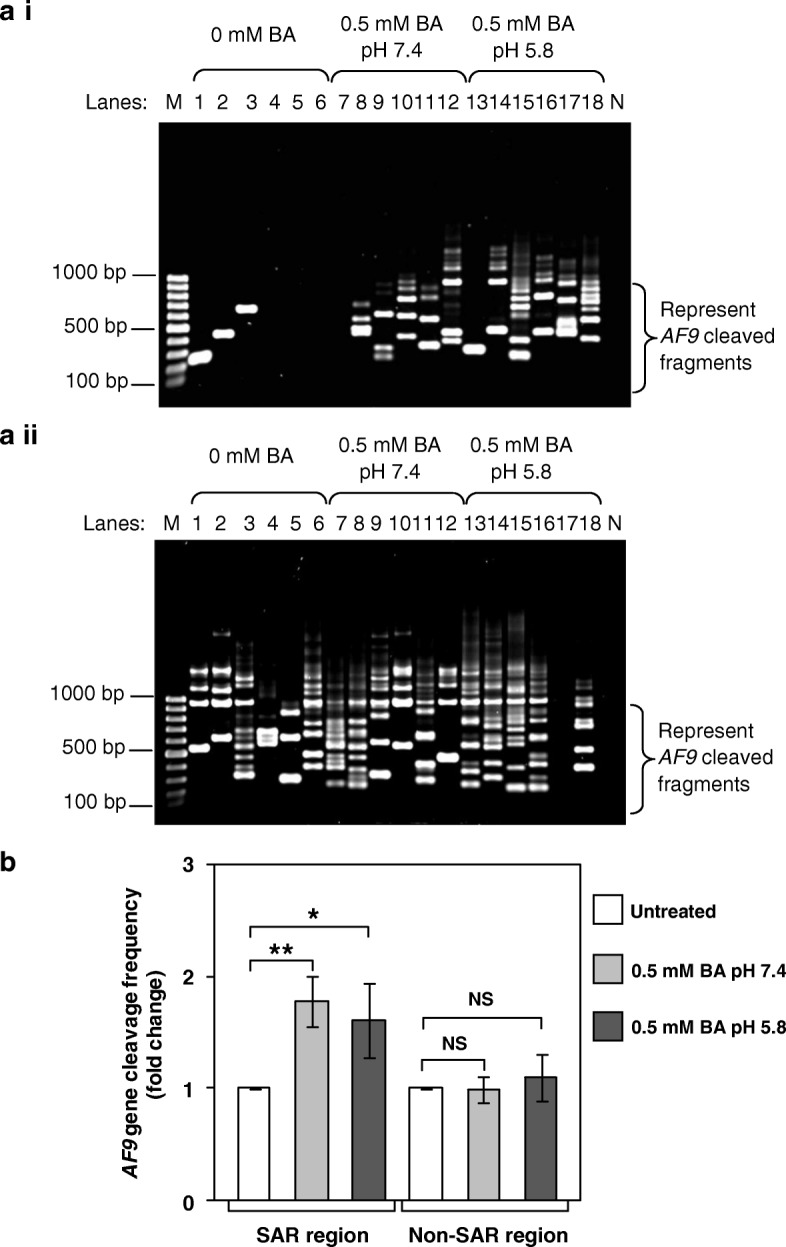
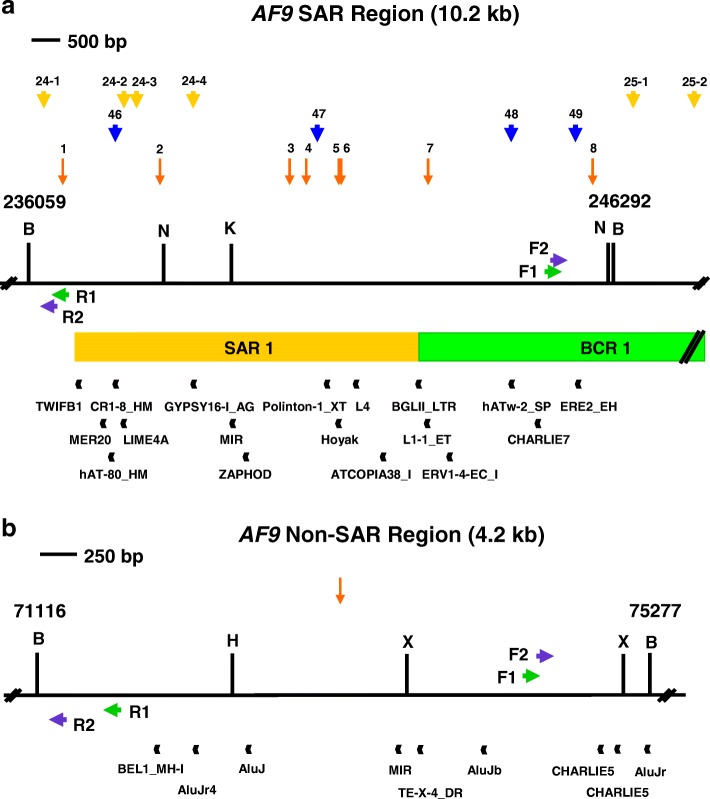
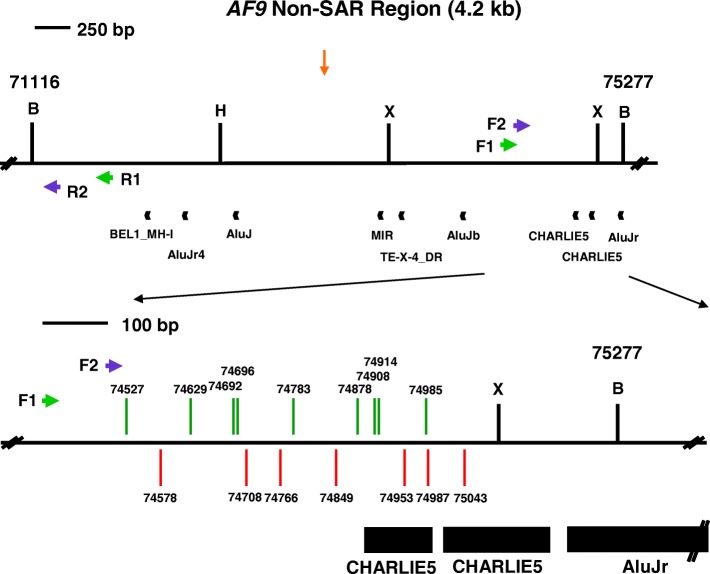
Methods: Potential MAR/SAR sites were predicted in the AF9 gene by using MAR/SAR prediction tools. Normal nasopharyngeal epithelial cells (NP69) and NPC cells (TWO4) were treated with BA at neutral and acidic pH. Inverse-PCR (IPCR) was used to identify chromosome breaks in SAR region (contains MAR/SAR) and non-SAR region (does not contain MAR/SAR). To map the chromosomal breakpoints within the AF9 SAR and non-SAR regions, DNA sequencing was performed.

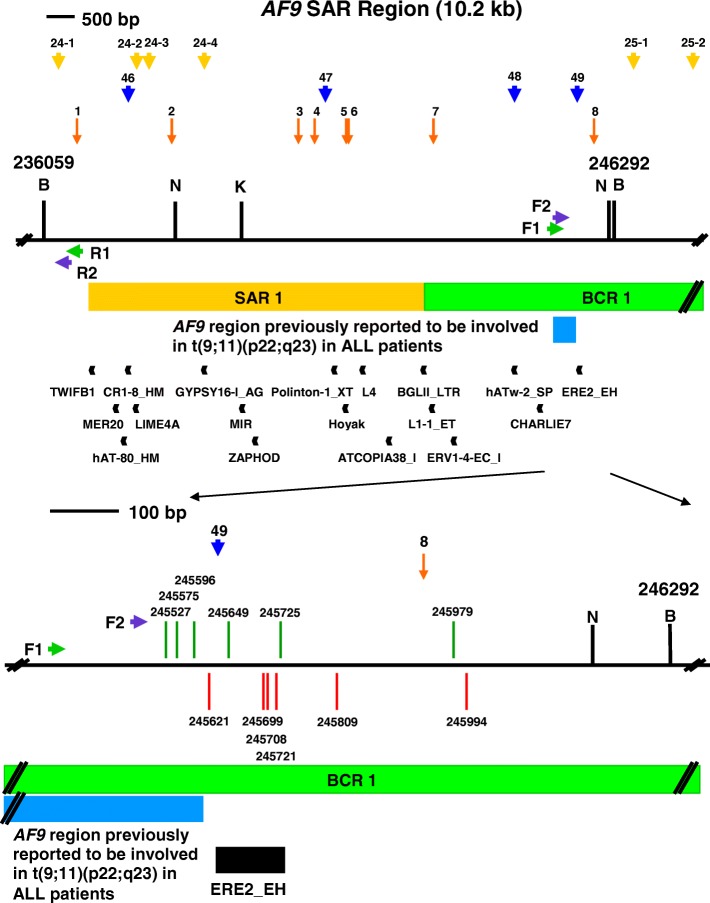
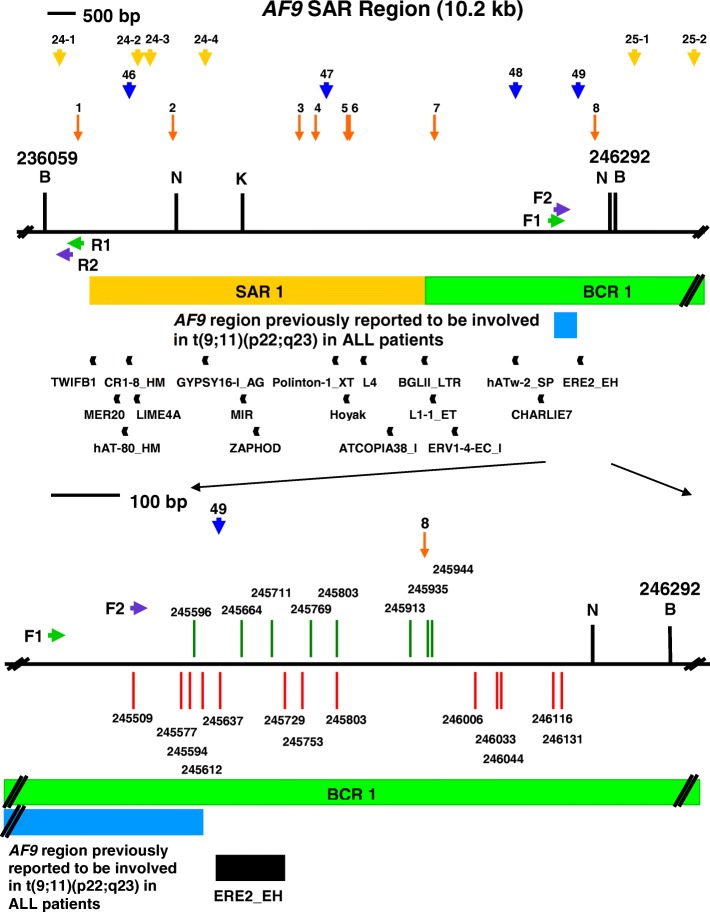
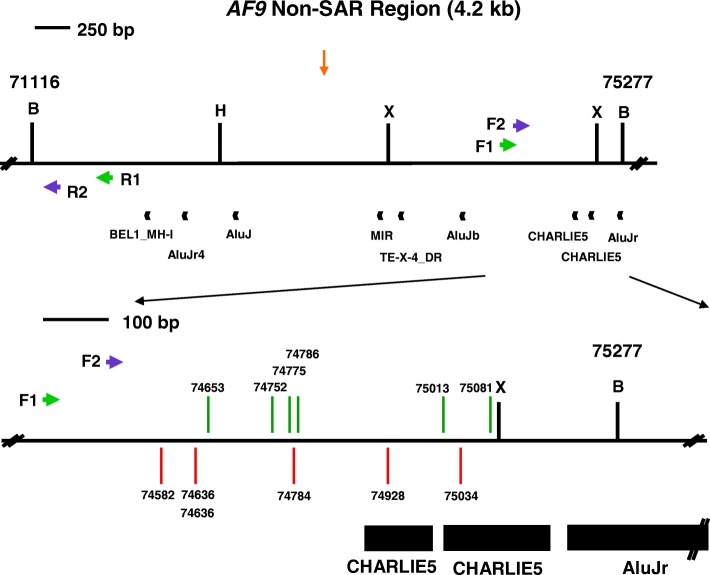
Results: In the AF9 SAR region, the gene cleavage frequencies of BA-treated NP69 and TWO4 cells were significantly higher than those of untreated control. As for the AF9 non-SAR region, no significant difference in cleavage frequency was detected between untreated and BA-treated cells. A few breakpoints detected in the SAR region were mapped within the AF9 region that was previously reported to translocate with the mixed lineage leukaemia (MLL) gene in an acute lymphoblastic leukaemia (ALL) patient.

Conclusions: Our findings suggest that MAR/SAR may be involved in defining the positions of chromosomal breakages induced by BA. Our report here, for the first time, unravelled the relation of these BA-induced chromosomal breakages to the AF9 chromatin structure.

Keywords: AF9; Apoptosis; Bile acid; Chronic rhinosinusitis; Gastro-oesophageal reflux; Matrix association region/scaffold attachment region; Nasopharyngeal carcinoma.


Conflict of interest statement

Ethics approval and consent to participate

Not applicable.

Consent for publication

Not applicable.

Competing interests

The authors declare that they have no competing interests.

Publisher’s Note

Springer Nature remains neutral with regard to jurisdictional claims in published maps and institutional affiliations.

Figures

Fig. 1
Fig. 1
Potential MAR/SAR sites within the AF9 gene. The AF9 genomic map from nucleotide positions 601–281,480 is depicted [EMBL:ENSG00000171843]. The locations of exons 1 to 10 and BamH I (B) restriction sites are shown. Green boxes represent the two previously identified patient BCRs which were indicated as BCR1 and BCR2 [88]. Yellow boxes represent the two experimentally verified MAR/SARs (denominated as SAR1 and SAR2) reported in the previous study [88]. Yellow, blue and red arrows represent the potential MAR/SAR sites predicted in our present study by using MRS, SMARTest and MAR-Finder, respectively. Based on the previous reports and the in silico prediction in the present study, a SAR region (contains MAR/SAR) and a non-SAR region (does not contain MAR/SAR) were determined to be the regions of study
Fig. 2
Fig. 2
MAR-Finder predictions within the AF9 gene. (a) Coordinates 0–100,000 (b) Coordinates 100,000–200,000 (c) Coordinates 200,000–282,080 [Ensembl:ENSG00000171843]. There were seven MAR/SARs predicted within the AF9 gene. These seven potential MAR/SARs locate at 57200 (a), 124,700, 125,200, 195,000, 197,000 (b), 205,900 and 280,000 (c)
Fig. 3
Fig. 3
Identification of chromosome breaks in BA-treated NP69 cells. IPCR was employed to identify the AF9 gene cleavages in NP69 cells after exposed to BA. a Representative gel picture showing the AF9 gene cleavages identified by IPCR within: (a i) SAR region (a ii) Non-SAR region. NP69 cells were left untreated (a i, Lanes 1–5; a ii, Lanes 1–6) or treated for 1 h with 0.5 mM of BA at pH 7.4 (a i, Lanes 6–10; a ii, Lanes 7–12) and pH 5.8 (a i, Lanes 11–15; a ii, Lanes 13–18). Genomic DNA extraction and nested IPCR were performed as described in “Methods” section. The side bracket represents the IPCR bands derived from the AF9 cleaved fragments. M: 100 bp DNA marker. N: negative control for IPCR. b The average number of the AF9 gene cleavages identified in BA-treated NP69 cells. Data are expressed as means and SDs of two independent experiments. Each experiment consisted of two to four sets of IPCR carried out in three to six replicates per set for each cell sample. Values are expressed as fold change normalised to the value of the untreated control. The differences between untreated control and treated groups were compared by using Student’s t test, * p < 0.05, ** p < 0.01. NS, no significant difference
Fig. 4
Fig. 4
Identification of chromosome breaks in BA-treated TWO4 cells. Genomic DNA was extracted from BA-treated TWO4 cells for nested IPCR as described in “Methods” section. a Representative gel picture showing the AF9 gene cleavages in BA-treated TWO4 cells detected within: (a i) SAR region (a ii) Non-SAR region. TWO4 cells were left untreated (Lanes 1–6) or treated for 3 h with 0.5 mM of BA at pH 7.4 (Lanes 7–12) and pH 5.8 (Lanes 13–18). The IPCR bands derived from the AF9 cleaved fragments were indicated by the side bracket. M: 100 bp DNA ladder. N: Negative control for IPCR. b The average number of AF9 gene cleavages detected by IPCR. Data represents means and SDs of three independent experiments. Each experiment consisted of at least two sets of IPCR assays performed in five to six replicates per set for each cell sample. Values are expressed as fold change normalised to the value of the untreated control. The differences between untreated control and treated groups were compared by using Student’s t test, * p < 0.05, ** p < 0.01. NS, no significant difference
Fig. 5
Fig. 5
The repeats and topo II sites identified within the SAR and non-SAR regions. a The SAR region. The SAR region that is bordered by the two BamH I sites is 10.2 kb in length (from coordinates 236,059 to 246,292). Green box represents the previously identified patient BCR which is indicated as BCR1. Yellow box shows the previously experimentally isolated MAR/SAR which is indicated as SAR1 [88]. Yellow and blue arrows represent the potential MAR/SARs predicted in this study by using MRS and SMARTest, respectively. Orange arrows represent the predicted topo II consensus sites. Green arrows represent the primers (R1, AF9 236,451 R and F1, AF9 245,385 F) used in the first round of nested IPCR while the purple arrows represent the primers (R2, AF9 236,211 R and F2, AF9 245,507 F) used in the second round of nested IPCR. Black boxes represent the repeat elements. BamH I (B), Kpn I (K) and Nde I (N) restriction sites are shown. b The non-SAR region. The non-SAR region which is bordered by two BamH I sites is 4.2 kb in length (from coordinates 71,116 to 75,277). Orange arrow represents the predicted topo II consensus site. Green arrows represent the primers (R1, AF9 71,653 R and F1, AF9 74,399 F) used in the first round of nested IPCR while the blue arrows represent the primers (R2, AF9 71,282 R and F2, AF9 74,494 F) used in the second round of nested IPCR. Black boxes represent the repeat elements. BamH I (B), Hind III (H) and Xba I (X) restriction sites are shown
Fig. 6
Fig. 6
Positions of chromosome breaks within the SAR region in BA-treated NP69 cells. The genomic map of AF9 SAR region from nucleotide positions 236,059–246,292 is illustrated above [EMBL:ENSG00000171843]. BamH I (B), Kpn I (K) and Nde I (N) restriction sites are shown. Green arrows represent the primers (R1, AF9 236,451 R and F1, AF9 245,385 F) used in the first round of nested IPCR while the blue arrows represent the primers (R2, AF9 236,211 R and F2, AF9 245,507 F) used in the second round of nested IPCR. Green box represents the previously reported patient BCR which is indicated as BCR1 [88]. Yellow box shows the experimentally determined MAR/SAR which is indicated as SAR1 [88]. Yellow arrows represent the potential MAR/SARs predicted in this study. Blue box represents the AF9 region (at coordinates 245,252–245,612) previously reported to translocate with the MLL gene resulting in the MLL-AF9 fusion gene identified in an ALL patient [GenBank:AM050804]. Black boxes represent repeat elements. Red and green vertical lines represent the presently detected breakpoints in TWO4 cells treated with BA at neutral and acidic pH, respectively. All the chromosome breaks were mapped within BCR1 in close proximity to SAR1. Three chromosome breaks (at coordinates 245,527, 245,575 and 245,596) fall within the AF9 region previously reported to be involved in t(9;11)(p22;q23) in the ALL patient. Five chromosome breaks (at coordinates 245,649, 245,699, 245,708, 245,721 and 245,725) fall within a repeat ERE2_EH (at coordinates 245,627–245,728)
Fig. 7
Fig. 7
Positions of chromosome breaks within the SAR region in BA-treated TWO4 cells. The genomic map of AF9 SAR region from nucleotide positions 236,059–246,292 is illustrated above [EMBL:ENSG00000171843]. BamH I (B), Kpn I (K) and Nde I (N) restriction sites are shown. Green arrows represent the primers (R1, AF9 236,451 R and F1, AF9 245,385 F) used in the first round of nested IPCR while the blue arrows represent the primers (R2, AF9 236,211 R and F2, AF9 245,507 F) used in the second round of nested IPCR. Green box represents the previously reported patient BCR which is indicated as BCR1 [88]. Yellow box shows the experimentally determined MAR/SAR which is indicated as SAR1 [88]. Yellow arrows represent the potential MAR/SARs predicted in this study. Blue box represents the AF9 region (at coordinates 245,252–245,612) previously reported to translocate with the MLL gene resulting in the MLL-AF9 fusion gene identified in an ALL patient [GenBank:AM050804]. Black boxes represent repeat elements. Red and green vertical lines represent the presently detected breakpoints in TWO4 cells treated with BA at neutral and acidic pH, respectively. All the chromosome breaks were mapped within BCR1 in close proximity to SAR1. Five chromosome breaks (at coordinates 245,509, 245,577, 245,594, 245,596 and 245,612) fall within the AF9 region previously reported to be involved in t(9;11)(p22;q23) in the ALL patient. One of those breakpoints is identical with that previously identified in the ALL patient (at coordinate 245,612) [GenBank:AM050804]. Three chromosome breaks (at coordinates 245,637, 245,664 and 245,711) fall within a repeat ERE2_EH (at coordinates 245,627–245,728). Two chromosome breaks fall at the same nucleotide position (at coordinate 245,803)
Fig. 8
Fig. 8
Positions of chromosome breaks within the non-SAR region in BA-treated NP69 cells. The genomic map of AF9 non-SAR region from nucleotide positions 71,116–75,277 is illustrated above [EMBL: ENSG00000171843]. BamH I (B), Hind III (H) and Xba I (X) restriction sites are shown. Green arrows represent the primers (R1, AF9 71,653 R and F1, AF9 74,399 F) used in the first round of nested IPCR while blue arrows represent the primers (R2, AF9 71,282 R and F2, AF9 74,494 F) used in the second round of nested IPCR. Black boxes represent the repeat elements. Red and green vertical lines represent the presently identified breakpoints in NP69 cells upon BA treatment at neutral and acidic pH, respectively. One chromosome break (at coordinate 74,928) falls within the first repeat CHARLIE5 (at coordinates 74,895–74,998). Three chromosome breaks (at coordinates 75,013, 75,034 and 75,081) fall within the second repeat CHARLIE5 (at coordinates 75,006–75,169). Two chromosome breaks fall at the same nucleotide position (at coordinate 74,636)
Fig. 9
Fig. 9
Positions of chromosome breaks within the non-SAR region in BA-treated TWO4 cells. The genomic map of AF9 non-SAR region from nucleotide positions 71,116–75,277 is illustrated above [EMBL: ENSG00000171843]. BamH I (B), Hind III (H) and Xba I (X) restriction sites are shown. Green arrows represent the primers (R1, AF9 71,653 R and F1, AF9 74,399 F) used in the first round of nested IPCR while blue arrows represent the primers (R2, AF9 71,282 R and F2, AF9 74,494 F) used in the second round of nested IPCR. Black boxes represent the repeat elements. Red and green vertical lines represent the presently detected breakpoints in TWO4 cells upon BA treatment at neutral and acidic pH, respectively. Five chromosome breaks (at coordinates 74,908, 74,914, 74,953, 74,985 and 74,987) fall within the first repeat CHARLIE5 (at coordinates 74,895–74,998). One chromosome break (at coordinate 75,043) falls within the second repeat CHARLIE5 (at coordinates 75,006–75,169)

Similar articles

References

    1. Lo KW, Teo PM, Hui AB, To KF, Tsang YS, Chan SY, et al. High resolution allelotype of microdissected primary nasopharyngeal carcinoma. Cancer Res. 2000;60:3348–3353. - PubMed
    1. Luo Z, Zhang L, Li Z, Li X, Li G, Yu H, et al. An in silico analysis of dynamic changes in microRNA expression profiles in stepwise development of nasopharyngeal carcinoma. BMC Med Genet. 2012;5:3. - PMC - PubMed
    1. Sriamporn S, Vatanasapt V, Pisani P, Yongchaiyudha S, Rungpitarangsri V. Environmental risk factors for nasopharyngeal carcinoma: a case-control study in northeastern Thailand. Cancer Epidemiol Biomark Prev. 1992;1:345–348. - PubMed
    1. Henle G, Henle W. Epstein-Barr virus-specific IgA serum antibodies as an outstanding feature of nasopharyngeal carcinoma. Int J Cancer. 1976;17:1–7. doi: 10.1002/ijc.2910170102. - DOI - PubMed
    1. Raab-Traub N. Epstein-Barr virus and nasopharyngeal carcinoma. Semin Cancer Biol. 1992;3:297–307. - PubMed

Publication types

Substances