. 2019 Jan 15;7(1):10.
doi: 10.1186/s40425-018-0485-9.

Tumor microenvironment modulation enhances immunologic benefit of chemoradiotherapy

Affiliations

Tumor microenvironment modulation enhances immunologic benefit of chemoradiotherapy

Aurelie Hanoteau et al. J Immunother Cancer. .

Erratum in

Abstract

Background: Chemoradiotherapy (CRT) remains one of the most common cancer treatment modalities, and recent data suggest that CRT is maximally effective when there is generation of an anti-tumoral immune response. However, CRT has also been shown to promote immunosuppressive mechanisms which must be blocked or reversed to maximize its immune stimulating effects.

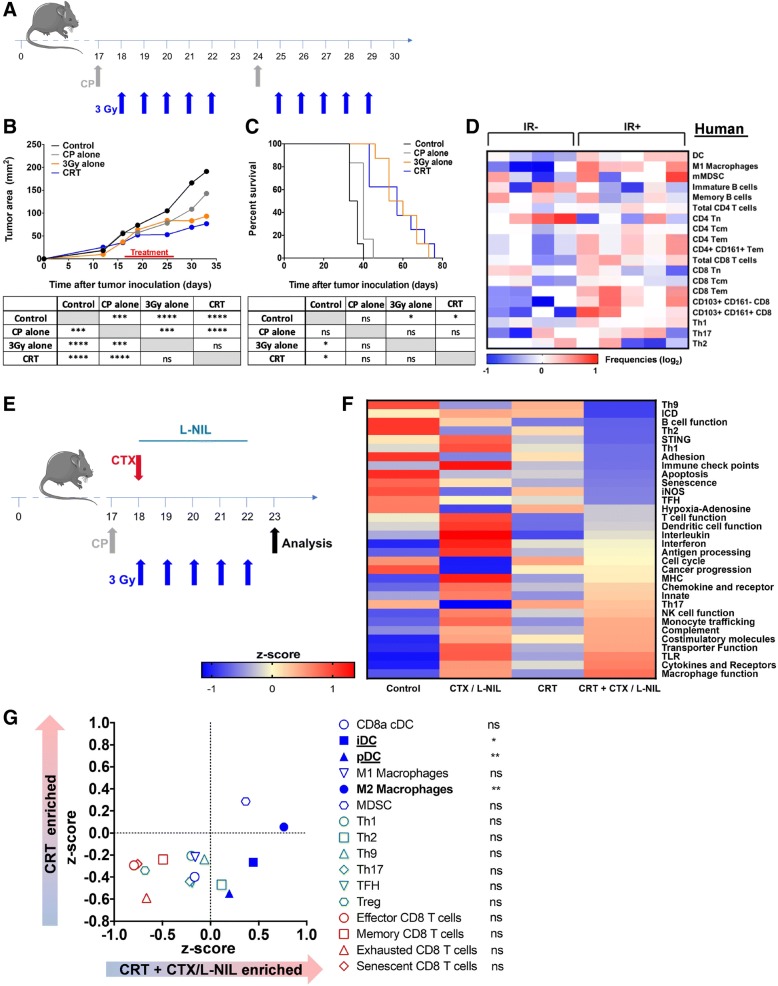
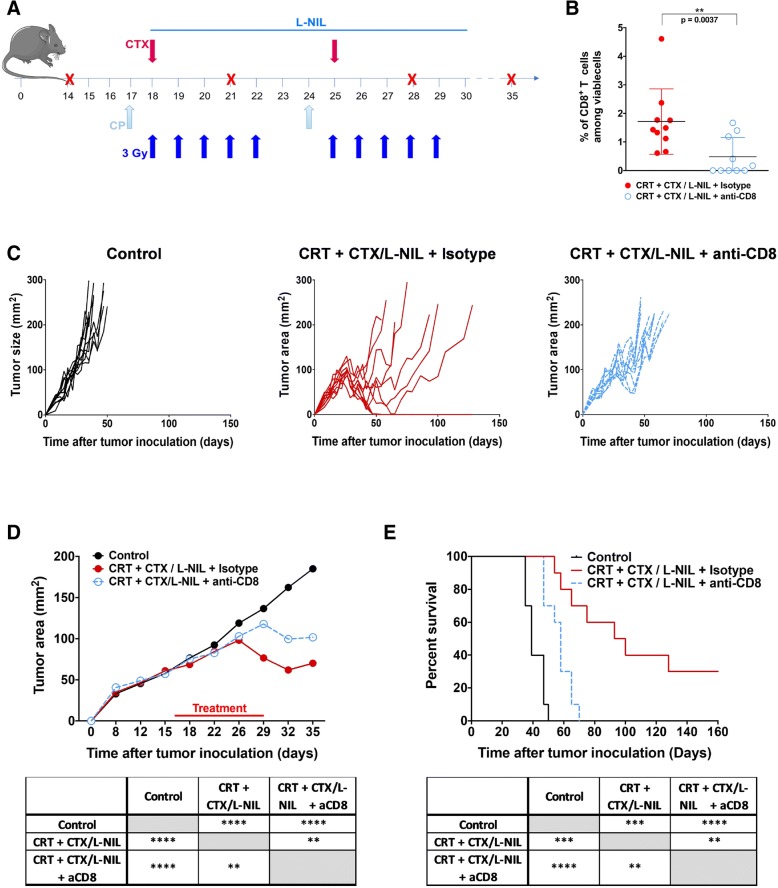
Methods: Therefore, using a preclinical model of human papillomavirus (HPV)-associated head and neck squamous cell carcinoma (HNSCC), we developed a clinically relevant therapy combining CRT and two existing immunomodulatory drugs: cyclophosphamide (CTX) and the small molecule inducible nitric oxide synthase (iNOS) inhibitor L-n6-(1-iminoethyl)-lysine (L-NIL). In this model, we treated the syngeneic HPV-HNSCC mEER tumor-bearing mice with fractionated (10 fractions of 3 Gy) tumor-directed radiation and weekly cisplatin administration. We compared the immune responses induced by CRT and those induced by combinatory treatment (CRT + CTX/L-NIL) with flow cytometry, quantitative multiplex immunofluorescence and by profiling immune-related gene expression changes.

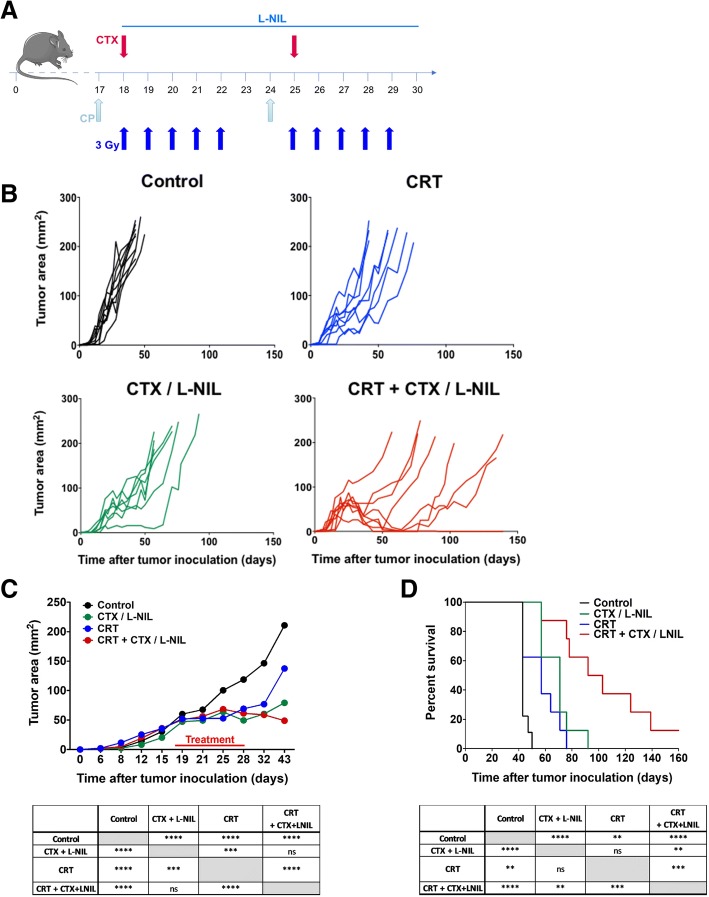
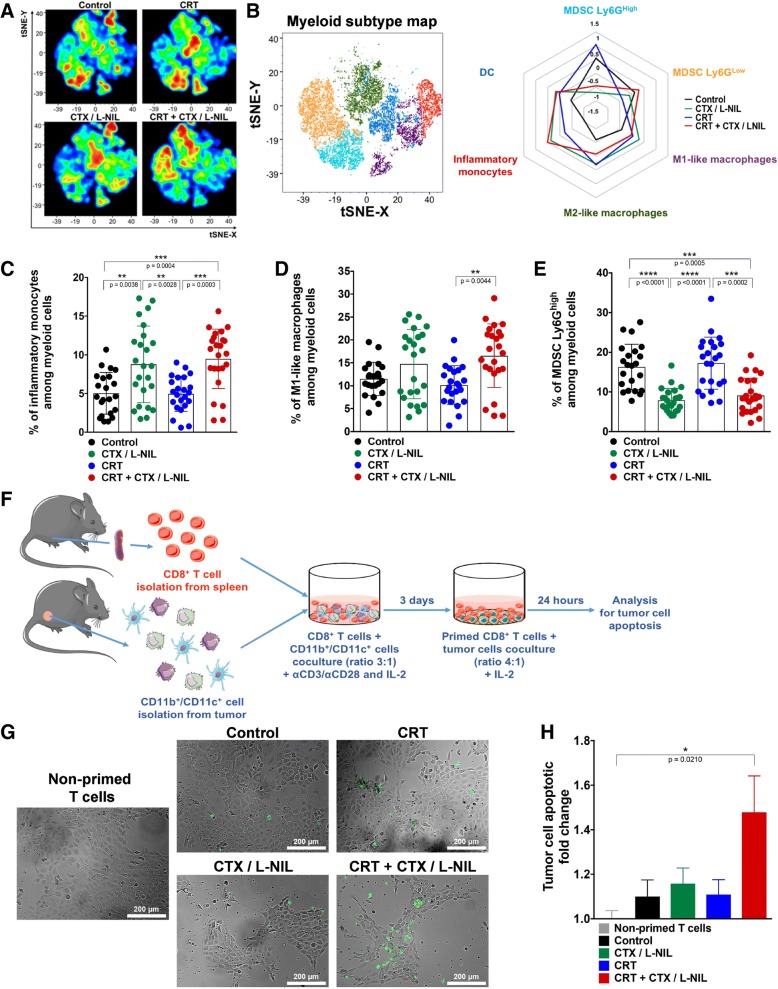
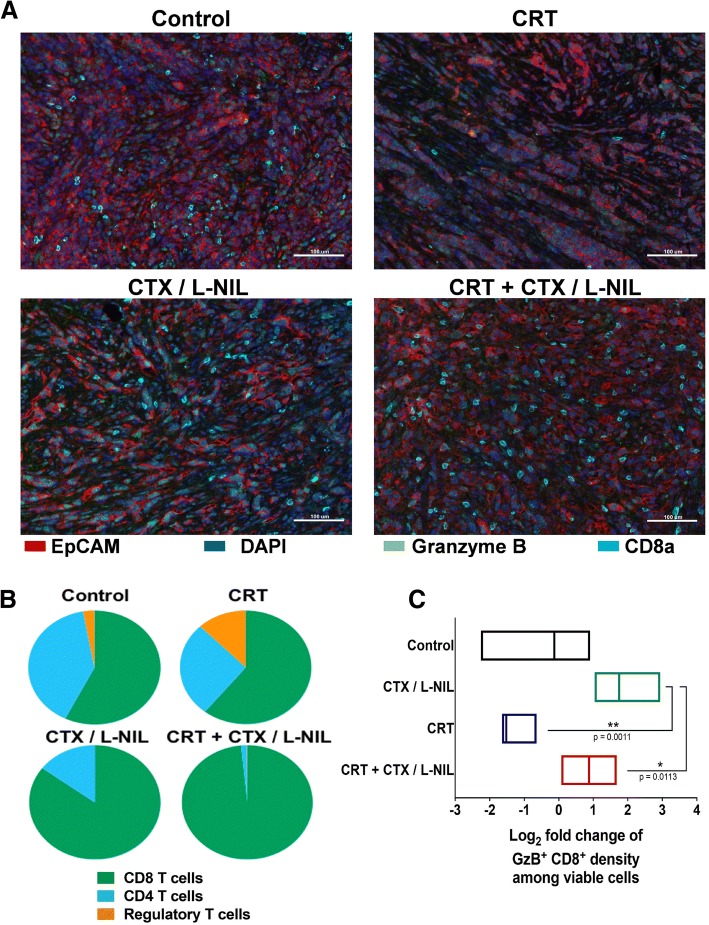
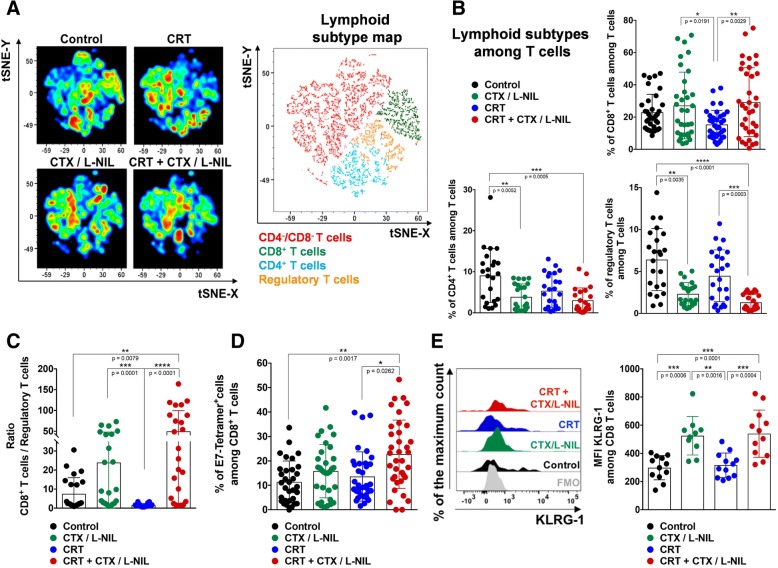
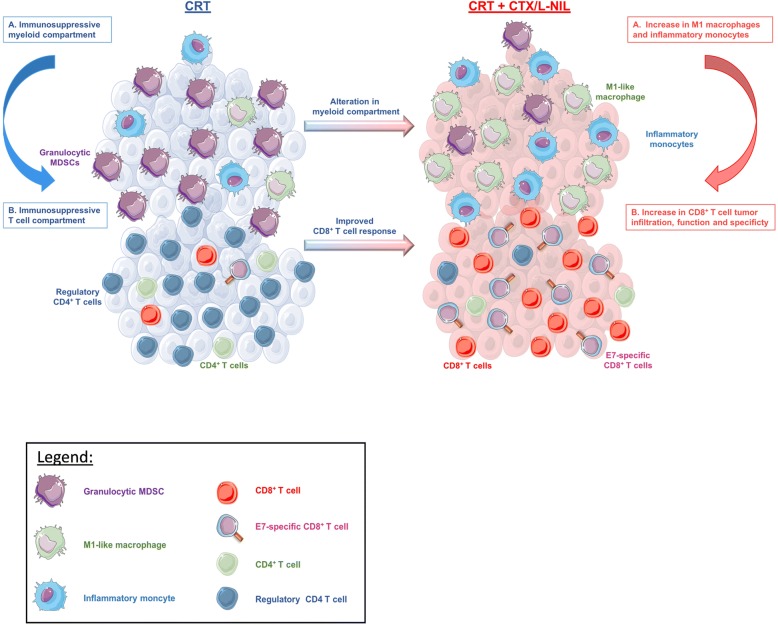
Results: We show that combination treatment favorably remodels the tumor myeloid immune microenvironment including an increase in anti-tumor immune cell types (inflammatory monocytes and M1-like macrophages) and a decrease in immunosuppressive granulocytic myeloid-derived suppressor cells (MDSCs). Intratumoral T cell infiltration and tumor antigen specificity of T cells were also improved, including a 31.8-fold increase in the CD8+ T cell/ regulatory T cell ratio and a significant increase in tumor antigen-specific CD8+ T cells compared to CRT alone. CTX/LNIL immunomodulation was also shown to significantly improve CRT efficacy, leading to rejection of 21% established tumors in a CD8-dependent manner.

Conclusions: Overall, these data show that modulation of the tumor immune microenvironment with CTX/L-NIL enhances susceptibility of treatment-refractory tumors to CRT. The combination of tumor immune microenvironment modulation with CRT constitutes a translationally relevant approach to enhance CRT efficacy through enhanced immune activation.

Keywords: Chemoradiotherapy; Cyclophosphamide; Head and neck cancer; Head and neck squamous cell carcinoma; Human papillomavirus (HPV); Immunotherapy; Inducible nitric oxide synthase (iNOS); L-n6-(1-iminoethyl)-lysine (L-NIL); Radiotherapy; Tumor microenvironment.


Conflict of interest statement

Ethics approval and consent to participate

All mice were housed and treated in accordance with Institutional Animal Care and Use Committee guidelines at Baylor College of Medicine. Patients were involved after signing informed consent and studies were conducted in accordance with the Declaration of Helsinki and approved by the local medical ethical committee of the Leiden University Medical Center (LUMC) and in agreement with the Dutch law.

Consent for publication

Not applicable.

Competing interests

R.D.G. has received travel support from PerkinElmer. A.G.S. receives support in the form of investigational drug from Advaxis for an investigator-initiated clinical trial.

Publisher’s Note

Springer Nature remains neutral with regard to jurisdictional claims in published maps and institutional affiliations.

Figures

Fig. 1
Fig. 1
CTX / L-NIL reverses the unfavorable immune microenvironment of CRT treated tumors. a-c Subcutaneous established mEER tumors (day 17–18 post tumor cell injection) were treated with tumor-directed radiation (5 X 3Gy) and/or weekly cisplatin (83 μg/mouse) i.p. injections, according to the schedule in (a); mice were euthanized when tumors reached 225 mm2. b Average tumor area (top) and statistical comparison of tumor sizes at time of first euthanasia (bottom; Tukey’s multiple comparison test). c Survival curves (top) and statistical comparison between treatments (bottom; Log-rank test); (b and c; N = 1 representative of 2; n = 6–8/group). d Heatmap depicting the relative abundance of various immune cell populations from CyTOF analysis in HPV16 immune reactive (IR+) and non-reactive (IR-) OPSCC human tumors based on the presence of HPV16-specific tumor infiltrating lymphocytes (TIL). Frequencies of DC (CD14-HLADR+CD11c+), M1 macrophages (CD163CD14+HLA-DR+), monocytic MDCS (mMDSC; CD14+HLADR), immature B cells (IgM+CD38+CD20+), memory B cells (IgMCD38CD20+), total CD4 and CD8+ T cells, naïve (Tn; CD45RA+CCR7+), central memory (Tcm; CD45RACCR7+) and effector memory (Tem; CD45RACCR7) CD4+ and CD8+ T cells, CD4+CD161+ Tem, CD103+CD161 and CD103+CD161+ CD8+ T cells. Th-denotation in indicates amount of IFNγ (Th1), IL-5 (Th2) and IL-17A (Th17) produced by the total TIL culture upon phytohemagglutinin stimulation. All data depicted as log-transformed values (base 2) relative to the median for each individual parameter and each column represents an individual patient (n = 9 total patients). e-f Established mEER tumors were treated with CRT and/or CTX/L-NIL immunomodulation (CTX at 2 mg/mouse i.p. and L-NIL at 0.2% in drinking water) and total tumor RNA was extracted and processed for gene expression analysis after 1 week of treatment, according to schedule in (e). f Heatmap of differential immune gene-set pathway enrichment represented as z-scores between treatment groups (See Additional file 1: Table S3 for immune pathway gene list). g Gene-set based immune cell type enrichment comparing CRT and CRT + CTX/L-NIL represented as z-scores (left; See Additional file 1: Table S4 for immune cell type gene list) and statistical comparison for each immune cell type (right; unpaired t test); (e and f; N = 1; n = 9/group). *p < 0.05; **p < 0.01; ***p < 0.001; ****p < 0.0001; ns, not significant
Fig. 2
Fig. 2
CTX/L-NIL combines with CRT to induce durable control of established tumors. Mice bearing established mEER tumors were treated with CRT (10 X 3Gy tumor-directed radiation and 83 μg/mouse weekly cisplatin i.p.) and/or CTX/L-NIL immunomodulation (CTX at 2 mg/mouse i.p. and L-NIL at 0.2% in drinking water) according to the schedule in (a); mice were euthanized when tumors reached 225 mm2. b Individual tumor growth curves shown by treatment group, with each mouse represented as a single line. c Average tumor area (top) and statistical comparison at time of first euthanasia (bottom; Tukey’s multiple comparison test). d Survival curves (top) and statistical comparison between treatments (bottom; Log-rank test). (b-d; N = 1 representative of 2; n = 8–9/group). **p < 0.01; ***p < 0.001; ****p < 0.0001; ns, not significant
Fig. 3
Fig. 3
CRT + CTX/L-NIL reprograms the myeloid tumor microenvironment. Established mEER tumors were treated with CRT and/or CTX/L-NIL and harvested after the first week of treatment, as shown in to Fig. 1e, and tumor myeloid cell infiltrate was analyzed using flow cytometry (a-e; see Additional file 1: Figure S4 for myeloid flow cytometry gating strategy) and ex vivo co-culture (f-h). a Myeloid-focused tSNE (among CD11b+/CD11c+ cells) from flow cytometry data for each treatment group. b Corresponding tSNE color-map (left) and radar plot (right) showing myeloid sub-type alterations between each treatment group as z-scores (myeloid sub-type color in radar plot corresponds with their color in tSNE map; N = 1 representative of 3; n = 8–9/group). c-e Percentage of myeloid sub-types among total myeloid cell tumor infiltrate (CD11b+/CD11c+), including inflammatory monocytes (c), M1-like macrophages (d), and granulocytic MDSCs (e) (N = 3; n = 23–25/group; Tukey’s multiple comparison test for inflammatory monocytes and Dunn’s multiple comparison test for M1-like macrophages and granulocytic MDSCs). f Experimental schematic used to test treatment-induced myeloid influence on CD8+ T cell cytotoxicity. Naïve splenic CD8+ T cells were stimulated with anti-CD3/CD28 antibodies and IL-2 in the absence or presence of myeloid cells (CD11b+ and CD11c+ cells) isolated from tumors that received different treatments for 3 days and then co-cocultured with mEER cells in presence of IL-2. After 24 h, apoptotic tumor cells were detected by Annexin V/ PI staining. g Representative images of mEER tumor cells stained for Annexin V (shown in green) following co-culture (scale bars show 200 μm). h mEER tumor cell apoptotic fold change (Annexin V+ / PI) normalized to non-primed T cells (T cells not co-cultured with myeloid cells) (N = 4; n = 20–26/group; Dunn’s multiple comparison test). All bar graphs show mean +/− SD and each dot represents an individual mouse. *p < 0.05; **p < 0.01; ***p < 0.001; ****p < 0.0001
Fig. 4
Fig. 4
CRT + CTX/L-NIL promotes intratumoral CD8+ T cell infiltration and activation. Established mEER tumors were treated with CRT and/or CTX/L-NIL and harvested after the first week of treatment, as shown in Fig. 1e, and tumor lymphocyte infiltrate was analyzed using quantitative multiplex immunofluorescence (qmIF; a-c). a Representative multiplex images of mEER tumors showing DAPI (nuclei, dark blue), EpCAM (tumor, red), CD8α (CD8+ T cells, cyan), and Granzyme B (T cell cytotoxic marker, green). b Pie-charts showing T cell subset fractions among total T cells for each treatment (fraction averaged across 5 images per tumor and n = 3/group). c Log2 fold change of Granzyme B (GzB)+ CD8+ cells normalized to control group (N = 1; n = 3/group; Tukey’s multiple comparison test). Bar graphs show mean +/− SD. *p < 0.05; **p < 0.01
Fig. 5
Fig. 5
CRT + CTX/L-NIL enhances the lymphoid tumor microenvironment. Established mEER tumors treated with CRT and/or CTX/L-NIL and were harvested similar to Fig. 1e, and tumor lymphocyte infiltrate was assessed using flow cytometry (a-e; see Additional file 1: Figure S6 for lymphocyte flow cytometry gating strategy). a Lymphoid-focused tSNE (among TCRβ+ cells) from flow cytometry data for each group of treatment (left) and corresponding color-map (right) with colored lymphocyte subsets listed below (N = 1 representative of 5; n = 8–9/group). b Percentage of lymphoid sub-types among total tumor infiltrating T cells (TCRβ+ cells), including CD8+ T cells (top right), CD4+ T cells (bottom left) and regulatory T cells (bottom right) (N = 3–4; n = 23–36/group; Tukey’s multiple comparison test for CD8+ T cells and Dunn’s multiple comparison test for CD4+ and regulatory T cells). c Ratio of CD8+ T cells/ regulatory T cells percentages (N = 3; n = 23–24/group; Dunn’s multiple comparison test). d Percentage of E7-Tetramer+ among CD8+ T cells (N = 5; n = 33–37/group; Dunn’s multiple comparison test). e Representative flow cytometry histograms showing KLRG-1 expression among CD8+ T cells expressed as the % of the maximum count (left) and cumulative median fluorescence intensity (MFI) for each treatment group (right). FMO (Fluorescence minus one) is a mixture of all antibodies permitting CD8+ T cell identification without the phenotypical marker of interest (N = 2, n = 12; Tukey’s multiple comparison test). All bar graphs show mean +/− SD and each dot represents an individual mouse. *p < 0.05; **p < 0.01; ***p < 0.001; ****p < 0.0001
Fig. 6
Fig. 6
Tumor growth inhibition induced by CRT + CTX/L-NIL requires CD8+ T cells. Established mEER tumors were treated with CRT + CTX/L-NIL and anti-CD8α depleting antibody, or isotype control antibody, according to the schedule in (a); mice were euthanized when tumors reached 225 mm2. b CD8+ T cell percentages among total viable cells in the blood at day 29 of treatment as assessed by flow cytometry (N = 1; n = 10/group, each as an individual dot; data are means +/− SD; Mann-Whitney test). c Individual tumor growth curves shown by treatment group, with each mouse represented as a single line. d Average tumor area (top) and statistical comparison at time of first euthanasia (bottom; Tukey’s multiple comparison test). e Survival curves (top) and statistical comparison between treatments (bottom; Log-rank test). (c-e; N = 1 representative of 2; n = 10/group). *p < 0.05; **p < 0.01; ***p < 0.001; ****p < 0.0001; ns, not significant
Fig. 7
Fig. 7
CTX/L-NIL immunomodulation renders the tumor microenvironment receptive to CRT. Schematic abstract: The tumor immune microenvironment (both myeloid and lymphoid compartments) remains “cold” after CRT treatment, and is characterized by the infiltration of granulocytic MDSCs and regulatory T cells. However, the combination of CRT with CTX/L-NIL reverses these immunosuppressive effects and further promotes increases in M1-like macrophages and inflammatory monocytes in the tumor. This favorable myeloid alteration likely plays a role in the improved intratumoral CD8+ T cell response, which shows enhanced specificity, effector and memory phenotypes

References

    1. Ferlay J, Shin HR, Bray F, Forman D, Mathers C, Parkin DM. Estimates of worldwide burden of cancer in 2008: GLOBOCAN 2008. Int J Cancer. 2010;127(12):2893–2917. - PubMed
    1. Marur S, D’Souza G, Westra WH, Forastiere AA. HPV-associated head and neck cancer: a virus-related cancer epidemic. Lancet Oncol. 2010;11(8):781–789. - PMC - PubMed
    1. Ndiaye C, Mena M, Alemany L, Arbyn M, Castellsagué X, Laporte L, Bosch FX, de Sanjosé S, Trottier H. HPV DNA, E6/E7 mRNA, and p16INK4a detection in head and neck cancers: a systematic review and meta-analysis. Lancet Oncol. 2014;15(12):1319–1331. - PubMed
    1. Bontkes HJ, de Gruijl TD, van den Muysenberg AJC, Verheijen RHM, Stukart MJ, Meijer CJLM, Scheper RJ, Stacey SN, Duggan-Keen MF, Stern PL, Man S, Borysiewicz LK, Walboomers JMM. Human papillomavirus type 16 E6/E7-specific cytotoxic T lymphocytes in women with cervical neoplasia. Int J Cancer. 2000;88(1):92–98. - PubMed
    1. Lassen P, Eriksen JG, Hamilton-Dutoit S, Tramm T, Alsner J, Overgaard J. Effect of HPV-associated p16INK4A expression on response to radiotherapy and survival in squamous cell carcinoma of the head and neck. J Clin Oncol. 2009;27(12):1992–1998. - PubMed

Publication types

MeSH terms