. 2019 Feb 19;116(8):3146-3154.
doi: 10.1073/pnas.1812594116. Epub 2019 Jan 15.

A collaborative multiyear, multimodel assessment of seasonal influenza forecasting in the United States

Affiliations

A collaborative multiyear, multimodel assessment of seasonal influenza forecasting in the United States

Nicholas G Reich et al. Proc Natl Acad Sci U S A. .

Abstract

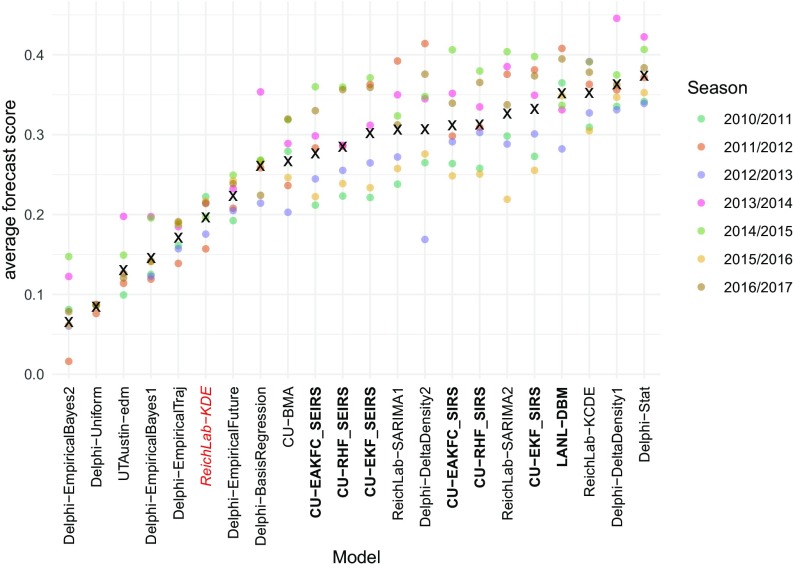
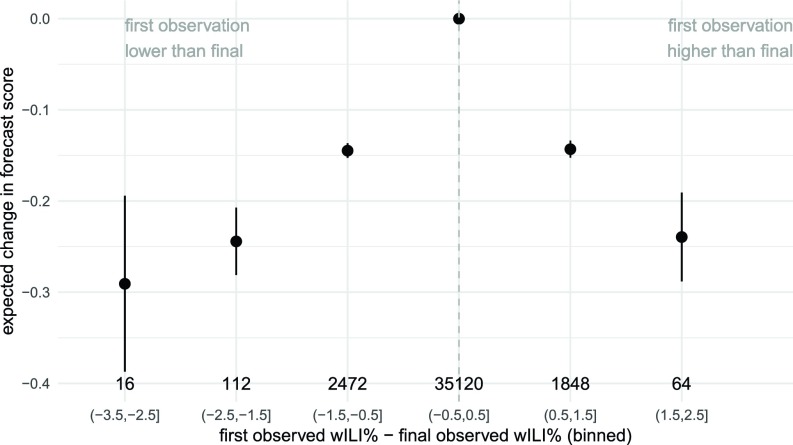
Influenza infects an estimated 9-35 million individuals each year in the United States and is a contributing cause for between 12,000 and 56,000 deaths annually. Seasonal outbreaks of influenza are common in temperate regions of the world, with highest incidence typically occurring in colder and drier months of the year. Real-time forecasts of influenza transmission can inform public health response to outbreaks. We present the results of a multiinstitution collaborative effort to standardize the collection and evaluation of forecasting models for influenza in the United States for the 2010/2011 through 2016/2017 influenza seasons. For these seven seasons, we assembled weekly real-time forecasts of seven targets of public health interest from 22 different models. We compared forecast accuracy of each model relative to a historical baseline seasonal average. Across all regions of the United States, over half of the models showed consistently better performance than the historical baseline when forecasting incidence of influenza-like illness 1 wk, 2 wk, and 3 wk ahead of available data and when forecasting the timing and magnitude of the seasonal peak. In some regions, delays in data reporting were strongly and negatively associated with forecast accuracy. More timely reporting and an improved overall accessibility to novel and traditional data sources are needed to improve forecasting accuracy and its integration with real-time public health decision making.

Keywords: forecasting; infectious disease; influenza; public health; statistics.


Conflict of interest statement

Conflict of interest statement: J.S. and Columbia University disclose partial ownership of SK Analytics.

Figures

Fig. 1.
Fig. 1.
(A) wILI data downloaded from the CDC website from selected regions. The y axis shows the weighted percentage of doctor’s office visits in which a patient presents with ILI for each week from September 2010 through July 2017, which is the time period for which the models presented in this paper made seasonal forecasts. (B) A diagram showing the anatomy of a single forecast. The seven forecasting targets are illustrated with a point estimate (circle) and an interval (uncertainty bars). The five targets on the wILI scale are shown with uncertainty bars spanning the vertical wILI axis, while the two targets for a time-of-year outcome are illustrated with horizontal uncertainty bars along the temporal axis. The onset is defined relative to a region- and season-specific baseline wILI percentage defined by the CDC (19). Arrows illustrate the timeline for a typical forecast for the CDC FluSight challenge, assuming that forecasts are generated or submitted to the CDC using the most recent reported data. These data include the first reported observations of wILI% from 2 wk prior. Therefore, 1- and 2-wk-ahead forecasts are referred to as nowcasts, i.e., at or before the current time. Similarly, 3- and 4-wk-ahead forecasts are forecasts or estimates about events in the future.
Fig. 2.
Fig. 2.
Average forecast score by model region and target type, averaged over weeks and seasons. The text within the grid shows the score itself. The white midpoint of the color scale is set to be the target- and region-specific average of the historical baseline model, ReichLab-KDE, with darker blue colors representing models that have better scores than the baseline and darker red scores representing models that have worse scores than the baseline. The models are sorted in descending order from most accurate (top) to least accurate (bottom) and regions are sorted from high scores (right) to low scores (left).
Fig. 3.
Fig. 3.
Absolute and relative forecast performance for week-ahead (A and B) and seasonal (C and D) targets, summarized across all models that on average performed better than the historical baseline. A and C show maps of the United States that illustrate spatial patterns of average forecast accuracy for week-ahead (A) and seasonal (C) targets. Color shading indicates average forecast score for this model subset. B and D compare historical baseline model score (x axis) with the average score (y axis, horizontal dashed line at average across regions) with one point for each region. For example, a y value of 0.1 indicates that the models on average assigned 10% more probability to the eventually observed value than the historical baseline model. The digits in the plot refer to the corresponding HHS region number, with N indicating the US national region. E shows the number of seasons each model had average performance above the historical baseline.
Fig. 4.
Fig. 4.
Average forecast score by model and week relative to peak. Scores for each location–season were aligned to summarize average performance relative to the peak week on the x axis, zero indicates the peak week and positive values represent weeks after the peak week. In general, models that were updating forecasts based on current data showed improved accuracy for peak targets once the peak had passed. Only several of the models consistently assigned probabilities greater than 0.2 to the eventually observed values before the peak week.
Fig. 5.
Fig. 5.
Average forecast score, aggregated across targets, regions, and weeks, plotted separately for each model and season. Models are sorted from lowest scores (left) to highest scores (right). Higher scores indicate better performance. Circles show average scores across all targets, regions, and weeks within a given season. The “x” marks the geometric mean of the seven seasons. The names of compartmental models are shown in boldface type. The ReichLab-KDE model (red italics) is considered the historical baseline model.
Fig. 6.
Fig. 6.
Model-estimated changes in forecast skill due to bias in initial reports of wILI %. Shown are estimated coefficient values (and 95% confidence intervals) from a multivariable linear regression using model, week of year, target, and a categorized version of the bias in the first reported wILI % to predict forecast score. The x-axis labels show the range of bias [e.g., “(−0.5,0.5]” represents all observations whose first observations were within ±0.5 percentage points of the final reported value]. Values to the left of the dashed gray line are observations whose first reported value was lower than the final value. y-axis values of less than zero (the reference category) represent decreases in expected forecast skill. The total number of observations in each category is shown above each x-axis label.

Comment in

References

    1. Molodecky NA, et al. Risk factors and short-term projections for serotype-1 poliomyelitis incidence in Pakistan: A spatiotemporal analysis. PLoS Med. 2017;14:e1002323. - PMC - PubMed
    1. Du X, King AA, Woods RJ, Pascual M. Evolution-informed forecasting of seasonal influenza A (H3N2) Sci Transl Med. 2017;9:eaan5325. - PMC - PubMed
    1. Bansal S, Chowell G, Simonsen L, Vespignani A, Viboud C. Big data for infectious disease surveillance and modeling. J Infect Dis. 2016;214:S375–S379. - PMC - PubMed
    1. Myers MF, Rogers DJ, Cox J, Flahault A, Hay SI. Forecasting disease risk for increased epidemic preparedness in public health. Adv Parasitol. 2000;47:309–330. - PMC - PubMed
    1. World Health Organization 2016 Anticipating emerging infectious disease epidemics (World Health Organization, Geneva). Available at http://apps.who.int/iris/bitstream/handle/10665/252646/WHO-OHE-PED-2016..... Accessed January 25, 2018.