. 2019 Mar 15;294(11):4202-4214.
doi: 10.1074/jbc.RA118.005142. Epub 2019 Jan 15.

Fluorescence resonance energy transfer links membrane ferroportin, hephaestin but not ferroportin, amyloid precursor protein complex with iron efflux

Affiliations

Fluorescence resonance energy transfer links membrane ferroportin, hephaestin but not ferroportin, amyloid precursor protein complex with iron efflux

Adrienne C Dlouhy et al. J Biol Chem. .

Abstract

Iron efflux from mammalian cells is supported by the synergistic actions of the ferrous iron efflux transporter, ferroportin (Fpn) and a multicopper ferroxidase, that is, hephaestin (Heph), ceruloplasmin (Cp) or both. The two proteins stabilize Fpn in the plasma membrane and catalyze extracellular Fe3+ release. The membrane stabilization of Fpn is also stimulated by its interaction with a 22-amino acid synthetic peptide based on a short sequence in the extracellular E2 domain of the amyloid precursor protein (APP). However, whether APP family members interact with Fpn in vivo is unclear. Here, using cyan fluorescent protein (CFP)-tagged Fpn in conjunction with yellow fluorescent protein (YFP) fusions of Heph and APP family members APP, APLP1, and APLP2 in HEK293T cells we used fluorescence and surface biotinylation to quantify Fpn membrane occupancy and also measured 59Fe efflux. We demonstrate that Fpn and Heph co-localize, and FRET analysis indicated that the two proteins form an iron-efflux complex. In contrast, none of the full-length, cellular APP proteins exhibited Fpn co-localization or FRET. Moreover, iron supplementation increased surface expression of the iron-efflux complex, and copper depletion knocked down Heph activity and decreased Fpn membrane localization. Whereas cellular APP species had no effects on Fpn and Heph localization, addition of soluble E2 elements derived from APP and APLP2, but not APLP1, increased Fpn membrane occupancy. We conclude that a ferroportin-targeting sequence, (K/R)EWEE, present in APP and APLP2, but not APLP1, helps modulate Fpn-dependent iron efflux in the presence of an active multicopper ferroxidase.

Keywords: amyloid precursor protein (APP); ferroportin; fluorescence resonance energy transfer (FRET); hephaestin; iron efflux; iron metabolism; membrane transport; metal homeostasis.


Conflict of interest statement

The authors declare that they have no conflicts of interest with the contents of this article

Figures

Figure 1.
Figure 1.
The APP–Fpn interaction structural motifs. A, schematic of domain organization of APP and its orthologues with APP secretase-processing sites indicated. The E1 and E2 elements comprise the APP ectodomain. B, the E2 domain and its five helical motifs. The FTP binding sequence (shown in C) is highlighted in red and is found at the C-terminal end of the αB helix. The αBαC domains were the recombinant proteins used in this report; in APP this domain consists of residues 318–408. The structure shown is from Protein Data Bank 3UMH. C, the FTP sequence in APP and APLP2 and the corresponding residues in APLP1. The FTP sequence is boxed with the residues targeted as FTP-specific in bold.
Figure 2.
Figure 2.
Localization of fluorescent fusions of Fpn, Heph, APP, APLP1, and APLP2. Epifluorescence images of HEK293T cells co-transfected with plasmids expressing Fpn-CFP and -YFP fusions of potential partner proteins. Fpn and Heph fusions localize to the plasma membrane, whereas the fusions of APP and its paralogues are predominantly found in intracellular compartments. Cells were fixed with 4% paraformaldehyde, 4% sucrose in PBS 48 h after transfection. Images were obtained on a Zeiss AxioImager fluorescence microscope using a ×10 objective.
Figure 3.
Figure 3.
Acceptor photobleaching to assess Fpn-CFP, Heph-YFP FRET. A, merged image shows both YFP and CFP fluorescence after photobleaching the acceptor. B, YFP channel showing fluorescence from Heph-YFP fusion before and after photobleaching the acceptor (left panels). CFP channel showing fluorescence from Fpn-CFP fusion before and after photobleaching the acceptor (right panels). The bleached field is indicated by the red box; FRET intensities were quantified in the ROI confined to membrane contiguous spaces within these bleached areas. The data were obtained on a Zeiss LSM 510 Meta confocal microscope using the FRET+ macro.
Figure 4.
Figure 4.
FRET efficiency in HEK cells expressing Fpn-CFP, Heph-YFP following iron treatment. HEK293T cells were transfected with both Fpn-CFP and Heph-YFP plasmids. Forty-eight hours post-transfection, cells were treated with 10 μm FAS for 0, 2, 4, 8, or 24 h before being fixed with 4% paraformaldehyde, 4% sucrose in PBS. A, Fpn-CFP, Heph-YFP merged images after iron treatment for the time periods as indicated. B, heat maps of FRET between Fpn-CFP, Heph-YFP; C, FRET values were quantified as described in Fig. 3 at each time point. In the scatter plot, *, p < 0.05; ***, p < 0.005. The values for FRET efficiencies and corresponding R values are given in Table 2. As in Fig. 3, these images were acquired on a Zeiss LSM 510 Meta confocal microscope.
Figure 5.
Figure 5.
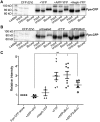
Effect of iron on surface expression of Fpn-CFP as determined by biotinylation. HEK293T cells were transfected with plasmids encoding Fpn-CFP and Heph-YFP (panel A) or Fpn-CFP alone (panel B). Forty-eight hours post-transfection, cells were treated with 10 μm FAS for 0, 2, 4, 8, or 24 h before being treated with EZ-Link Sulfo-NHS-SS-Biotin to biotinylate proteins at the cell surface. Control cells were untreated with FAS. Biotinylated proteins were pulled down with a Neutravidin column. Samples were probed for surface Fpn-CFP expression and compared with Fpn-CFP in total cell extracts; a rabbit anti-GFP antibody was used as probe in these blots. Duplicate blots were probed with anti-Fpn as an Fpn-specific control (“Experimental procedures”). For the “total” samples, 10 μg of protein were loaded in each lane; for “surface” the load represented a constant fraction of “input” to the Neutravidin column. The Western blotting data were quantified using Image Lab (Bio-Rad), and the intensities of the Fpn-CFP bands are reported relative to t = 0 h. The statistical analyses are of data derived from at least three experimental replicates. The blots shown are representative of the quality of the results.
Figure 6.
Figure 6.
Localization of Fpn-CFP, Heph-YFP as a function of cell copper status. HEK293T cells co-transfected with plasmids expressing Fpn-CFP and Heph-YFP were treated with 500 μm BCS for 48 h before being fixed with 4% paraformaldehyde, 4% sucrose in PBS. Images were obtained on a Zeiss LSM 510 Meta confocal microscope using a ×40 objective.
Figure 7.
Figure 7.
59Fe efflux as a function of hephaestin ferroxidase activity. HEK293T cells were transfected with the Fpn-CFP plasmid alone or with both Fpn-CFP and Heph-YFP plasmids. Forty-eight hours post-transfection, treated samples were incubated with 500 μm BCS for 24 h at which point all cells were treated with 1 μm 59FeCl3 (plus citrate and ascorbate) for 24 h, then washed three times with the citrate uptake buffer. Lysates were prepared from a set of these t = 0 samples (representative data presented in B) and then from cells following a 24-h efflux period (data presented in A). The 59Fe in all lysates was quantified by γ counting. Percent loss of cell-associated 59Fe following the 24-h efflux period is reported relative to the initial accumulated metal (t = 0 h samples). The inset quantifies the relative ferroxidase activity in the Fpn-CFP transfectants, either control cells or those co-expressing Heph-YFP. The values are reported as fold-difference compared with the −BCS, Fpn-CFP sample (see “Experimental procedures”). Mean ± S.D. are based on three independent experiments. *, p < 0.05; ***, p < 0.005; ****, p < 0.001.
Figure 8.
Figure 8.
Localization of Fpn-CFP, Heph-YFP in response to addition of FTP and APP orthologues. HEK293T cells co-transfected with plasmids expressing Fpn-CFP and Heph-YFP were treated with 10 nm APPαBαC, APLP1αBαC, or APLP2αBαC for 48 h before being fixed with 4% paraformaldehyde, 4% sucrose in PBS. The merged images were obtained on a Zeiss LSM 510 Meta confocal microscope using a ×63 objective. Note that the control illustrated is the same control provided in Fig. 4A; the data for the FRET analyses shown in Fig. 4 and imaging of the samples shown here were collected during the same confocal session.
Figure 9.
Figure 9.
Surface localization of Fpn-CFP in response to endogenous expression and exogenous addition of Fpn-interacting APP orthologues. HEK293T cells were transfected to express Fpn-CFP. Indicated samples were co-transfected to express YFP (equivalent to empty vector control), APP-YFP, or Heph-YFP (panel A). During transfection, cells expressing Fpn-YFP alone were treated with FTP (10 nm), APPαBαC or APLP2αBαC (10 nm) (panel B). Proteins at the cell surface were biotinylated 48 h post-transfection using EZ-Link Sulfo-NHS-SS-Biotin, captured on Neutravidin, and eluted samples probed for Fpn-CFP. The samples probed were input; flow-through, unbound protein; bound, surface protein. C, bands from total and surface protein samples were quantified using Image Lab, and the intensity of the Fpn-CFP band reported relative control samples (Fpn-CFP alone). Mean ± S.D. are based on three independent experiments. **, p < 0.01.
Figure 10.
Figure 10.
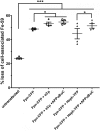
59Fe efflux in response to exogenous addition of Fpn-interacting proteins. HEK293T cells were transfected to express Fpn-CFP or Fpn-CFP and Heph-YFP. Cells were subsequently treated for 24 h with sCp (6.6 nm) or APPαBαC (10 nm) as indicated and then loaded for 24 h with 1 μm 59FeCl3 (plus citrate and ascorbate). Cells were washed and t = 0 samples were reserved for subsequent quantification of 24 h 59Fe accumulation. The remaining samples were incubated for 24 h in the continued presence of additions as indicated but minus 59Fe (efflux condition). Loss of cell-associated 59Fe was quantified and normalized to protein concentration; the data are presented as the percent 59Fe lost compared with the t = 0 controls. Mean ± S.D. are based upon four biological replicates. The p < 0.001 values (***) are differences relative to the untransfected, untreated control. The p < 0.05 values (*) are differences relative to the transfected but untreated cell samples.

Comment in

  • APPealing for a role in cellular iron efflux.
    Lahiri DK, Maloney B, Wang R. Lahiri DK, et al. J Biol Chem. 2019 Jun 14;294(24):9365. doi: 10.1074/jbc.L119.009216. J Biol Chem. 2019. PMID: 31201240 Free PMC article. No abstract available.

Similar articles

Cited by

References

    1. Anderson G. J., and Frazer D. M. (2017) Current understanding of iron homeostasis. Am. J. Clin. Nutr. 106, 1559S–1566S 10.3945/ajcn.117.155804 - DOI - PMC - PubMed
    1. Coffey R., and Ganz T. (2017) Iron homeostasis: an anthropocentric perspective. J. Biol. Chem. 292, 12727–12734 10.1074/jbc.R117.781823 - DOI - PMC - PubMed
    1. Rishi G., and Subramaniam V. N. (2017) The liver in regulation of iron homeostasis. Am. J. Physiol. Gastrointest. Liver Physiol. 313, G157–G165 10.1152/ajpgi.00004.2017 - DOI - PubMed
    1. Donovan A., Lima C. A., Pinkus J. L., Pinkus G. S., Zon L. I., Robine S., and Andrews N. C. (2005) The iron exporter ferroportin/Slc40a1 is essential for iron homeostasis. Cell Metab. 1, 191–200 10.1016/j.cmet.2005.01.003 - DOI - PubMed
    1. Yeh K. Y., Yeh M., and Glass J. (2011) Interactions between ferroportin and hephaestin in rat enterocytes are reduced after iron ingestion. Gastroenterology 141, 292–299, 299.e1 10.1053/j.gastro.2011.03.059 - DOI - PubMed

Publication types

Associated data