. 2019 Feb 27;39(9):1671-1687.
doi: 10.1523/JNEUROSCI.2012-18.2019. Epub 2019 Jan 15.

Internal Gain Modulations, But Not Changes in Stimulus Contrast, Preserve the Neural Code

Affiliations

Internal Gain Modulations, But Not Changes in Stimulus Contrast, Preserve the Neural Code

Sangkyun Lee et al. J Neurosci. .

Abstract

Neurons in primary visual cortex are strongly modulated both by stimulus contrast and by fluctuations of internal inputs. An important question is whether the population code is preserved under these conditions. Changes in stimulus contrast are thought to leave the population code invariant, whereas the effect of internal gain modulations remains unknown. To address these questions we studied how the direction-of-motion of oriented gratings is encoded in layer 2/3 primary visual cortex of mouse (with C57BL/6 background, of either sex). We found that, because contrast gain responses across cells are heterogeneous, a change in contrast alters the information distribution profile across cells leading to a violation of contrast invariance. Remarkably, internal input fluctuations that cause commensurate firing rate modulations at the single-cell level result in more homogeneous gain responses, respecting population code invariance. These observations argue that the brain strives to maintain the stability of the neural code in the face of fluctuating internal inputs.SIGNIFICANCE STATEMENT Neuronal responses are modulated both by stimulus contrast and by the spontaneous fluctuation of internal inputs. It is not well understood how these different types of input impact the population code. Specifically, it is important to understand whether the neural code stays invariant in the face of significant internal input modulations. Here, we show that changes in stimulus contrast lead to different optimal population codes, whereas spontaneous internal input fluctuations leave the population code invariant. This is because spontaneous internal input fluctuations modulate the gain of neuronal responses more homogeneously across cells compared to changes in stimulus contrast.

Keywords: brain states; mouse visual cortex; population codes; two-photon calcium imaging; visual contrast.


Figures

Figure 1.
Figure 1.
Experimental setup. A, Schematic of experiment setup for awake and sedated animals. Eye tracking was performed for awake animals. B, Monitoring of behavioral state during visual stimulus presentation. Top, Single frames of the pupillometry acquisition video at four time points during the experiment. Bottom, Time-series plots of pupil radius (black), pupil position (x, red; y, blue), and wheel rotation speed (yellow). Gray shades represent the stimulus presentation period of the trials selected for the analysis (trials occurring during movement were excluded; see Materials and Methods). C, Mean fluorescence image from a FOV that expresses GCaMP6s. Inset, Enlarged view from the indicated rectangle. D, Examples of fluorescence traces (top) and corresponding deconvolved spike train activity (bottom).
Figure 2.
Figure 2.
Modulation of neuronal population response by spontaneous internal input and by stimulus contrast. A, Example of population activity (PA; blue), pupil radius (black), and locomotion speed (yellow; forward/backward: ±) during visual stimulation lasting ∼40 min. Red dots over pupil traces denote trials included in the analysis, during quiet awake state. The arbitrary unit (a.u.), which denotes spike rates, is commensurate with the percentage dF/F (Eq. 1). The pupil size radius is normalized to the horizontal eyelid length. PA is clearly modulated during physiological changes such as locomotion or pupil dilation. PA is also modulated in absence of overt behavior changes as shown in the dashed rectangle, shown in expanded from in A1. B, Population response to visual stimulation during quiet versus walking states (>20 cm/s). p < 0.01, Wilcoxon signed rank test. C, Population response to visual stimulation during “large” versus “small” pupil size. The pupil size for each trial was defined as the mean pupil size during visual stimulation of the trial. Large versus small pupil trials consist of the trials that belong to the upper versus the lower half of the distribution of pupillary radius across trials, respectively. Note that pupillary changes are compared only for periods of quiet wakefulness (see Materials and Methods). Not significant in Wilcoxon signed rank test. D, Autocorrelogram of pupil size and population response across trials only for quiet wakeful periods. The autocorrelogram was calculated after subtracting the mean of each signal. Mean ± SEM across awake sessions (n = 10 FOVs) for BD. E, Example of population responses over trials from a sedated and an awake animal, respectively. During both the brain states, population responses spontaneously fluctuate in a similar extent (i.e., ∼ 5–10 a.u. and few >10 a.u.) and stable over trials (i.e., very small temporal decay). FH, Comparison of PA during sedation (n = 18) versus quiet wakefulness (n = 10) periods. Mean population response (F) and Fano factor (G). Wilcoxon rank sum tests are used in F and G. H, Population response bias as a function of acquisition time. x-axis: quartile in acquisition time. y-axis: 1 and −1 represent complete-biases by having all trials within each quartile with high and low population activity levels (high: 50% largest trials; low: the remaining), respectively. 0 denoted un-bias between high versus low PAL. Statistical test: Kruskal–Wallis test. Mean ± SEM (n = 18, 10 FOVs for sedated and awake sessions). The maximum mean bias within each acquisition quartile is <0.2, reflecting small changes of population response over time. I, Mean population response to stimulus contrast in a single FOV. The mean population response was obtained by averaging the responses of all visually responsive neurons across all the trials for each contrast, regardless of stimulus direction. Mean ± SEM. J, Illustration of the large trial-to-trial variation in the population response to one stimulus (i.e., 0°, 100% contrast; inset), from the same population shown in I. Each color-coded line represents a population response, averaged across every 10 trials after ranking single-trial population responses by amplitude. Mean ± SEM (n = 10). K, Mean population response amplitudes (a.u.) as a function of contrast (100 vs 40%) and population response level (high vs low). p < 5e−5 in Kruskal–Wallis Test after averaging across stimulus directions. *p < 0.05 in post hoc Tukey tests. Mean ± SEM (n = 18, 10 FOVs for sedated and quiet awake states, respectively).
Figure 3.
Figure 3.
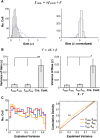
Linear fits of direction tuning function at 100% versus 40% contrast and high versus low population activity (PA). A, The change in gain of direction tuning functions as a function of stimulus contrast is heterogeneous across cells. Red and blue lines show 100%- and 40%-contrast direction tuning curves normalized by the maximum response at 100% contrast for each cell separately. Mean ± SEM (n = 30 trials/direction). Note that while the preferred direction of cells is well preserved across contrasts, the relative scale of the response (gain) between contrasts varies widely across cells. See for example Cells 1–3 whose responses to lower contrast are higher than to 100% contrast supporting. B, C, Fits (black) predicting the direction tuning functions at 40% contrast (f40; blue) from the ones at 100% contrast (f100; red) and at L (f100L; blue) from H (f100H; red), respectively. Such fits are used to extract the parameters α and β. Left, α < 1; right: α >1 for B. α = ∼0.65 for the four example cells for C. D, Tuning invariance across contrasts versus across high and low population activity. The higher the explained variance, the higher the similarity of tuning (extent of tuning invariance) across the two conditions. Although these mechanisms of gain modulation are different, they show a similar tuning invariance pattern across cells: cells showing strong tuning invariance with contrast changes (high EV across contrasts) also show strong tuning invariance with PAL changes (high EV across different population levels of activity). +The point corresponding to the median of the samples. The dashed line denotes y = x.
Figure 4.
Figure 4.
Contrast gain modulation. A, Distribution of gain (α) and bias (β) of all cells across FOVs (n = 653 from 28 FOVs) in the linear fit of f40 = αf100 + β: α (left) and β (right). β was normalized to the maximum tuning response at 100% contrast. Large dispersion of contrast gain parameters (α) occurs across cells. B, The mean variance of the extracted parameters across FOVs when fitted within (f100f100, f40f40) versus across contrasts (f100f40). Only cells whose fits had explained variance >0.5 for each fit (f100f100, f40f40, and f100f40) were included. Mean ± SEM (n = 27, 23, 28 FOVs for f100f100, f40f40, and f100f40). β was normalized to the maximum tuning response at 100% contrast. These plots show that the large dispersion of parameters across cells for the f100f40 contrast transitions represents a physiological effect and does not arise as a result of variability of sampling. p < 1e−10, Kruskal–Wallis test for α (left) and β (right). *p < 0.01, **p < 5e−5 in post hoc Tukey tests.
Figure 5.
Figure 5.
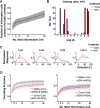
Spontaneous internal gain modulation and its comparison to contrast gain modulation. A, Distribution of gain (α) and bias (β) of all cells across FOVs (n = 747 from 28 FOVs) in the linear fit of f100L = αf100H + β: α (left) and β (right). β was normalized to the maximum tuning response at 100H (i.e., 100% contrast and high population activity). Blue dashed lines represent the histogram shown in Figure 4 (i.e.,α and β; f40 = αf100 + β). Only cells whose fits had explained variance >0.5 were included. For f100L = αf100H + β (black) versus f40 = αf100 + β (blue dashed line), variances of α s are 0.44 versus 0.05, and variances of β are 0.016 versus 0.006, respectively. p < 1e−30 for α and p < 1e−10 for β in Kolmogorov–Smirnov test. B, Variance of gain (α) and bias (β) modulations across cells within each FOV, arising as a result of a change in population activity level (i.e., f100Hf100L, f40Hf40L) versus stimulus contrast (Crs. Cont.). Crs. Cont., The average variance derived from cross-contrast-fits (i.e., f100Hf40H, f100Hf40L, f40Hf100L, f100Lf40L). Only cells whose fits had explained variance >0.5, which is approximately the median of both EV distributions shown in Figure 3D, were included for both fittings of f100Hf100L and f40Hf40L. Mean ± SEM (n = 26 FOVs). p < 5e−4 and p < 1e−3 for α and β in Kruskal–Wallis test, respectively. *p < 1e−2 and **p < 1e−3 in post hoc Tukey tests, respectively. Note that high ↔ low internal activity fluctuations lead to more homogeneous gain modulations across the L2/3 cell population than changes in stimulus contrast. C, Histogram (left) and cumulative density function (right) of explained variance of the linear fits. Blue: f100f40; Red: f100Hf100L; Yellow: f40Hf40L. **p < 1e−5 by Kolmogorov–Smirnov test. Only samples with EV > 0.1 are included in the plot. The similarity between f100Hf100L and f100f40 suggests that the different profiles of gain modulation shown in A and B are not because of a difference in tuning-shape invariance of individual cells, nor the exact value of the criterion (EV > 0.5) used to select cells. Even though the fits of f40Hf40L (C left) degrade somewhat at high EV bins, resulting in a CDF for f40Hf40L that is statistically different from the ones for f100f40 and f100Hf100L, selected cells with EV > 0.5 still have smaller variance of gain and bias modulation for f40Hf40L (as shown in B). Number of cells selected (with EV > 0.5) was as follows: 24% (496) versus 32% (655) cells for f40Hf40L and f100f40, respectively. Note that our conclusions remain robust to reasonable shifts of the EV threshold used for cell selection.
Figure 6.
Figure 6.
Direction population code violates contrast invariance. Within-contrast decoders (x-axis) versus cross-contrast (y-axis) decoders tested at 100% (left; p < 1e−9, Friedman test) and 40% contrast (right; p < 2e−3). Each dot represents decoding accuracy from a single FOV (n = 28). Colors represent the difference between decoded directions of stimulus motion (in degrees).
Figure 7.
Figure 7.
Cells that participate in direction decoding at different contrasts are substantially different. A, Probability for a cell to belong to the first n most informative cells both at 100% and at 40% contrast. B, Example: number out of 100 cross-validation tests for which cells belong to the first three most informative cells for decoding a change of direction = 30°. C, Direction tuning functions of cells selected in B, normalized to the maximum response of Cell 3. Mean ± SEM. The two vertical dash lines represent the two directions decoded. D, Decoding accuracy within (100%→100%; 40%→40%) versus across (40%→100%; 100%→40%) contrasts using only the first n most informative cells as a function of n. Friedman Test p < 1e−10 (left), p < 1e−5 (right). A, D, Solid lines and shadows represent mean (n = 28) and 95% confidence intervals, respectively.
Figure 8.
Figure 8.
Internal gain modulations preserve the population code for stimulus direction-of-motion. A–D, Decoding accuracy comparisons when training/testing data are taken across different stimulus contrasts and PALs. Inset, Cross-condition decoding accuracy minus within-condition decoding accuracy. **p < 1e−3, ***p < 1e−4 (FWE, Wilcoxon signed rank test). Note that population code is preserved across high ↔ low internal gain modulations occurring at fixed stimulus contrast, but not across different contrasts. As a stark example, A shows that decoders trained only with 100L data show almost identical performance with decoders trained with 100H (A, blue) but all other cross-contrast decoders(i.e., decoders trained with 40H and 40L data) do not.
Figure 9.
Figure 9.
Decoding performance degrades for changes in contrast, but not for changes in population activity. AD, Relative performance of cross-condition decoders generated using the first n most informative cells, as a function of n. Y-axis plots change in decoding accuracy: (cross-condition − within-condition)/within-condition. Illustrated differences are significant for all n, except for n = 1,3 in C: Kruskal–Wallis test, p < 1e−7 for A and B, p < 0.05 for C and D. *p < 0.05, ***p < 1e−5 by post hoc Tukey tests.
Figure 10.
Figure 10.
Better performance of within-contrast decoders does not result from contrast-dependent noise characteristics. A, Decoding performance of within-contrast (x-axis) versus cross-contrast (y-axis) decoders after adjusting the SNR of 100%-contrast data to match that of 40%-contrast data. Left (y-axis): 100% contrast data are used for testing, 40% for training. Right (y-axis): 40% for testing, 100% for training. B, Decoding performance of within-contrast (x-axis) versus cross-contrast (y-axis) decoders after we destroy the noise correlation structure across neurons. Left, Testing contrast 100%. Right, Testing contrast 40%. To destroy noise correlations trials were shuffled within stimulus conditions and within cells (see Materials and Methods). Each dot indicates average decoding accuracy across all pairs of stimulus directions. Statistical test, Wilcoxon signed rank test.
Figure 11.
Figure 11.
Superior performance of within-contrast decoders does not appear to strongly depend on stimulus size. We tested decoding performance of within-contrast (x-axis) versus cross-contrast (y-axis) decoders for stimuli of a smaller size of stimulus (i.e., 15° in radius; the usual full field stimulus = ∼55 × ∼80°). Each dot indicates average decoding accuracy across all pairs of stimulus directions. n = 9 FOVs; statistical test, Wilcoxon signed rank test. For both tests, p < 0.005.
Figure 12.
Figure 12.
Suboptimal decoding performance of contrast-independent direction decoders. A, Decoding performance between contrast-specific (x-axis) versus contrast-independent (y-axis) decoders. Each dot depicts decoding accuracy from each pair of directions in a FOV (n = 12). Friedman test p < 0.05. B, Decoding performance comparison presented only for pairs for which within-contrast decoding accuracy was >0.7 at all three contrasts. This suggests that the weaker performance of contrast-independent decoders compared with contrast-specific decoders did not result from poor signal-to-noise data entering at low contrasts. Wilcoxon signed rank test p < 0.005. Decoding accuracy for the surviving pairs was normalized with (Contrast-independent − Within-Contrast)/Within-Contrast for each pair of directions and averaged across pairs of directions within each FOV before the statistical test.
Figure 13.
Figure 13.
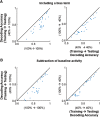
Better performance of within-contrast decoders does not result from using the specific linear model stated in Equation 3. A, Decoding performance of within-contrast (x-axis) versus cross-contrast (y-axis) decoders by using a linear decoder including a bias term of b in the linear model σ(wTr + b) (see the difference from Eq. 3). B, Decoding performance of within-contrast (x-axis) versus cross-contrast (y-axis) decoders after subtracting baseline activity before visual stimulation from visual response in single trials/cells. Left, Testing contrast 100%. Right, Testing contrast 40%. Each dot indicates average decoding accuracy across all pairs of stimulus directions. Statistical test, Wilcoxon signed rank test. p < 5e−6 for all the cases.
Figure 14.
Figure 14.
Within-condition versus cross-condition decoders from awake data only; x-axis: within-condition decoders, y-axis: cross-condition decoders. All figure conventions follows the ones for Figure 8. Population code is preserved between 100H and 100L, but not between contrast 100 and 40%. *p < 0.01 (FWE, Wilcoxon signed rank test). See Figure 8 for all the datasets including sedated and awake data.

Similar articles

Cited by

References

    1. Allman J, Miezin F, McGuinness E (1985) Stimulus specific responses from beyond the classical receptive field: neurophysiological mechanisms for local-global comparisons in visual neurons. Annu Rev Neurosci 8:407–430. 10.1146/annurev.ne.08.030185.002203 - DOI - PubMed
    1. Arandia-Romero I, Tanabe S, Drugowitsch J, Kohn A, Moreno-Bote R (2016) Multiplicative and additive modulation of neuronal tuning with population activity affects encoded information. Neuron 89:1305–1316. 10.1016/j.neuron.2016.01.044 - DOI - PMC - PubMed
    1. Berens P, Ecker AS, Cotton RJ, Ma WJ, Bethge M, Tolias AS (2012) A fast and simple population code for orientation in primate V1. J Neurosci 32:10618–10626. 10.1523/JNEUROSCI.1335-12.2012 - DOI - PMC - PubMed
    1. Bishop CM. (2006) Pattern recognition and machine learning. New York: Springer.
    1. Boyd SP, Vandenberghe L (2004) Convex optimization. Cambridge, UK; New York: Cambridge UP.

Publication types

LinkOut - more resources