. 2019 Mar 13;39(11):2025-2040.
doi: 10.1523/JNEUROSCI.1854-18.2018. Epub 2019 Jan 15.

Complement Targets Newborn Retinal Ganglion Cells for Phagocytic Elimination by Microglia

Affiliations

Complement Targets Newborn Retinal Ganglion Cells for Phagocytic Elimination by Microglia

Sarah R Anderson et al. J Neurosci. .

Abstract

Microglia play important roles in shaping the developing CNS, and at early stages they have been proposed to regulate progenitor proliferation, differentiation, and neuronal survival. However, these studies reveal contradictory outcomes, highlighting the complexity of these cell-cell interactions. Here, we investigate microglia function during embryonic mouse retina development, where only microglia, progenitors, and neurons are present. In both sexes, we determine that microglia primarily interact with retinal neurons and find that depletion of microglia via conditional KO of the Csf1 receptor results in increased density of retinal ganglion cells (RGCs). Pharmacological inhibition of microglia also results in an increase in RGCs, with no effect on retinal progenitor proliferation, RGC genesis, or apoptosis. We show that microglia in the embryonic retina are enriched for phagocytic markers and observe engulfment of nonapoptotic Brn3-labeled RGCs. We investigate the molecular pathways that can mediate cell engulfment by microglia and find selective downregulation of complement pathway components with microglia inhibition, and further show that C1q protein marks a subset of RGCs in the embryonic retina. KO of complement receptor 3 (CR3; Itgam), which is only expressed by microglia, results in increased RGC density, similar to what we observed after depletion or inhibition of microglia. Thus, our data suggest that microglia regulate neuron elimination in the embryonic mouse retina by complement-mediated phagocytosis of non-apoptotic newborn RGCs.SIGNIFICANCE STATEMENT Microglia are emerging as active and important participants in regulating neuron number in development, during adult neurogenesis, and following stem cell therapies. However, their role in these contexts and the mechanisms involved are not fully defined. Using a well-characterized in vivo system, we provide evidence that microglia regulate neuronal elimination by complement-mediated engulfment of nonapoptotic neurons. This work provides a significant advancement of the field by defining in vivo molecular mechanisms for microglia-mediated cell elimination. Our data add to a growing body of evidence that microglia are essential for proper nervous system development. In addition, we elucidate microglia function in the developing retina, which may shed light on microglia involvement in the context of retinal injury and disease.

Keywords: complement; microglia; phagocytosis; retina; retinal ganglion cell.


Figures

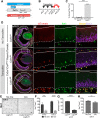
Figure 1.
Figure 1.
Microglial density is dynamic in the developing retina, and microglia primarily associate with newborn neurons. A–C, Representative confocal images of retinal cross sections and central regions (A′–C′) at e12.5, e16.5, and P0: DAPI (blue), Iba1 (purple), Cx3cr1-gfp (green), and Brn3 (red). Dashed line indicates the boundary between the retina and vitreous where Iba1+GFP+ vitreal macrophages reside (yellow arrowheads). NbL and DCL outlined in B′. D, qRT-PCR of whole-retina samples over embryonic development. Levels of Cx3cr1 and Iba1 expression at various ages relative to P60 and normalized to β actin (n ≥ 3 each). qPCR graph represents fold change relative to P60. Error bar indicates the SEM of δ Ct values. E, Microglial density in DCL and NbL at e12.5, e14.5, and e16.5. [n = 4, 4, and 6 animals, respectively; two-way ANOVA: interaction, F(2,22) = 9.265, p = 0.0012; age, F(2,22) = 33.12, p < 0.0001; retinal layer, F(2,22) = 33.12, p < 0.0001; Sidak's multiple-comparisons: DCL vs NbL at e12.5, t(22) = 8.942, p < 0.0001; e14.5, t(22) = 3.206, p = 0.0122; e16.5, t(22) = 7.24, p < 0.0001; Sidak's multiple-comparisons comparing age: e12.5 vs e14.5, t(22) = 6.86, p < 0.0001; e12.5 vs e16.5, t(22) = 7.02, p < 0.0001; e14.5 vs e16.5, t(22) = 0.493, p = 0.948]. F, High-resolution confocal images with the Z plane of Iba1+ microglia in the NbL in contact with a migrating Brn3+ RGC (left) or not in contact (right). Iba1+ microglia (green) and Brn3+ RGCs (red). Z plane shown to the right and bottom of images. White cross represents point of interest. G, Percentage of Iba1+ microglia in the NbL-contacting Brn3+ RGCs at e12.5, e14.5, and e16.5 (n = 4, 4, and 6 animals, respectively). H, Percentage total Iba1+ microglia contacting CC3+ cells at e12.5 and e16.5 (n = 4 retinas, e12.5; n = 7 retinas, e16.5). Scale bars: 100 μm for whole-retina cross sections, 50 μm for high-magnification central region, and 10 μm for microglia contact in NbL. Graphs represent the mean; error bars indicate SEM. Four or five sections per retina were analyzed. ****p < 0.0001. *p < 0.05.
Figure 2.
Figure 2.
Conditional loss of colony stimulating factor 1 receptor depletes embryonic retinal microglia. A, Genetic strategy for conditionally ablating microglia. B, Tamoxifen dosing regimen to target embryonic retinal neurogenesis. Three doses of tamoxifen were administered by oral gavage to pregnant females every other day starting at e9.5 (2, 2, and 3 mg of 10 mg/ml tamoxifen in corn oil). C, Quantification of tdTomato+Iba1+/Iba1+ cells in whole-retina cross sections of Cx3cr1creERT2/+ Rosatdtomato/+ Csf1r+/+ or fl/fl at e16.5 without tamoxifen and Cx3cr1creERT2/+ Rosatdtomato/+ at e14.5 with tamoxifen (e16.5, n = 6; e14.5, n = 3; t(7)125.1, p < 0.0001). Individual dots represent means for each retina. D, Retinal cross sections of e16.5 Cx3cr1creERT2/+ Rosatdtomato/+ (top), Cx3cr1creERT2/+ Rosatdtomato/+ Csf1rfl/+ (middle), and Cx3cr1creERT2/+ Rosatdtomato/+ Csf1rfl/fl (bottom) in the absence (top) and in the presence (middle, bottom) of tamoxifen. D′, Boxed regions at higher magnification. E, The 500 μm2 box of retinal whole mounts of littermates, no Cre (Csf1rfl/fl) and Cre (Cx3cr1creERT2/+ Csf1rfl/fl) at e16.5 exposed to tamoxifen: Iba1+ microglia (black). F, Quantification of Iba1+ density at e14.5 and e16.5 in Cre retinas and no Cre littermate controls (e14.5 no Cre n = 5, Cre n = 8; e16.5 no Cre n = 6, Cre n = 6; two-way ANOVA: interaction, F(1,21) = 2.821, p = 0.1078; Cre expression, F(1,21) = 71.32, p < 0.0001; age F(1,21) = 2.565, p = 0.1242; Sidak's multiple-comparisons test, e14.5 t(21) = 4.814, p = 0.0006, e16.5 t(21) = 7.114, p < 0.0001). G, tdTomato+ density at e16.5 comparing Cx3cr1creERT2/+ Csf1rfl/+, and Cx3cr1creERT2/+ Csf1rfl/fl (n = 3 Csf1rfl/+, n = 5 Csf1rfl/fl; t(6) = 9.222, p < 0.0001). H, Iba1+ density at e20.5/P0 (n = 3 each; t(4) = 1.21, p = 0.293). Scale bars: 100 μm for retinal cross sections, 50 μm for whole mounts and higher magnification (C′). Graphs represent mean with SEM. Four or five retinal sections per retina were analyzed. ****p < 0.0001. ***p < 0.001.
Figure 3.
Figure 3.
Loss of microglia increases RGC density. A, Representative whole-retina cross sections of e14.5 control and depleted retinas illustrating area of analysis (A′): Brn3+ RGCs (red), Iba1+ microglia (green), and tdTomato+ (purple). B, Quantification of dorsal central Brn3+ RGC density in controls and depleted at e14.5 (n = 5 control, n = 8 depleted; t(11) = 6.025, p < 0.0001). C, Representative whole-retina cross sections and dorsal central regions (C′) of e16.5 control and depleted retinas: Brn3+ RGCs (red), Iba1+ microglia (green), and tdTomato+ (purple). D, Quantification of dorsal central Brn3+ RGC density in control and depleted retinas at e16.5 (n = 3 each; t(4) = 3.074, p = 0.0372). Scale bars: 100 μm for whole retinas (A, C) and 50 μm for higher magnification (A′, C′). Graphs represent mean with SEM. Individual dots represent means for each retina. ****p < 0.0001. *p < 0.05.
Figure 4.
Figure 4.
Pharmacological inhibition of microglia increases RGC density with no change in other early born cell types. A, Minocycline dosing regimen targeting embryonic retinal neurogenesis. The 120 mg/kg of minocycline or vehicle alone was given by oral gavage once daily for 4 d beginning at e12.5. B, Whole-retina qRT-PCR at e16.5 analyzing microglia transcripts Cx3cr1 and Iba1 (n = 3 control, n = 10 minocycline-treated; Cx3cr1 t(11) = 0.9771, p = 0.350; Iba1 t(11) = 4.127, p = 0.0017), normalized to β actin and fold change relative to vehicle only controls. qPCR graph represents fold change. Error bars indicate the SEM of δ Ct values. C, Quantification of GFP+ cells in control and minocycline-treated retinal cross sections (n = 9 animals each; t(16) = 0.4183 p = 0.681 with Welch's correction). D, Representative retinal cross sections at e16.5 of control and minocycline-treated retinas: DAPI (blue) and Cx3cr1-gfp (green). C′, Higher-magnification images of dorsal central region. E, High-magnification view of individual GFP+ microglia from retinal whole mounts. F, Representative retinal cross sections of control and minocycline-treated animals at e16.5 with higher-magnification analyzed dorsal central region of RGCs. Higher-magnification view below (F′): Brn3+ RGCs (red) and GFP+ microglia (green). G, Quantification of dorsal central Brn3+ RGC density in control and minocycline-treated retinas at e16.5 (n = 6 animals each; t(10) = 2.53, p = 0.0299). Individual dots represent means for each retina. H, Representative images of dorsal central region analyzing horizontal and amacrine cells: Brn3a+ RGCs (red) and calbindin+ (green). I, Quantification of calbindin+ Brn3a cells at e16.5 of control and minocycline-treated retinas (n = 6 control, n = 5 treated; t(9) = 0.318, p = 0.758). J, Representative images of dorsal central region Rxrγ+ cells along the apical surface. Rxrγ+ (teal). K, Quantification of Rxrγ+ Brn3 cell density along 300 μm of the apical surface at e16.5 of control and minocycline-treated retinas (n = 4 control, n = 4 treated; t(6) = 1.394, p = 0.213). Scale bars: 100 μm for whole-retina cross sections (D, F) and 50 μm for higher-magnification central regions in (D′, F′, H, J), 10 μm for individual microglia (E). Graphs represent mean ± SEM. ***p < 0.001. *p < 0.05.
Figure 5.
Figure 5.
Perturbation of microglia does not change retinal progenitor proliferation or RGC genesis. A, Retinal cross sections of control and minocycline-treated retinas at e16.5 with higher magnified analyzed dorsal central region (A′) of pH3 (red). B, Density of pH3 along 300 μm length of apical surface of dorsal central region of control and minocycline retinas (n = 6 animals each; t(10) = 0.978, p = 0.351). C, Dosing regimen for tamoxifen (e9.5, e11.5, e13.5), EdU (e12.5), and BrdU (e13.5) injections. D, Representative retinal cross sections of control and microglia depleted animals at e14.5 injected with EdU at e12.5 and BrdU at e13.5, with higher magnified analyzed dorsal central region (D′): DAPI (blue), Brn3+ RGCs (green), BrdU (red), and EdU (purple). Yellow arrowheads indicate RGCs born between e13.5 and e14.5 (BrdU+ EdU+/− Brn3+). White arrowheads indicate RGCs born between e12.5 and e13.5 (EdU+ BrdU Brn3+). E, Quantification of RGCs born between e13.5 and e14.5 (BrdU+ EdU+/− Brn3+) in control and depleted retinas (n = 8 animals/13 retinas controls, n = 7 animals/10 retinas depleted; t(21) = 0.190, p = 0.8511). F, Quantification of RGCs born between e12.5 and e13.5 (EdU+ BrdU Brn3+) in control and depleted retinas (n = 5 animals/10 retinas controls, n = 3 animals/6 retinas depleted; t(14) = 2.45, p = 0.0279). Scale bars: 100 μm for whole-retina cross sections (A, D) and 50 μm central regions (A′, D′). Graphs represent mean with SEM. *p < 0.05.
Figure 6.
Figure 6.
Inhibition of microglia does not change retinal cell apoptosis or alter microglial contact with apoptotic cells. A, Representative retinal cross sections of control and minocycline-treated animals at e16.5 with higher magnification (C′): DAPI (blue) and CC3+ apoptotic cells (white). B, CC3+ cells at e16.5 of control and minocycline-treated retinas [n = 6 animals each; two-way ANOVA: interaction, F(1,20) = 0.039, p = 0.846; treatment, F(1,20) = 0.597, p = 0.449; retinal layer, F(1,20) = 0.9473, p = 0.342; Sidak's multiple-comparisons: minocycline vs control DCL, t(20) = 0.685, p = 0.7511; NbL, t(20) = 0.407, p = 0.903]. C, Number of CC3+ cells at e16.5 contacted by microglia (n = 7 each; t(12) = 0.3712, p = 0.717). D, Average distance of microglia to a CC3+ cell. Each dot represents the mean distance for a particular retina (n = 7 each; t(12) = 1.162, p = 0.268). E, CC3+ cells at e13.5 of control and minocycline-treated retinas (n = 3 animals each; t(4) = 0.498, p = 0.645). Scale bars: 100 μm for whole-retina cross sections (A) and 50 μm higher-magnification central regions (A′). Graphs indicate mean with SEM. Individual dots represent individual retinas.
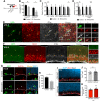
Figure 7.
Figure 7.
Microglia are phagocytic at embryonic stages and interact with RGCs. A, High-resolution confocal image of microglial engulfment of an apoptotic cell (CC3+): DAPI (blue), Cx3cr1-gfp+ microglia (green), Brn3+ RGCs (red), and CC3+ (white). B, Microglia engulfing Brn3+ RGC. Right, bottom, Z planes: Cx3cr1-gfp+ microglia (green) and Brn3+ RGCs (red). C, D, Microglia interacting with non-CC3+ RGCs: DAPI (blue), Cx3cr1-gfp+ microglia (green), Brn3+ RGCs (red), and CC3+ (white). E–I, IMARIS-based 3D reconstruction of microglia interacting with RGCs: Cx3cr1-gfp+ microglia (green), Brn3+ RGCs (red), and CC3+ (white). F, Reconstruction of C. G, Reconstruction of D. J, Genes associated with phagocytosis assessed at e12.5 relative to P0 by whole-retina qRT-PCR. Normalized to β actin (n = 3 each; Mertk, t(4) = 18.74, p < 0.0001; Cd68, t(4) = 6.71, p = 0.0026; t(4) = 16.41; C1qb, p < 0.0001; C3, t(4) = 7.33, p = 0.0018). qPCR graph represents fold change. Error bar indicates the SEM of δ Ct values. K, Percentage of Brn3+ RGC density in depleted retinas normalized to littermate control retinas at e20.5/P0 (n = 5 retinas/3 animals each; one-sample t test, t(4) = 6.898, p = 0.0023). Scale bars: E, F, 10 μm; G, 3 μm; H, I, 5 μm. Unpaired Student's t test was used to determine significance of δ Ct values. ****p < 0.0001. **p < 0.01. Movie 4 is of C, F. Movie 3 is of D, G. Movie 1 is of H. Movie 2 is of I.
Figure 8.
Figure 8.
Complement proteins are downregulated with minocycline treatment, and loss of CR3/Cd11b results in increased RGC density. A, Minocycline dosing regimen at e12.5 and e13.5 and death 2 h later. B, Quantification of overall microglial density (GFP+/mm2) and the density of microglia with Cd68+ lysosomal compartments (Cd68+GFP+/mm2) in minocycline-treated and control retinas at e13.5 (n = 3 each; control, 159.2 ± 7.81; minocycline, 132.9 ± 6.66 GFP+/mm2; t(4) = 2.56, p = 0.063; control, 118.1 ± 12.7; minocycline, 59.82 ± 15.43 Cd68+GFP+/mm2; t(4) = 2.913, p = 0.044). C, Whole-retina qRT-PCR of Iba1 and microglial receptors commonly associated with phagocytosis (n ≥ 6 control, n ≥ 11 minocycline; Iba1, t(18) = 3.23, p = 0.0046; Mertk, t(18) = 0.348, p = 0.732; VNR, t(18) = 1.53, p = 0.144; Mfge8, t(10) = 0.673, p = 0.516; Tyrobp, t(17) = 1.34, p = 0.197; LRP, t(17) = 2.77, p = 0.013). Normalized to β actin and relative to age-matched vehicle only controls. D, Whole-retina qRT-PCR of complement proteins (n ≥ 6 controls, n ≥ 11 minocycline-treated; Cd11b, t(18) = 2.96, p = 0.008; C3, t(16) = 1.912, p = 0.074; e13.5, C1qb, t(18) = 1.04, p = 0.314; e16.5, C1qb, n = 3 controls, 10 treated; t(11) = 4.91, p = 0.0005). Normalized to β actin and relative to age-matched vehicle only controls. E, e13.5 retinal whole mounts of Cx3cr1-gfp (green), Brn3 (red), C1q (white), and merge. Insets, C1q+ RGC contacted by microglia (1), C1q+ RGC (2), and C1q RGC (3). Yellow arrowheads indicate C1q+ RGCs. F, e16.5 retinal cross sections of Cx3cr1-gfp (green), Brn3 (red), C1q (white), and merge. Inset, Magnification of C1q+ RGCs along DCL border. Yellow arrowheads indicate C1q+ RGCs. G, e13.5 retinal cross sections of Cd11b immunostaining: DAPI (blue), Cx3cr1-gfp (green), and Cd11b+ (red). Yellow arrowheads indicate Cd11bHI microglia. White arrowheads indicate Cd11bLo microglia. H, Quantification of microglia highly expressing Cd11b (GFP+ Cd11bHi) at e13.5 (n = 3 each; control, 86.73 ± 3.71, minocycline, 55.45 ± 7.48; t(4) = 3.75, p = 0.02). I, Retinal cross sections of e16.5 control (CR3 WT) and complement receptor (CR3) KO animals: Iba1 (green) and Brn3 (red). J, Analysis of microglial density (Iba1/mm2) in CR3 KO and littermate WT controls (n = 5 animals/10 retinas WT, 127.4 ± 5.42; n = 5 animals/9 retinas KO, 140.3 ± 5.74; two-sample t test t(17) = 1.626, p = 0.122). K, Analysis of RGC density in CR3 KO and controls. Data were normalized to littermate controls because 3 litters were used (n = 5 animals/10 retinas WT, n = 5 animals/9 retinas KO; one-sample t test t(8) = 3.71, p = 0.006). Scale bars: 50 μm for retinal whole mounts and central regions of retinal cross sections, 10 μm for higher-magnification insets, and in G. C, D, qPCR graphs represent fold change. Error bar indicates the SEM of δ Ct values. Graphs represent mean ± h SEM. ***p < 0.001. **p < 0.01. *p < 0.05.

References

    1. Alawieh A, Langley EF, Tomlinson S (2018) Targeted complement inhibition salvages stressed neurons and inhibits neuroinflammation after stroke in mice. Sci Transl Med 10:eaao6459. 10.1126/scitranslmed.aao6459 - DOI - PMC - PubMed
    1. Bassett EA, Wallace VA (2012) Cell fate determination in the vertebrate retina. Trends Neurosci 35:565–573. 10.1016/j.tins.2012.05.004 - DOI - PubMed
    1. Bilimoria PM, Stevens B (2015) Microglia function during brain development: new insights from animal models. Brain Res 1617:7–17. 10.1016/j.brainres.2014.11.032 - DOI - PubMed
    1. Bonifati DM, Kishore U (2007) Role of complement in neurodegeneration and neuroinflammation. Mol Immunol 44:999–1010. 10.1016/j.molimm.2006.03.007 - DOI - PubMed
    1. Bosco A, Inman DM, Steele MR, Wu G, Soto I, Marsh-Armstrong N, Hubbard WC, Calkins DJ, Horner PJ, Vetter ML (2008) Reduced retina microglial activation and improved optic nerve integrity with minocycline treatment in the DBA/2J mouse model of glaucoma. Invest Ophthalmol Vis Sci 49:1437–1446. 10.1167/iovs.07-1337 - DOI - PubMed

Publication types

Substances