. 2018 Dec 21;9(100):37407-37420.
doi: 10.18632/oncotarget.26448.

Identification of a gene signature for different stages of breast cancer development that could be used for early diagnosis and specific therapy

Affiliations

Identification of a gene signature for different stages of breast cancer development that could be used for early diagnosis and specific therapy

Charu Kothari et al. Oncotarget. .

Abstract

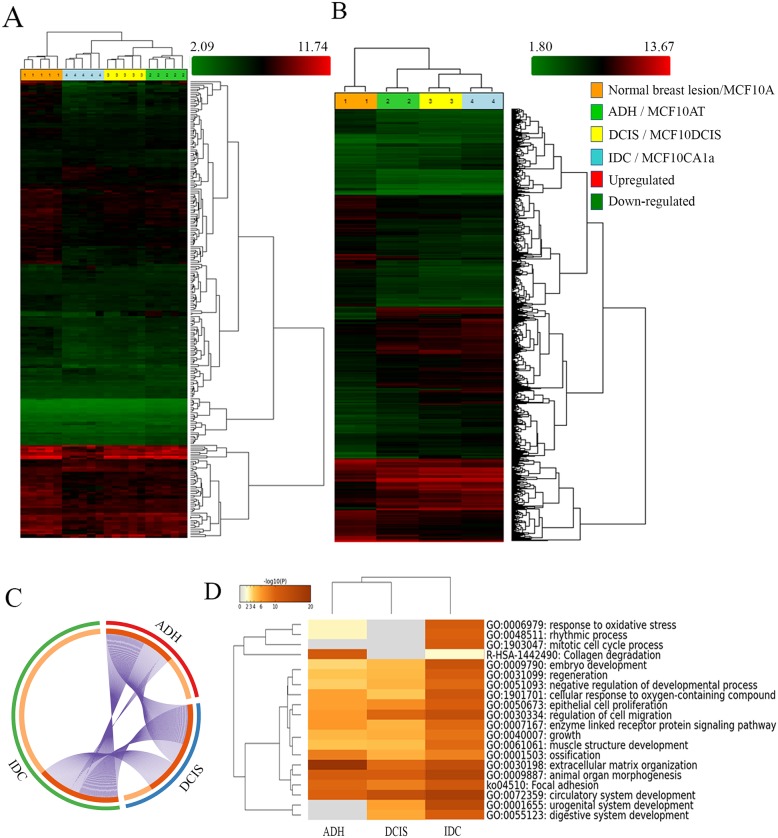
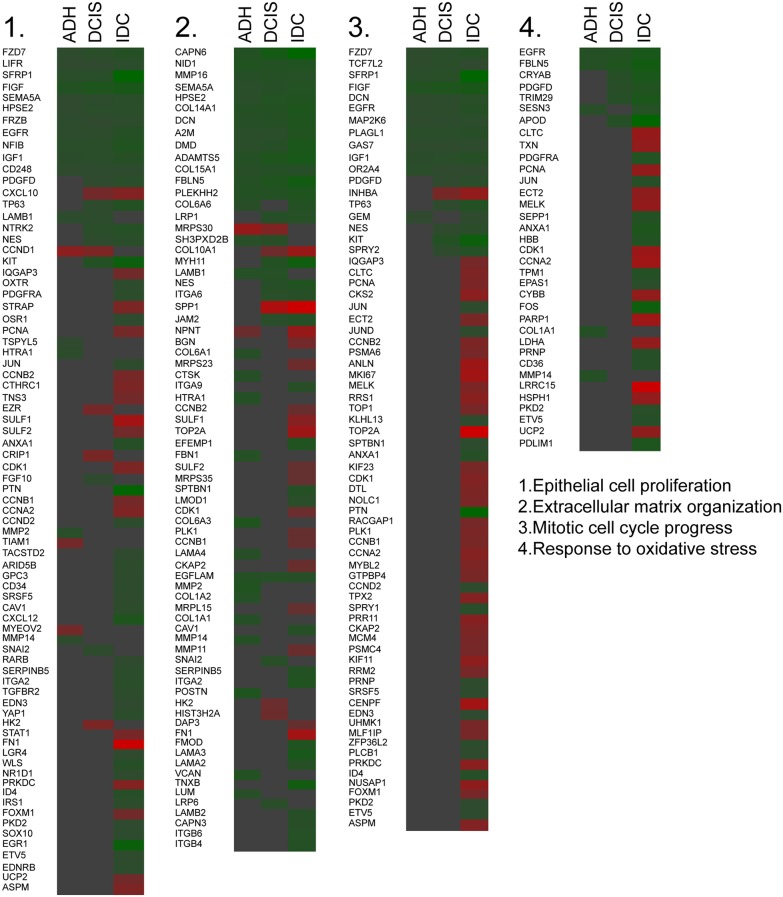
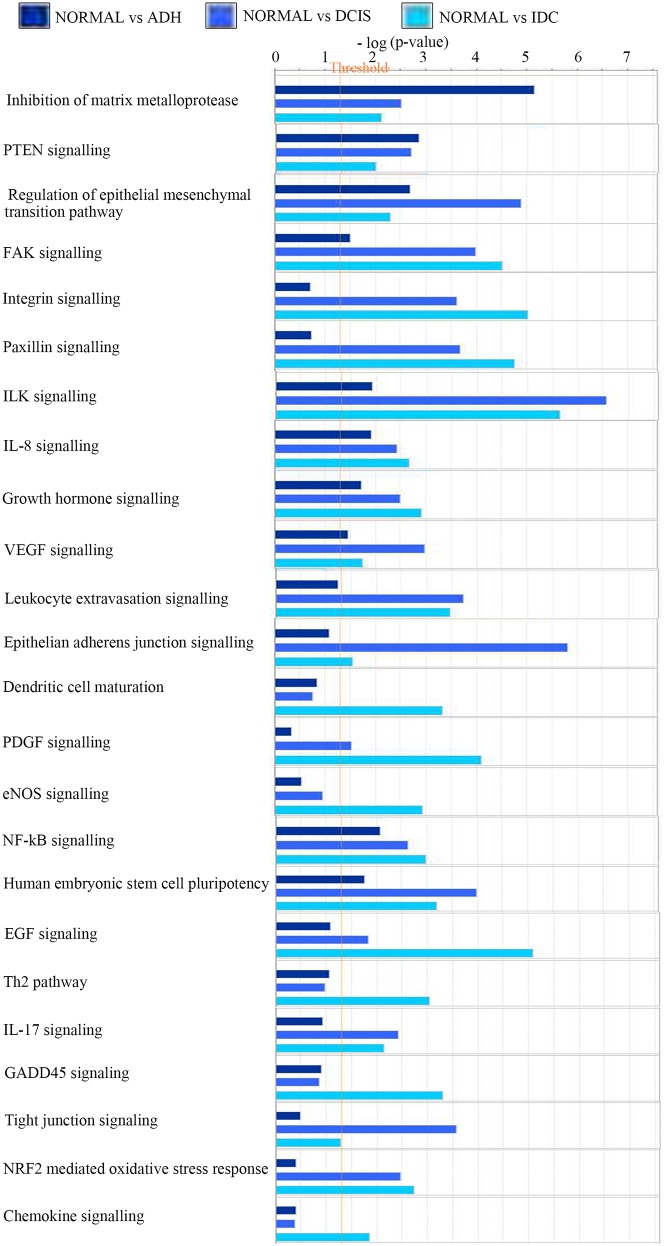
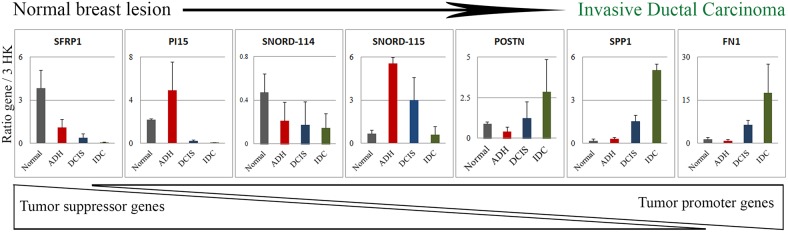
Breast cancer (BC) is a heterogeneous disease where the survival rate of patients decreases with progression of the disease. BC usually has a linear progression, classified into normal/benign, atypical ductal hyperplasia (ADH), ductal carcinoma in situ (DCIS), and invasive ductal carcinoma (IDC). This study aimed to identify gene signature for each of these subgroups. We performed human transcriptome array analysis on 5 patient samples from each Normal, ADH, IDC and DCIS and 2 replicates of MCF10A cell line representative of each subgroup. We identified SFRP1 and snoRNAs (especially SNORD115 and SNORD114) as the initial regulators of cancer progression, accompanied by significant changes in extracellular matrix organization. Tumor progression to the IDC stage showed upregulation of tumor promoting genes responsible for increased invasion, inflammation, survival in stress environment and metastasis. The gene signatures identified in this study could represent potential biomarkers for each subgroup of breast cancer progression, which could assist in early diagnosis of breast cancer progression as well as treatment interventions. Moreover, these gene signatures could serve in discovery of specific targeted therapies for each subgroup.

Keywords: breast cancer progression; ductal carcinoma in situ (DCIS); gene signature; human transcriptome array (HTA) analysis; invasive ductal carcinoma (IDC).


Conflict of interest statement

CONFLICTS OF INTEREST The authors declare that they have no conflicts of interest.

Figures

Figure 1
Figure 1. Analysis of BC progression by Human Transcriptome analysis and Metascape
(http://metascape.org). Hierarchical clustering of breast lesions (A) and representative MCF10A cell lines (B) based on 255 and 2800 differentially expressed gene isoforms, respectively (± 1.5-fold and p < 0.05). Clustering analysis was performed using the Transcriptome Analysis Console (TAC) Software (Thermo Fisher Scientific, Canada). The circos plot showing the gene distribution (± 1.5-fold and p < 0.05) of differentially expressed genes in the three subgroups (ADH, DCIS and IDC) as compared to Normal breast lesions (C). On the outside, each arc represents the identity of each gene list (ADH= Red, DCIS= Blue and IDC= Green). On the inside, each arc represents a gene list, where each gene has a spot on the arc. Dark orange = genes in multiple lists; Light orange = unique to the list. Purple lines link the same genes that are shared by multiple gene lists. Enrichment Ontology cluster across the study (D) depicting statistically enriched pathways clustered based on Kappa-statistical similarities (Kappa score = 0.3). The colour of the heatmap depicts their p-values, white cells = lack of enrichment. Normal breast lesion: benign breast tissue; ADH: Atypical ductal hyperplasia; DCIS: Ductal carcinoma in situ; Invasive: Invasive ductal carcinoma. MCF10A: non-tumorigenic, non-metastatic; MCF10AT (atypical): tumorigenic, non-metastatic; MCF10DCIS (Ductal carcinoma in situ): tumorigenic; locally invasive, non-metastatic and MCF10CA1a (invasive): metastatic.
Figure 2
Figure 2. Changes in genes responsible for the gene annotation
Heat map indicating the fold change of the gene expression in each subgroup based on the enriched ontology (Green = Downregulation, Red= Upregulation).
Figure 3
Figure 3. Changes in pathways responsible for the gene annotation
Bar chart showing the changes in the canonical pathways in the three subgroups as compared to normal breast lesions. Normal: benign breast tissue; ADH: Atypical ductal hyperplasia; DCIS: Ductal carcinoma in situ; IDC: Invasive ductal carcinoma.
Figure 4
Figure 4. Comparison of the gene expression among different subgroups
Venn-diagram (A) representing differentially expressed ncRNAs in each subgroup of BC progression as compared to normal breast lesions. (B) The top 30 (± 1.5-fold and p < 0.05) differentially regulated genes when compared to gene expression in normal breast lesions or inter groups comparisons (C). Green = Downregulation, Red= upregulation. Normal: benign breast tissue; ADH: Atypical ductal hyperplasia; DCIS: Ductal carcinoma in situ; IDC: Invasive ductal carcinoma.
Figure 5
Figure 5. Validation of the difference in gene expression by qPCR
Based on the changes in the top 30 genes depicted in Figure 5B and 5C, 7 genes were selected and validated by qPCR in tissue samples (N=3). The expression data is the ratio of query gene to 3 housekeeping genes (ATP50, HPRT1 and GAPDH). The graph is representative of two independent experiments. Normal: benign breast tissue; ADH: Atypical ductal hyperplasia; DCIS: Ductal carcinoma in situ; IDC: Invasive ductal carcinoma.
Figure 6
Figure 6. Molecular changes associated with breast cancer progression
Stages of BC progression where decrease in tumor suppressor gene, snoRNA regulation and increase in genes responsible for extracellular matrix organisation is associated with breast cancer progression. The triangles represent the changes at each subgroup of BC progression.

References

    1. Sharma GN, Dave R, Sanadya J, Sharma P, Sharma KK. Various types and management of breast cancer: an overview. J Adv Pharm Technol Res. 2010;1:109–26. - PMC - PubMed
    1. Breastcancer.org https://www.breastcancer.org/symptoms/understand_bc/statistics. Accessed December 11, 2018.
    1. Dillon D, Guidi AJ, Schnitt SJ. Chapter 25: Pathology of Invasive Breast CancerDiseases of the Breast. 5th. Lippincott Williams & Wilkins; 2014.
    1. Wellings SR, Jensen HM. On the origin and progression of ductal carcinoma in the human breast. J Natl Cancer Inst. 1973;50:1111–18. - PubMed
    1. Buerger H, Otterbach F, Simon R, Poremba C, Diallo R, Decker T, Riethdorf L, Brinkschmidt C, Dockhorn-Dworniczak B, Boecker W. Comparative genomic hybridization of ductal carcinoma in situ of the breast-evidence of multiple genetic pathways. J Pathol. 1999;187:396–402. - PubMed

LinkOut - more resources