. 2018 Dec 26;4(12):1708-1718.
doi: 10.1021/acscentsci.8b00717. Epub 2018 Dec 13.

Accurate Estimation of Ligand Binding Affinity Changes upon Protein Mutation

Affiliations

Accurate Estimation of Ligand Binding Affinity Changes upon Protein Mutation

Matteo Aldeghi et al. ACS Cent Sci. .

Abstract

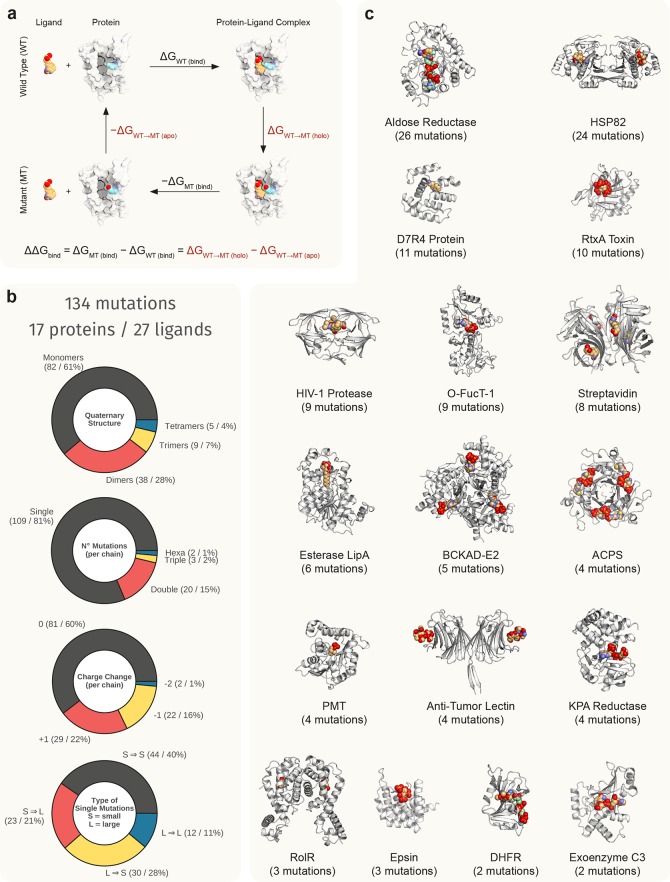
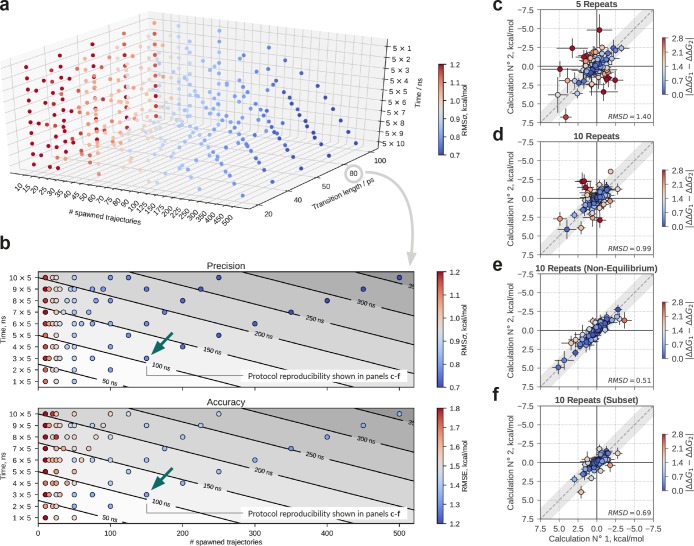
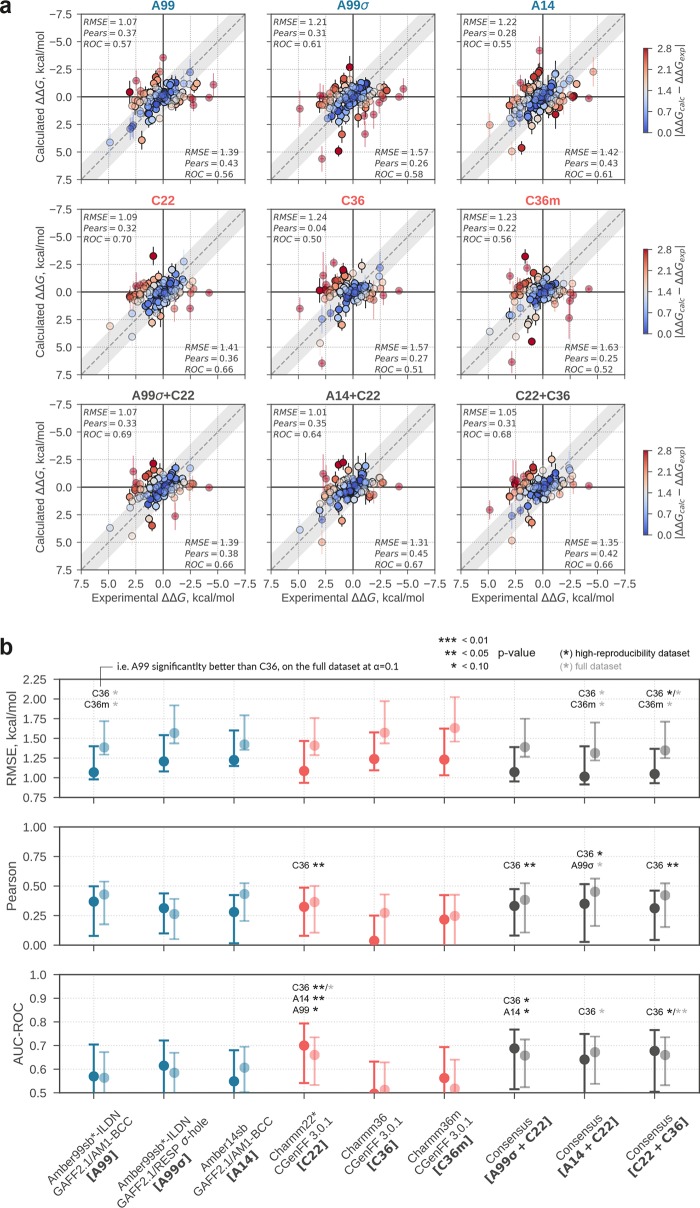
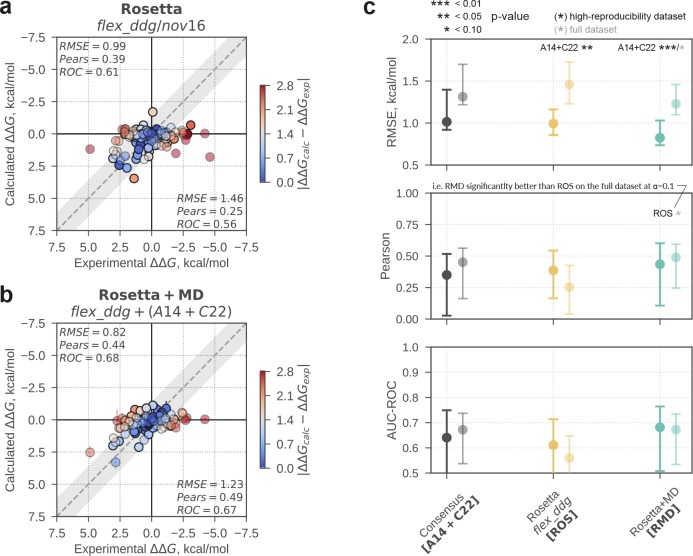
The design of proteins with novel ligand-binding functions holds great potential for application in biomedicine and biotechnology. However, our ability to engineer ligand-binding proteins is still limited, and current approaches rely primarily on experimentation. Computation could reduce the cost of the development process and would allow rigorous testing of our understanding of the principles governing molecular recognition. While computational methods have proven successful in the early stages of the discovery process, optimization approaches that can quantitatively predict ligand affinity changes upon protein mutation are still lacking. Here, we assess the ability of free energy calculations based on first-principles statistical mechanics, as well as the latest Rosetta protocols, to quantitatively predict such affinity changes on a challenging set of 134 mutations. After evaluating different protocols with computational efficiency in mind, we investigate the performance of different force fields. We show that both the free energy calculations and Rosetta are able to quantitatively predict changes in ligand binding affinity upon protein mutations, yet the best predictions are the result of combining the estimates of both methods. These closely match the experimentally determined ΔΔG values, with a root-mean-square error of 1.2 kcal/mol for the full benchmark set and of 0.8 kcal/mol for a subset of protein systems providing the most reproducible results. The currently achievable accuracy offers the prospect of being able to employ computation for the optimization of ligand-binding proteins as well as the prediction of drug resistance.


Conflict of interest statement

The authors declare no competing financial interest.

Figures

Figure 1
Figure 1
Overview of the benchmark data set studied. (a) Thermodynamic cycle showing the quantity to be predicted (ΔΔGbind); the free energy differences estimated via alchemical free energy calculations are highlighted in red. (b) Statistics of the data set about the protein–ligand systems and type of mutations considered. (c) Cartoon representation of the 17 protein systems present in the data set, with the number of affinity changes upon mutation reported. Ligands and cofactors are represented by spheres.
Figure 2
Figure 2
Calibration of the nonequilibrium free energy protocol. (a) Space of protocol setup parameters tested. The three axes indicate the length of the equilibrium simulations (five repeats of 1–10 ns), the number of nonequilibrium trajectories spawned from the equilibrium simulations (from 10 to 500), and their length (from 20 to 100 ps). Each mark represents a specific combination of the above three variables, with the color indicating the overall precision of the calculations (RMSσ). Equivalent plot color-coded by accuracy (RMSE) in Figure S3. (b) Scatter plots showing the overall precision and accuracy of different setup protocols that used nonequilibrium trajectories of 80 ps. Isolines indicate the computational cost (in simulation time) for one ΔΔG estimate. A green arrow indicates the protocol that was chosen for further calculations. (c) Reproducibility of the calculations. The scatter plot shows the agreement between two sets of ΔΔG estimates. For the second estimate, both the equilibrium and nonequilibrium parts of the calculations were repeated. On the bottom-right corner of the plot, the RMSD between the repeated calculations is shown. (d) Reproducibility of the calculations when increasing the number of independent equilibrium simulations to 10. Also in this case, both the equilibrium and nonequilibrium parts of the calculations were repeated. (e) Reproducibility of the nonequilibrium part of the calculations. In this case, two sets of nonequilibrium transitions were started from the same equilibrium simulations. (f) Reproducibility of the calculations (both equilibrium and nonequilibrium) for a subset of the data with four challenging protein systems excluded.
Figure 3
Figure 3
Performance of the free energy calculations with different force fields and force field combinations. (a) Scatter plots of experimental versus calculated ΔΔG values. The identity line is shown as a dashed gray line, while the shaded area indicates the region where ΔΔG estimates are within 1.4 kcal/mol of experiment (i.e., within a 10-fold error in Kd change at 300 K). The performance for the high-reproducibility subset of the data is reported at the top-left of each plot, while the performance for the whole data set is shown at the bottom-right. Color-coding is used to indicate the error of each individual ΔΔG estimate. (b) Summary of the performance of the calculations across force fields in terms of RMSE, Pearson correlation, and AUC-ROC (point estimates and the 95% CIs are shown). Differences at three levels of significance are reported using labels within the chart: e.g., a “C36 *” label above the RMSE mark of A99 indicates that the RMSE of A99 is significantly lower (i.e., agreement with experiment is better) than that of C36 at α = 0.10. Marks in solid colors refer to the high-reproducibility subset, while marks in semitransparent colors refer to the full data set.
Figure 4
Figure 4
Performance of Rosetta protocols. (a) Experimental versus calculated affinity changes for the flex_ddg/nov16 protocol. The identity line is shown as a dashed gray line, while the shaded area indicates the region where ΔΔG estimates are within 1.4 kcal/mol of experiment (i.e., within a 10-fold error in Kd change at 300 K). The performance for the high-reproducibility subset of the data is reported at the top-left of the plot, while the performance for the whole data set is shown at the bottom-right. Color-coding is used to indicate the error of each individual ΔΔG estimate. (b) Experimental versus calculated affinity changes for the consensus results combining the flex_ddg/nov16 results with the free energy calculations results A14 + C22. (c) Summary of the performance of the Rosetta calculations in terms of RMSE, Pearson correlation, and AUC-ROC (point estimate and 95% CIs are shown). Differences at three levels of significance are reported using labels within the chart: e.g., a “A14 + C22 **” label above the RMSE mark of ROS indicates that the RMSE of ROS is significantly lower than that of A14 + C22 at α = 0.05. Marks in solid colors refer to the high-reproducibility subset, while marks in semitransparent colors refer to the full data set.

References

    1. Beato M.; Chávez S.; Truss M. Transcriptional Regulation by Steroid Hormones. Steroids 1996, 61 (4), 240–251. 10.1016/0039-128X(96)00030-X. - DOI - PubMed
    1. Ronnett G. V.; Moon C. G Proteins and Olfactory Signal Transduction. Annu. Rev. Physiol. 2002, 64 (1), 189–222. 10.1146/annurev.physiol.64.082701.102219. - DOI - PubMed
    1. Missale C.; Nash S. R.; Robinson S. W.; Jaber M.; Caron M. G. Dopamine Receptors: From Structure to Function. Physiol. Rev. 1998, 78 (1), 189–225. 10.1152/physrev.1998.78.1.189. - DOI - PubMed
    1. Yang W.; Lai L. Computational Design of Ligand-Binding Proteins. Curr. Opin. Struct. Biol. 2017, 45, 67–73. 10.1016/j.sbi.2016.11.021. - DOI - PubMed
    1. de Wolf F. A.; Brett G. M. Ligand-Binding Proteins: Their Potential for Application in Systems for Controlled Delivery and Uptake of Ligands. Pharmacol. Rev. 2000, 52 (2), 207–236. - PubMed