. 2019 May;40(7):2241-2251.
doi: 10.1002/hbm.24521. Epub 2019 Jan 15.

Frontostriatal network dysfunction as a domain-general mechanism underlying phantom perception

Affiliations

Frontostriatal network dysfunction as a domain-general mechanism underlying phantom perception

Jeffrey Hullfish et al. Hum Brain Mapp. 2019 May.

Abstract

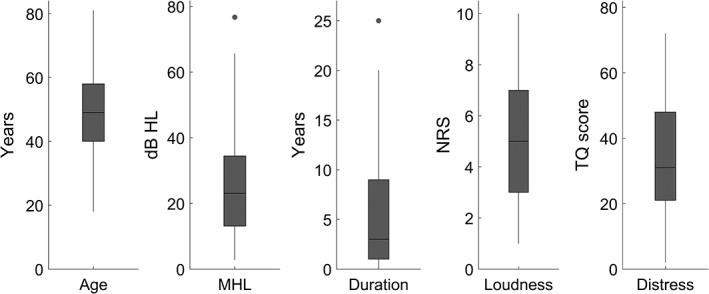
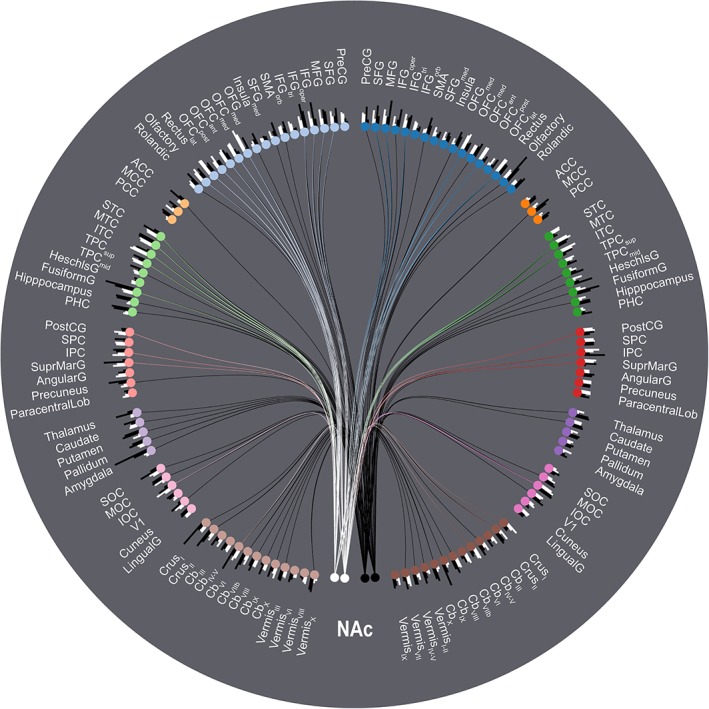
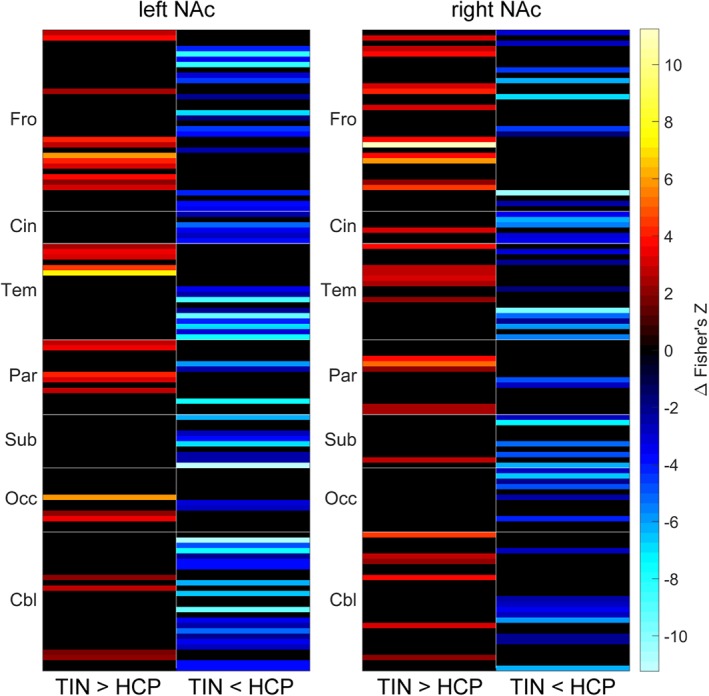
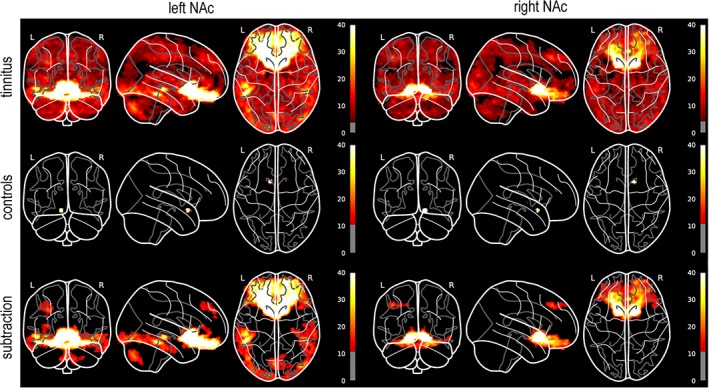
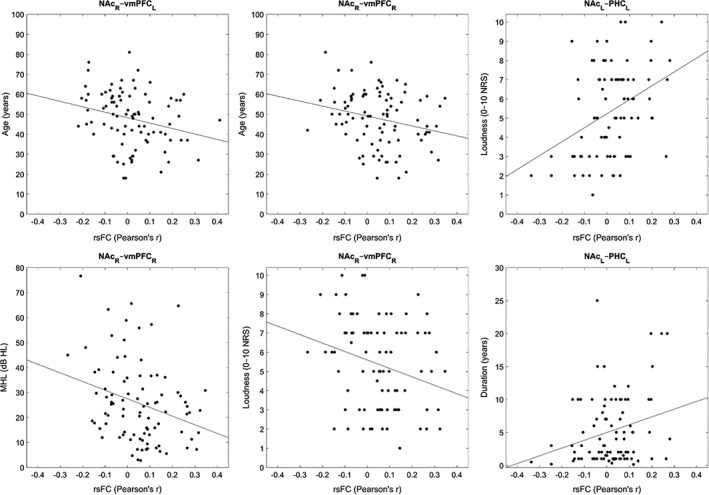
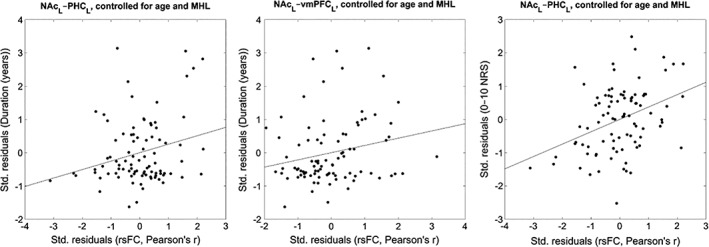
In the present study, we use resting state fMRI to investigate whether nucleus accumbens (NAc) and extended frontostriatal networks are involved in the pathology of auditory phantom perception, i.e., tinnitus, through a study of functional connectivity. We hypothesize that resting state functional connectivity involving NAc will be increased relative to what is observed in healthy subjects and that this connectivity will correlate with clinical measures of tinnitus such as percept loudness, duration of symptoms, etc. We show that a large sample of patients with chronic tinnitus (n = 90) features extensive functional connectivity involving NAc that is largely absent in healthy subjects (n = 94). We further show that connectivity involving NAc correlates significantly with tinnitus percept loudness and the duration of tinnitus symptoms, even after controlling for the effects of age and hearing loss. The loudness correlation, which involves NAc and parahippocampal cortex, is consistent with existing literature identifying the parahippocampus as a tinnitus generator. Our results further suggest that frontostriatal connectivity may predict the transition from acute to chronic tinnitus, analogous to what is seen in the pain literature. We discuss these ideas and suggest fruitful avenues for future research.

Keywords: connectivity; fMRI; nucleus accumbens; pain; phantom perception; tinnitus.


Conflict of interest statement

The authors declare no competing financial interests.

Figures

Figure 1
Figure 1
Boxplots displaying the summary statistics for the tinnitus patient characteristics and behavioral data. From left to right, the boxplots display age, mean hearing loss (dB HL), the duration of tinnitus symptoms, tinnitus percept loudness (0–10 numeric rating scale), and tinnitus‐related distress (TQ score). The line in the center of each box indicates the mean, the outer lines of each box indicate the interquartile range, and the whiskers indicate the full range of the data excluding any outliers, which are indicated by dots
Figure 2
Figure 2
Ring connectogram summarizing the rsFC between NAc and the rest of the brain parcellated using the AAL2 atlas. The analysis includes covariates for both age and whole‐brain overall rsFC. The two white nodes at six o'clock represent the left and right NAc seed regions in the tinnitus group; the two adjacent black nodes represent the same regions in the control group. The remaining nodes represent AAL2 atlas ROIs separated by hemisphere and then grouped according to the following subdivisions: frontal cortex, cingulate cortex, temporal cortex, parietal cortex, subcortical nuclei, occipital cortex, and the cerebellum. Blue nodes represent frontal ROIs in the right hemisphere; pale blue nodes represent frontal ROIs in the left hemisphere, etc. Note however that the cerebellar vermis ROIs are located at the midline and have been divided between the two cerebellar groups for the sake of symmetry. Bars at each node represent the relative connectivity strength between the NAc seeds/subject groups and each AAL2 ROI. For the sake of legibility, only the upper 30th percentile of edges with connection strengths significant at the FDR‐corrected 0.05 level are displayed [Color figure can be viewed at http://wileyonlinelibrary.com]
Figure 3
Figure 3
Subtraction analysis (TIN > HCP, i.e., tinnitus > controls) of rsFC between left/right NAc and the rest of the brain parcellated using the AAL2 atlas. The analysis includes covariates for both age and whole‐brain overall rsFC. Results are presented as heatmaps that have been separated into columns displaying where rsFC is increased (left; warm colors) or decreased (right; cool colors) in tinnitus subjects relative to controls. Displayed results are significant at the 0.05 level, including the FDR correction for multiple comparisons; results that did not reach significance were manually set to zero (=black) [Color figure can be viewed at http://wileyonlinelibrary.com]
Figure 4
Figure 4
Glass‐brain visualizations of voxelwise rsFC with left/right NAc seed regions. All analyses include age and whole‐brain rsFC as covariates. The within‐group results for the tinnitus and control subjects (top, middle) are presented at height thresholds of p < 0.05 and cluster thresholds of p < 0.05, both including the FDR correction for multiple comparisons. The subtraction analysis (bottom) is presented at a height threshold of p = 0.0001 (uncorrected) and a cluster threshold of 200 voxels. These height thresholds are reflected by the grayed‐out regions of each colorbar. The colorbar range over all subfigures has also been restricted to a maximum height of 40 (F‐statistic) both for the purposes of direct visual comparison and also to better display the overall variance in the data; the true maxima of the subfigures are much higher, owing to the high correlations of the seed regions with the voxels in and around them [Color figure can be viewed at http://wileyonlinelibrary.com]
Figure 5
Figure 5
Scatterplots displaying the NAc‐related rsFC and tinnitus patient characteristics with significant correlations
Figure 6
Figure 6
Scatterplots displaying the NAc‐related rsFC and tinnitus patient characteristics with significant partial correlations, controlling for the effects of age and mean hearing loss. Axes display the standardized residuals in each variable after regressing them onto tinnitus patient age and mean hearing loss

References

    1. Apkarian, A. V. , Hashmi, J. A. , & Baliki, M. N. (2011). Pain and the brain: Specificity and plasticity of the brain in clinical chronic pain. Pain, 152, S49–S64. - PMC - PubMed
    1. Ashburner, J. , & Friston, K. J. (1999). Nonlinear spatial normalization using basis functions. Human Brain Mapping, 7, 254–266. - PMC - PubMed
    1. Baliki, M. N. , Chialvo, D. R. , Geha, P. Y. , Levy, R. M. , Harden, R. N. , Parrish, T. B. , & Apkarian, A. V. (2006). Chronic pain and the emotional brain: Specific brain activity associated with spontaneous fluctuations of intensity of chronic back pain. The Journal of Neuroscience, 26, 12165–12173. - PMC - PubMed
    1. Baliki, M. N. , Petre, B. , Torbey, S. , Herrmann, K. M. , Huang, L. , Schnitzer, T. J. , … Apkarian, A. V. (2012). Corticostriatal functional connectivity predicts transition to chronic back pain. Nature Neuroscience, 15, 1117–1119. - PMC - PubMed
    1. Becerra, L. , & Borsook, D. (2008). Signal valence in the nucleus accumbens to pain onset and offset. European Journal of Pain, 12, 866–869. - PMC - PubMed

Publication types

MeSH terms