. 2021 Oct 1;35(10):775-787.
doi: 10.1089/ars.2018.7594. Epub 2019 Mar 6.

Selenoprotein M Promotes Hypothalamic Leptin Signaling and Thioredoxin Antioxidant Activity

Affiliations

Selenoprotein M Promotes Hypothalamic Leptin Signaling and Thioredoxin Antioxidant Activity

Ting Gong et al. Antioxid Redox Signal. .

Abstract

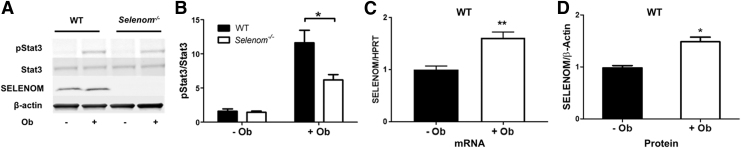
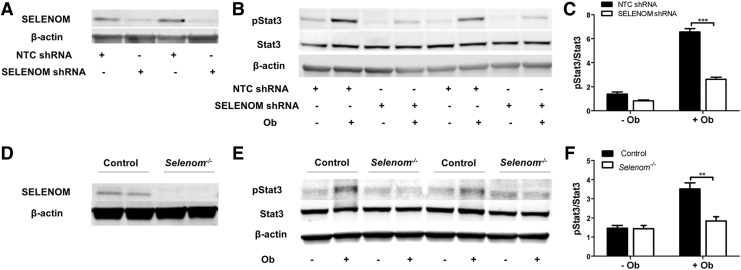
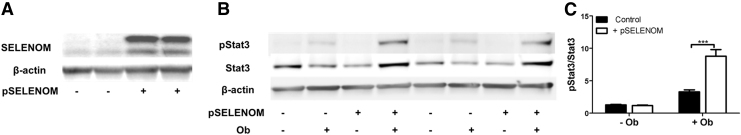
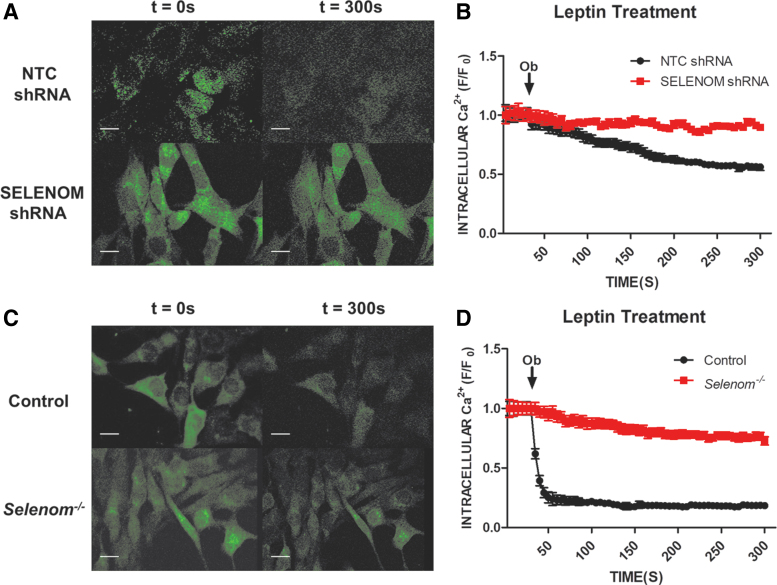
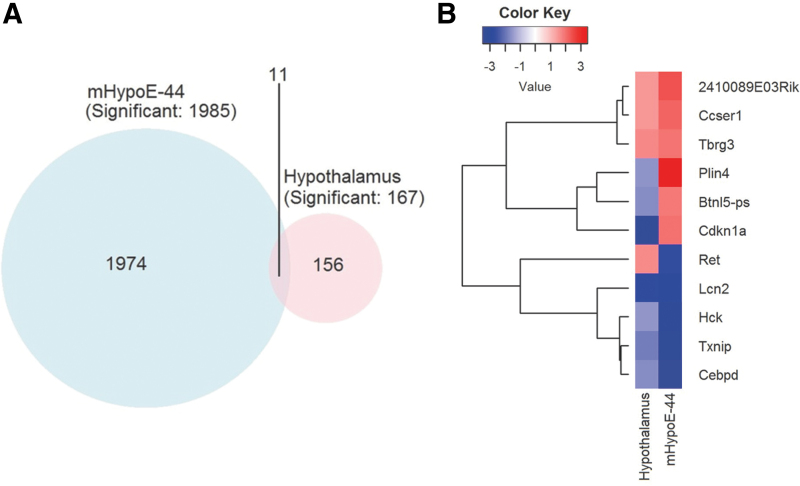
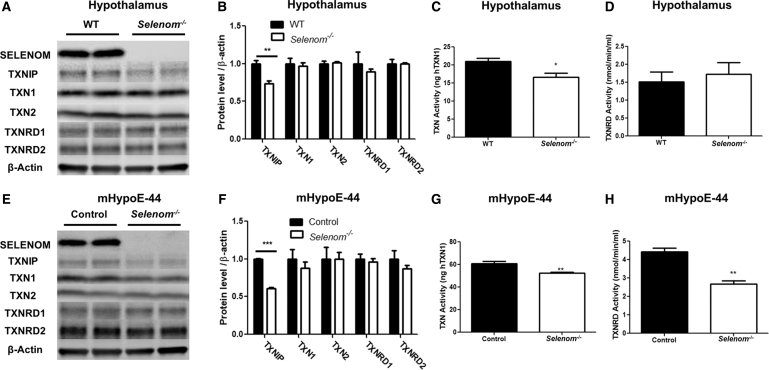
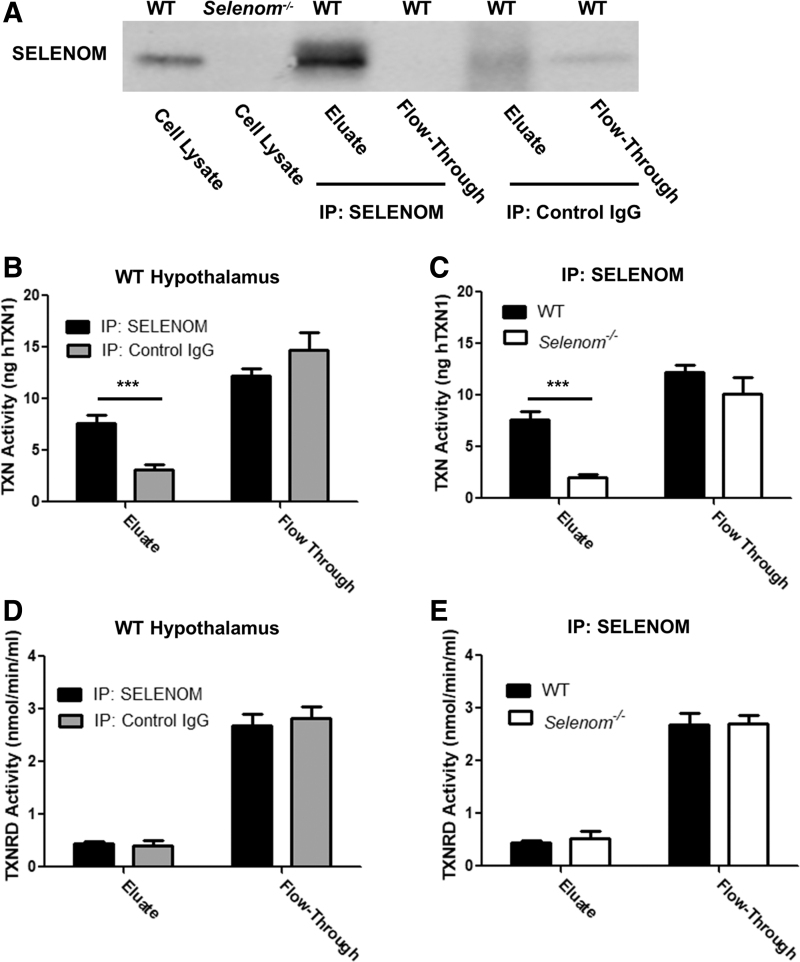
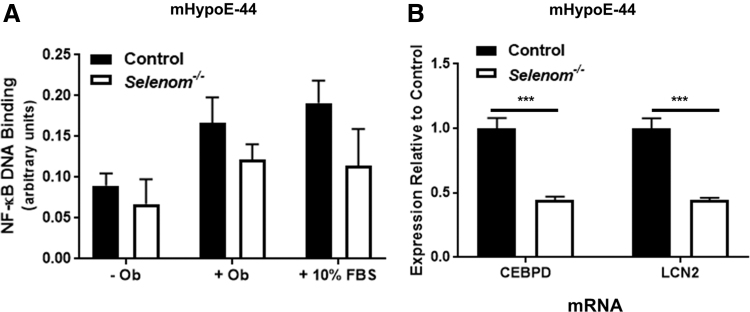
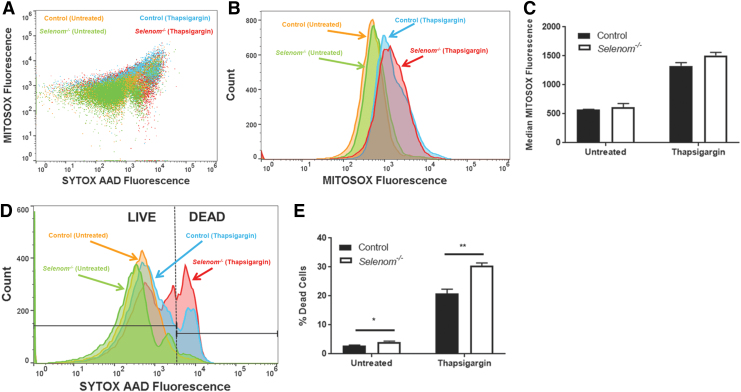
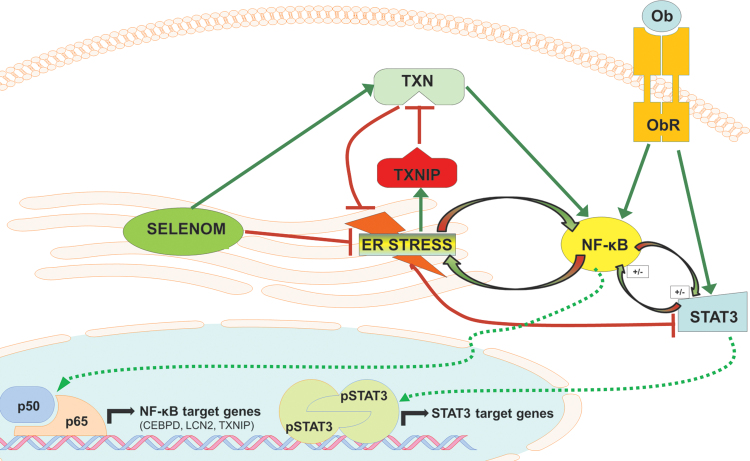
Aims: Selenoproteins are an essential class of proteins involved in redox signaling and energy metabolism. However, the functions of many selenoproteins are not clearly established. Selenoprotein M (SELENOM), an endoplasmic reticulum (ER)-resident oxidoreductase bearing structural similarity to thioredoxin (TXN), is among those yet to be fully characterized. This protein is highly expressed in hypothalamic regions involved in leptin signaling and has been previously linked to energy metabolism. Herein, we performed a series of studies using in vivo and in vitro models to probe the specific influence of SELENOM on hypothalamic leptin signaling and assess SELENOM-regulated pathways. Innovation and Results: Our initial experiment in vivo demonstrated that (i) leptin promotes hypothalamic expression of SELENOM and (ii) leptin-induced STAT3 phosphorylation is impeded by SELENOM deficiency. Additional in vitro studies using mHypoE-44 immortalized hypothalamic neurons corroborated these findings, as SELENOM deficiency obstructed downstream STAT3 phosphorylation and cytosolic calcium responses evoked by leptin treatment. Correspondingly, SELENOM overexpression enhanced leptin sensitivity. Microarray analysis conducted in parallel on hypothalamic tissue and mHypoE-44 cells revealed multiple genes significantly affected by SELENOM deficiency, including thioredoxin interacting protein, a negative regulator of the TXN system. Further analysis determined that (i) SELENOM itself possesses intrinsic TXN activity and (ii) SELENOM deficiency leads to a reduction in overall TXN activity. Finally, mHypoE-44 cells lacking SELENOM displayed diminished activation of the nuclear factor kappa-light-chain enhancer of activated B-cells (NF-κB) signaling pathway and increased susceptibility to ER stress-mediated cell death. Conclusion: In sum, these findings establish SELENOM as a positive regulator of leptin signaling and TXN antioxidant activity in the hypothalamus. Antioxid. Redox Signal. 35, 775-787.

Keywords: endoplasmic reticulum; hypothalamus; leptin; selenoprotein; thioredoxin.


Conflict of interest statement

No competing financial interests exist.

Figures

FIG. 1.
FIG. 1.
SELENOM promotes hypothalamic leptin signaling in vivo. (A) Western blot analysis of leptin-induced signaling in hypothalamic tissue derived from 10-week-old male wild-type and Selenom−/− mice of comparable body weight. Animals were fasted overnight, challenged with an intraperitoneal injection of leptin (Ob) (1 μg leptin/gram body weight), and sacrificed 60 min later (n = 3–4 per group). (B) Two-way ANOVA analysis revealed main effects for leptin (F(1,8) = 53.35, p < 0.001), genotype (F(1,8) = 7.68, p = 0.0242), and a significant interaction (F(1,8) = 6.81, p = 0.0311). Post-tests showed that leptin-induced Stat3 phosphorylation was diminished in Selenom−/− samples (t4 = 3.806, p < 0.05). (C) Leptin treatment elevated SELENOM mRNA levels in WT samples (t8 = 4.628, p = 0.0017). (D) Leptin treatment increased SELENOM protein levels in WT samples (t4 = 3.364, p = 0.0282). *p < 0.05, **p < 0.01 compared with control group. ANOVA, analysis of variance; SELENOM, selenoprotein M; WT, wild type.
FIG. 2.
FIG. 2.
SELENOM deficiency impairs leptin signaling in mHypoE-44 cells. (A) Verification of shRNA-mediated knockdown of SELENOM by Western blot. (B) Western blot analysis of leptin-induced STAT3 signaling in shRNA-treated mHypoE-44 cells. Cells were serum-starved for 4 h and then challenged with 100 nM leptin (Ob) for 45 min. (C) Two-way ANOVA analysis determined significant main effects for leptin (F(1,20) = 144.2, p < 0.001), shRNA (F(1,20) = 342.37, p < 0.001), and a significant interaction (F(1,20) = 80.69, p < 0.001). Post-tests showed that leptin-induced Stat3 phosphorylation was diminished in SELENOM shRNA samples (t10 = 14.84, p < 0.001). (D) Verification of CRISPR/Cas9-mediated ablation of SELENOM by Western blot. (E) Western blot analysis of leptin-induced STAT3 signaling in control and Selenom−/− mHypoE-44 cells. (F) Two-way ANOVA analysis showed main effects for leptin (F(1,12) = 14.77, p = 0.0023), genotype (F(1,12) = 30.46, p < 0.001), and a significant interaction (F(1,12) = 13.73, p = 0.003). Post-tests showed that leptin-induced Stat3 phosphorylation was diminished in Selenom−/− samples (t6 = 5.337, p < 0.01). **p < 0.01, ***p < 0.001 compared with control group. NTC, nontarget control; shRNA, short hairpin RNA.
FIG. 3.
FIG. 3.
SELENOM overexpression promotes leptin signaling in mHypoE-44 cells. (A) Verification of SELENOM overexpression by Western blot. (B) Western blot analysis of leptin-induced STAT3 signaling. (C) Two-way ANOVA analysis revealed main effects for leptin (F(1,20) = 26.16, p < 0.001), pSELENOM (F(1,20) = 83.98, p < 0.01), and a significant interaction (F(1,20) = 28.84, p < 0.001). Post-tests showed that leptin-induced Stat3 phosphorylation was elevated in SELENOM-overexpressing (+pSELENOM) cells (t10 = 7.414, p < 0.001). ***p < 0.001 compared with control group.
FIG. 4.
FIG. 4.
SELENOM deficiency impedes leptin-induced reduction of cytosolic Ca2+ levels in mHypoE-44 cells. (A, C) Confocal images showing cytosolic Ca2+ levels before (t = 0s) and after treatment with leptin (Ob) (t = 300s). (B, D) Both shRNA-mediated knockdown (B) and CRISPR/CAS9-mediated knockout (D) of SELENOM impeded the leptin-induced reduction of cytosolic Ca2+ observed in control samples. Scale bar = 20 μm. Color images are available online.
FIG. 5.
FIG. 5.
Microarray analysis of SELENOM deficiency in hypothalamic tissue and mHypoE-44 cells. (A) Venn diagram (top) showing the number of DEGs determined by the microarray analysis on mHypoE-44 cells and hypothalamic tissue. (B) Eleven DEGs were affected in both hypothalamic tissue and mHypoE44 cells. Heatmap plot (bottom) of these 11 DEGs, with upregulation and downregulation represented by red and blue, respectively. DEGs, differentially expressed genes. Color images ares are available online.
FIG. 6.
FIG. 6.
SELENOM deficiency significantly impacts TXN activity in hypothalamic tissue and mHypoE-44 cells. (A, E) Western blot analysis of the TXN system in hypothalamic tissue (A) and mHypoE-44 cells (E). (B, F) TXNIP protein levels were significantly lower in both tissue (t4 = 4.883, p = 0.0081) (B) and cells (t4 = 19.61, p < 0.001) (F) devoid of SELENOM. (C, G) Levels of TXN activity were reduced by SELENOM deficiency in tissue (t6 = 3.091, p = 0.0214) (C) and cells (t10 = 3.606, p = 0.0048) (G). (D, H) Levels of TXNRD activity were unaffected by SELENOM deficiency in tissue (D), but were significantly diminished in cells (t8 = 6.527, p = 0.0002) (H). *p < 0.05, **p < 0.01, and ***p < 0.001 compared with control group. TXN, thioredoxin; TXNIP, thioredoxin interacting protein; TXNRD, thioredoxin reductase.
FIG. 7.
FIG. 7.
SELENOM has intrinsic TXN activity. (A) Western blot analysis of hypothalamic tissue samples immunoprecipitated with antibodies against SELENOM and control IgG (negative control). Immunoprecipitation with the SELENOM antibody resulted in enriched levels of SELENOM in the eluate fraction and SELENOM depletion in the flow-through fraction. (B) SELENOM-immunoprecipitated WT samples displayed higher levels of TXN activity relative to WT samples immunoprecipitated with control IgG (t6 = 4.537, p = 0.0039). (C) SELENOM-immunoprecipitated WT samples exhibited higher levels of TXN activity than those derived from Selenom−/− mice (t6 = 6.328, p = 0.0007). (D) Levels of TXNRD activity were comparable in WT samples immunoprecipitated with antibodies against SELENOM and control IgG. (E) TXNRD activity levels were similar in SELENOM-immunoprecipitated samples from WT and Selenom−/− mice. ***p < 0.001 compared with control group. IgG, Immunoglobin G.
FIG. 8.
FIG. 8.
SELENOM promotes NF-κB activation in mHypoE-44 cells. (A) NF-κB DNA binding activity was significantly impacted by both genotype (F(1,18) = 7.961, p = 0.0113) and treatment (F(2,18) = 7.453, p = 0.0044). Selenom−/− cells showed lower levels of NF-κB activation across all treatment conditions. (B) Levels of CEBPD (t10 = 6.574, p < 0.001) and LCN2 mRNA (t10 = 6.837, p < 0.001) were significantly reduced in Selenom−/− cells. ***p < 0.001 compared with control group. CEBPD, CCAAT/enhancer-binding protein delta; LCN2, lipocalin 2; NF-κB, nuclear factor kappa-light-enhancer of activated B-cells.
FIG. 9.
FIG. 9.
SELENOM protects against Tg-mediated ER stress in mHypoE-44 cells. (A) Representative flow cytometry dot plots measuring mtROS (MITOSOX) and cell death (SYTOX AAD). (B) Representative histogram for MITOSOX fluorescence. (C) Two-way ANOVA analysis revealed a significant main effect of Tg treatment (F(1,12) = 255.3, p < 0.0001) on mtROS levels, whereas the overall influence of genotype approached statistical significance (F(1,12) = 4.54, p = 0.0545). (D), Representative histogram for SYTOX AAD fluorescence. (E) Cell death was significantly affected by both Tg treatment (F(1,12) = 89.88, p < 0.0001) and genotype (F(1,12) = 5383, p < 0.0001). The genotype × treatment interaction was also significant (F(1,12) = 3.037, p = 0.0006). Post-tests determined that Selenom−/− cells had a significantly higher proportion of cell death relative to controls both in the untreated condition (t6 = 4.143, p = 0.012) and in response to Tg (t6 = 5.49, p = 0.003). *p < 0.05, **p < 0.01 compared with control group. ER, endoplasmic reticulum; mtROS, mitochondrial ROS; SYTOX AAD, SYTOX AAdvanced; Tg, thapsigargin. Color images are available online.
FIG. 10.
FIG. 10.
Hypothalamic SELENOM promotes ER homeostasis and TXN activity. SELENOM enhances activity of the TXN system, which serves to attenuate ER stress and facilitate activation of the NF-κB pathway. Leptin also promotes NF-κB activation in parallel with its documented effect on STAT3 signaling. On stimulation, both NF-κB and STAT3 translocate to the nucleus and act as transcription factors on a host of target genes. CEBPD, LCN2, and TXNIP comprise NF-κB target genes that are significantly downregulated by SELENOM deficiency. Color images are available online only.

Similar articles

Cited by

References

    1. Arner ES and Holmgren A. Physiological functions of thioredoxin and thioredoxin reductase. Eur J Biochem 267: 6102–6109, 2000. - PubMed
    1. Bjorbaek C, El-Haschimi K, Frantz JD, and Flier JS. The role of SOCS-3 in leptin signaling and leptin resistance. J Biol Chem 274: 30059–30065, 1999. - PubMed
    1. Blouet C, Liu SM, Jo YH, Chua S, and Schwartz GJ. TXNIP in Agrp neurons regulates adiposity, energy expenditure, and central leptin sensitivity. J Neurosci 32: 9870–9877, 2012. - PMC - PubMed
    1. Blouet C and Schwartz GJ. Nutrient-sensing hypothalamic TXNIP links nutrient excess to energy imbalance in mice. J Neurosci 31: 6019–6027, 2011. - PMC - PubMed
    1. Bollrath J and Greten FR. IKK/NF-kappaB and STAT3 pathways: central signalling hubs in inflammation-mediated tumour promotion and metastasis. EMBO Rep 10: 1314–1319, 2009. - PMC - PubMed

Publication types