

Descriptive statistics and normality tests for statistical data
- PMID: 30648682
- PMCID: PMC6350423
- DOI: 10.4103/aca.ACA_157_18
Descriptive statistics and normality tests for statistical data
Abstract
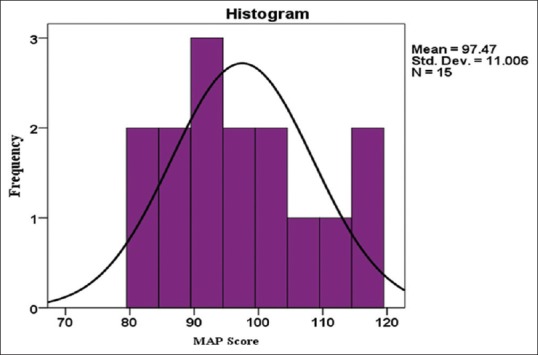
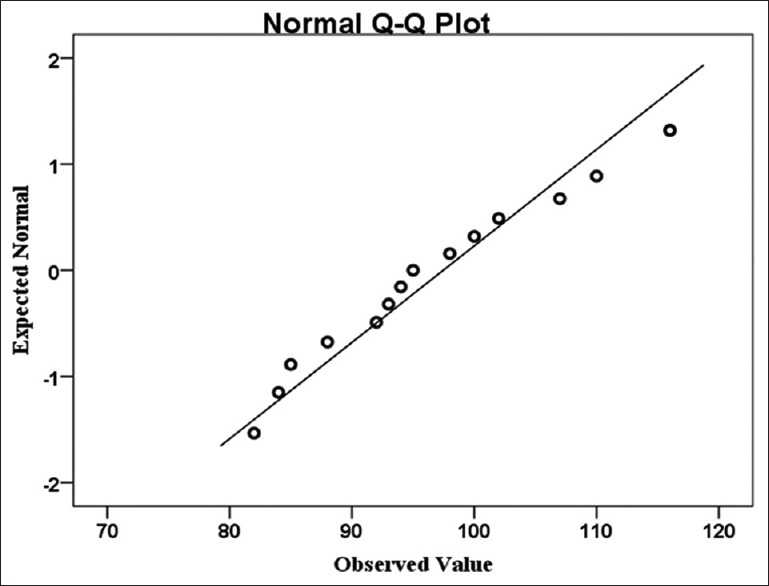
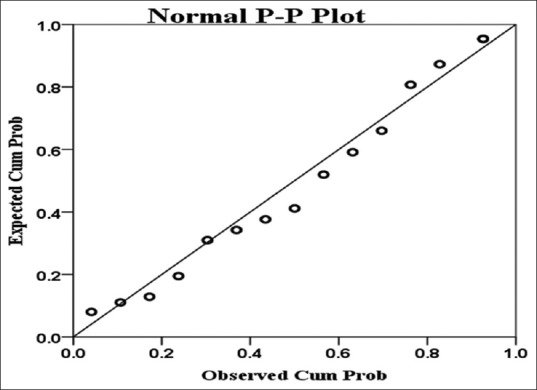
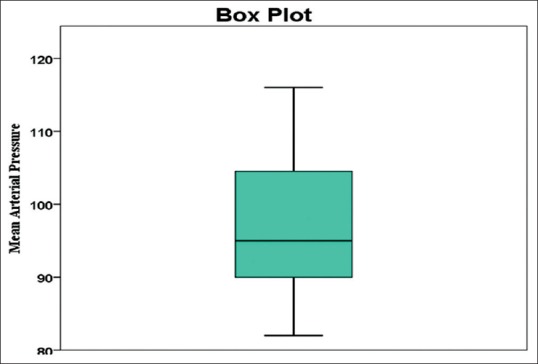
Descriptive statistics are an important part of biomedical research which is used to describe the basic features of the data in the study. They provide simple summaries about the sample and the measures. Measures of the central tendency and dispersion are used to describe the quantitative data. For the continuous data, test of the normality is an important step for deciding the measures of central tendency and statistical methods for data analysis. When our data follow normal distribution, parametric tests otherwise nonparametric methods are used to compare the groups. There are different methods used to test the normality of data, including numerical and visual methods, and each method has its own advantages and disadvantages. In the present study, we have discussed the summary measures and methods used to test the normality of the data.
Keywords: Biomedical research; descriptive statistics; numerical and visual methods; test of normality.
Conflict of interest statement
None
Figures
References
-
- Lund Research Ltd. Descriptive and Inferential Statistics. [Last accessed on 2018 Aug 02]. Available from: http://www.statistics.laerd.com .
-
- Sundaram KR, Dwivedi SN, Sreenivas V. 2nd ed. New Delhi: Wolters Kluwer India; 2014. Medical Statistics: Principles and Methods.
-
- Bland M. 4th ed. Oxford: Oxford University Press; 2015. An Introduction to Medical Statistics.
-
- Campbell MJ, Machin D, Walters SJ. 4th ed. Chichester: John Wiley & Sons, Ltd; 2007. Medical Statistics: A text book for the health sciences.
MeSH terms
LinkOut - more resources
Full Text Sources
Medical