

COmplexome Profiling ALignment (COPAL) reveals remodeling of mitochondrial protein complexes in Barth syndrome
- PMID: 30649188
- PMCID: PMC6735710
- DOI: 10.1093/bioinformatics/btz025
COmplexome Profiling ALignment (COPAL) reveals remodeling of mitochondrial protein complexes in Barth syndrome
Abstract
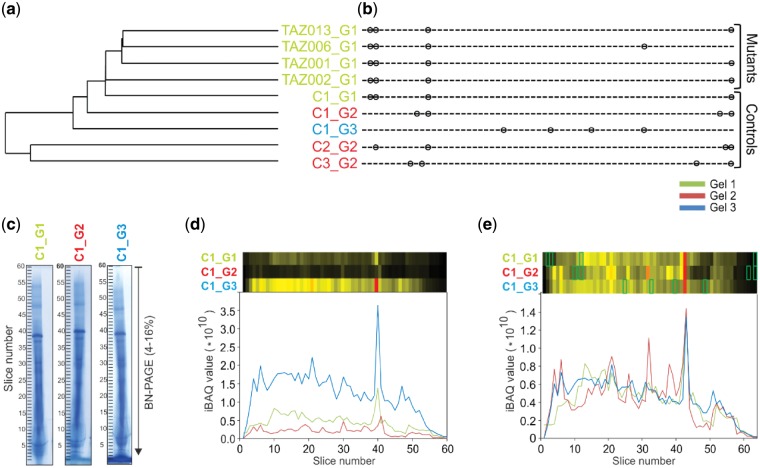
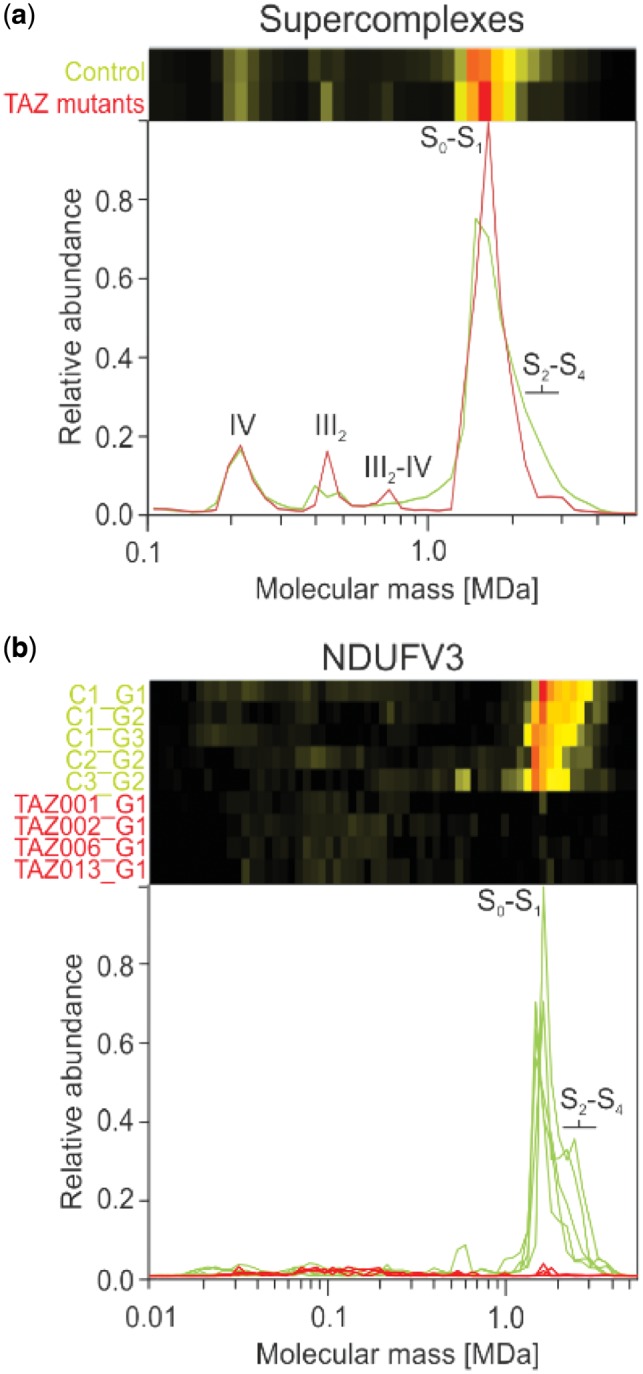
Motivation: Complexome profiling combines native gel electrophoresis with mass spectrometry to obtain the inventory, composition and abundance of multiprotein assemblies in an organelle. Applying complexome profiling to determine the effect of a mutation on protein complexes requires separating technical and biological variations from the variations caused by that mutation.
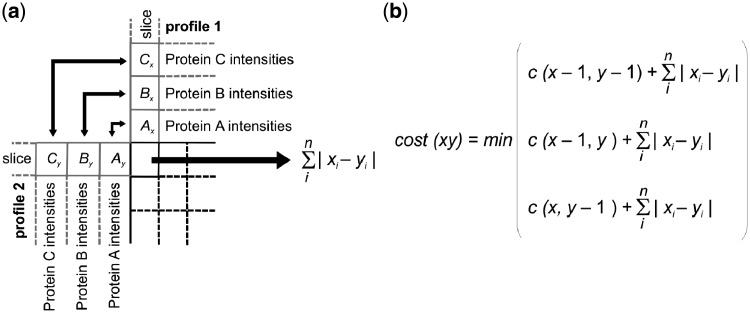
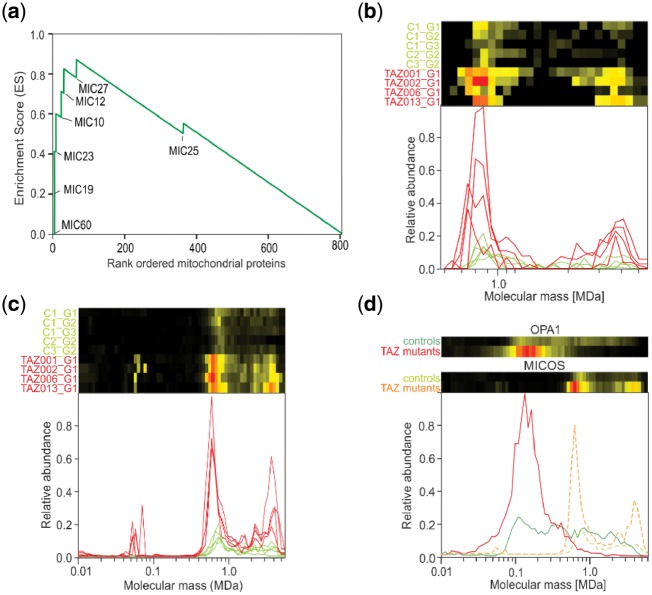
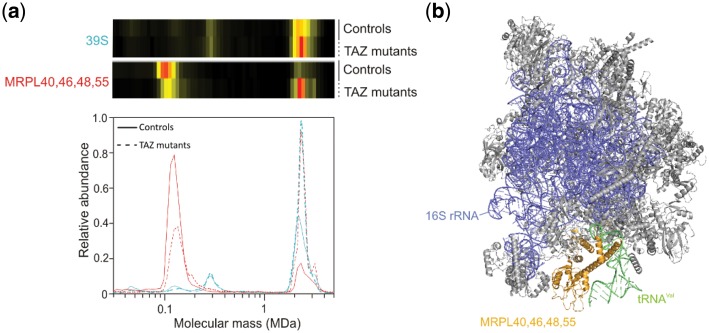
Results: We have developed the COmplexome Profiling ALignment (COPAL) tool that aligns multiple complexome profiles with each other. It includes the abundance profiles of all proteins on two gels, using a multi-dimensional implementation of the dynamic time warping algorithm to align the gels. Subsequent progressive alignment allows us to align multiple profiles with each other. We tested COPAL on complexome profiles from control mitochondria and from Barth syndrome (BTHS) mitochondria, which have a mutation in tafazzin gene that is involved in remodeling the inner mitochondrial membrane phospholipid cardiolipin. By comparing the variation between BTHS mitochondria and controls with the variation among either, we assessed the effects of BTHS on the abundance profiles of individual proteins. Combining those profiles with gene set enrichment analysis allows detecting significantly affected protein complexes. Most of the significantly affected protein complexes are located in the inner mitochondrial membrane (mitochondrial contact site and cristae organizing system, prohibitins), or are attached to it (the large ribosomal subunit).
Availability and implementation: COPAL is written in python and is available from http://github.com/cmbi/copal.
Supplementary information: Supplementary data are available at Bioinformatics online.
© The Author(s) 2019. Published by Oxford University Press.
Figures
Similar articles
-
Barth syndrome cells display widespread remodeling of mitochondrial complexes without affecting metabolic flux distribution.Biochim Biophys Acta Mol Basis Dis. 2018 Nov;1864(11):3650-3658. doi: 10.1016/j.bbadis.2018.08.041. Epub 2018 Sep 1. Biochim Biophys Acta Mol Basis Dis. 2018. PMID: 30251684
-
Mitochondrial Complexome Profiling.Methods Mol Biol. 2021;2192:269-285. doi: 10.1007/978-1-0716-0834-0_19. Methods Mol Biol. 2021. PMID: 33230779
-
Complexome Profiling of Plant Mitochondrial Fractions.Methods Mol Biol. 2022;2363:101-110. doi: 10.1007/978-1-0716-1653-6_9. Methods Mol Biol. 2022. PMID: 34545489
-
Mitochondrial dysfunctions in barth syndrome.IUBMB Life. 2019 Jul;71(7):791-801. doi: 10.1002/iub.2018. Epub 2019 Feb 11. IUBMB Life. 2019. PMID: 30746873 Free PMC article. Review.
-
Complexome Profiling-Exploring Mitochondrial Protein Complexes in Health and Disease.Front Cell Dev Biol. 2022 Jan 12;9:796128. doi: 10.3389/fcell.2021.796128. eCollection 2021. Front Cell Dev Biol. 2022. PMID: 35096826 Free PMC article. Review.
Cited by
-
Let's make it clear: systematic exploration of mitochondrial DNA- and RNA-protein complexes by complexome profiling.Nucleic Acids Res. 2023 Oct 27;51(19):10619-10641. doi: 10.1093/nar/gkad697. Nucleic Acids Res. 2023. PMID: 37615582 Free PMC article.
-
The cytochrome b carboxyl terminal region is necessary for mitochondrial complex III assembly.Life Sci Alliance. 2023 Apr 24;6(7):e202201858. doi: 10.26508/lsa.202201858. Print 2023 Jul. Life Sci Alliance. 2023. PMID: 37094942 Free PMC article.
-
Translation Fidelity and Respiration Deficits in CLPP-Deficient Tissues: Mechanistic Insights from Mitochondrial Complexome Profiling.Int J Mol Sci. 2023 Dec 15;24(24):17503. doi: 10.3390/ijms242417503. Int J Mol Sci. 2023. PMID: 38139332 Free PMC article.
-
Unbiased complexome profiling and global proteomics analysis reveals mitochondrial impairment and potential changes at the intercalated disk in presymptomatic R14Δ/+ mice hearts.PLoS One. 2024 Oct 24;19(10):e0311203. doi: 10.1371/journal.pone.0311203. eCollection 2024. PLoS One. 2024. PMID: 39446877 Free PMC article.
-
Structures and functions of the MICOS: Pathogenesis and therapeutic implications in Alzheimer's disease.Acta Pharm Sin B. 2025 Jun;15(6):2966-2984. doi: 10.1016/j.apsb.2025.04.019. Epub 2025 Apr 22. Acta Pharm Sin B. 2025. PMID: 40654371 Free PMC article. Review.
References
-
- Chatzispyrou I.A. et al. (2018) Barth syndrome cells display widespread remodeling of mitochondrial complexes without affecting metabolic flux distribution. Biochim. Biophys. Acta, 1864, 3650–3658. - PubMed
