. 2019 Apr 8;47(6):2932-2945.
doi: 10.1093/nar/gky1319.

Broad range of missense error frequencies in cellular proteins

Affiliations

Broad range of missense error frequencies in cellular proteins

Raffaella Garofalo et al. Nucleic Acids Res. .

Abstract

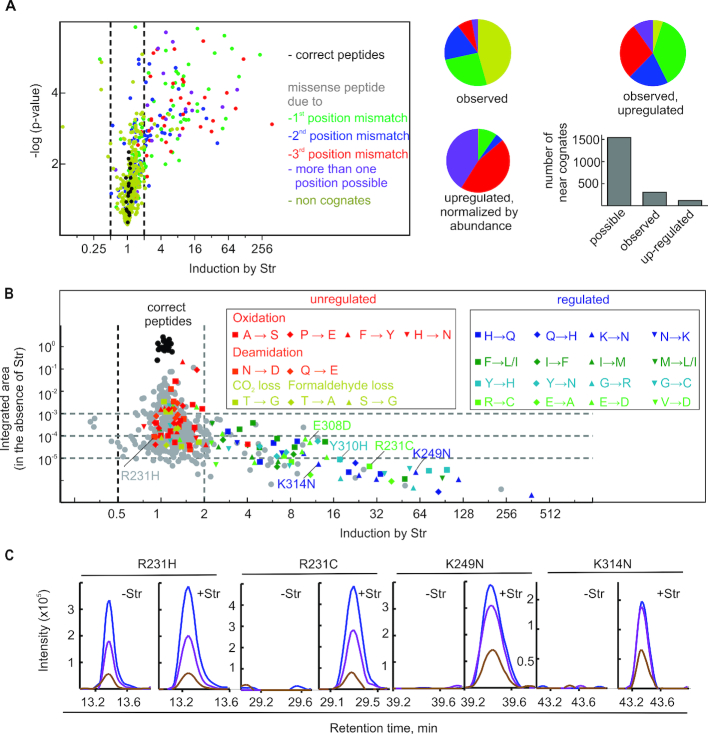
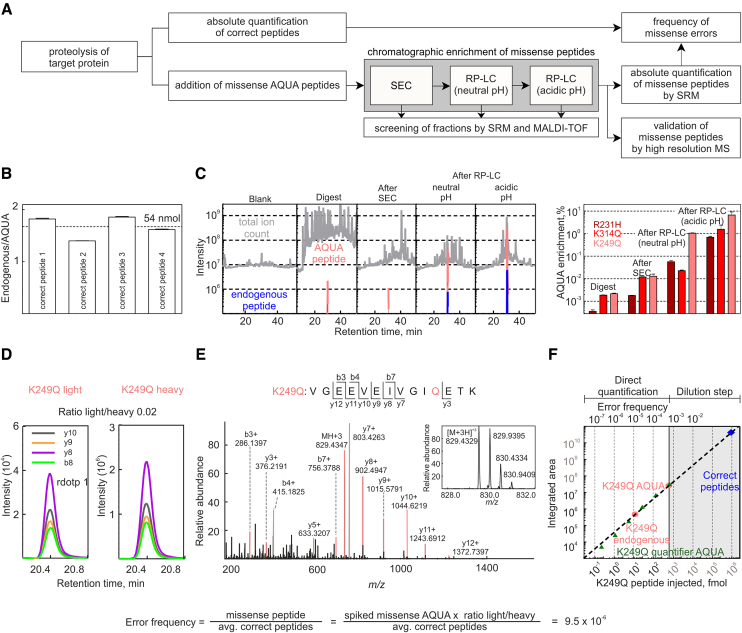
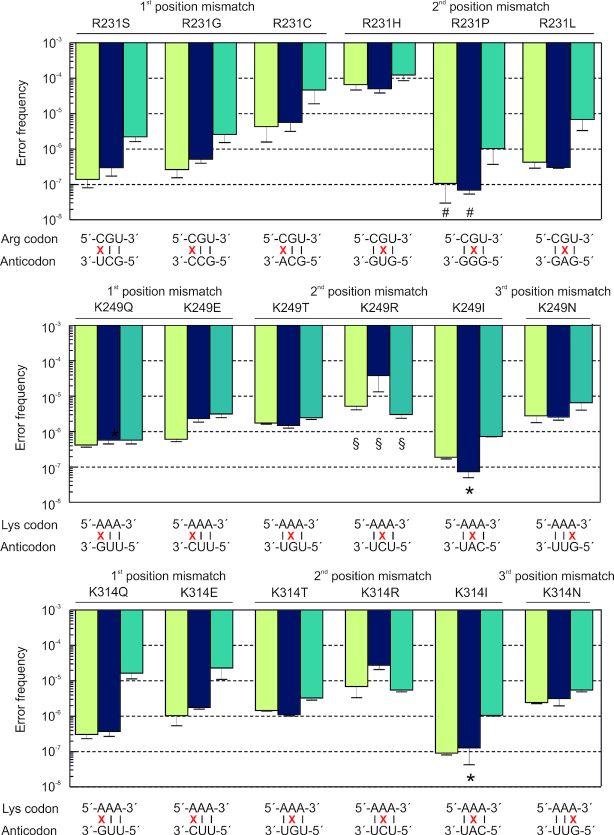
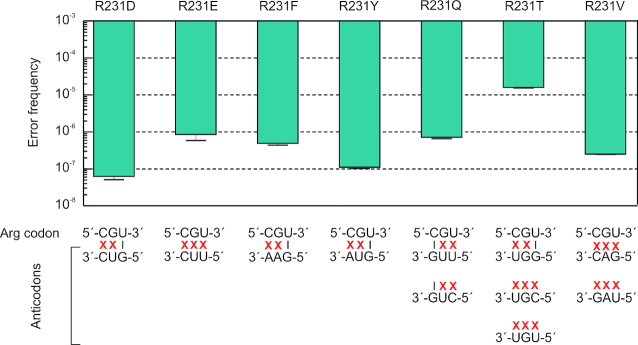
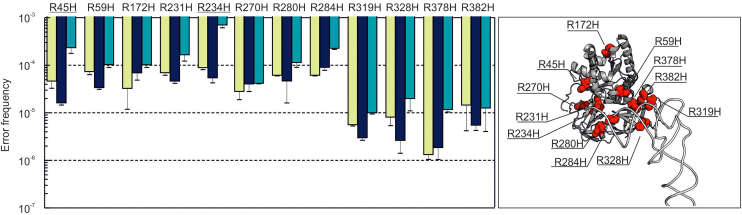
Assessment of the fidelity of gene expression is crucial to understand cell homeostasis. Here we present a highly sensitive method for the systematic Quantification of Rare Amino acid Substitutions (QRAS) using absolute quantification by targeted mass spectrometry after chromatographic enrichment of peptides with missense amino acid substitutions. By analyzing incorporation of near- and non-cognate amino acids in a model protein EF-Tu, we show that most of missense errors are too rare to detect by conventional methods, such as DDA, and are estimated to be between <10-7-10-5 by QRAS. We also observe error hotspots of up to 10-3 for some types of mismatches, including the G-U mismatch. The error frequency depends on the expression level of EF-Tu and, surprisingly, the amino acid position in the protein. QRAS is not restricted to any particular miscoding event, organism, strain or model protein and is a reliable tool to analyze very rare proteogenomic events.


Figures

Figure 1.
Figure 1.
Estimation of cellular error frequencies by DDA. (A) Str-induced missense peptides. The miscoding events leading to the respective amino acid substitutions are classified by the number of mismatches in the codon–anticodon helix: no mismatch, correct (black); one mismatch, near-cognate (green, blue, red; dependent on the position of the mismatch); if more than one particular mismatch can lead to the substitution (violet), or non-cognate (ocher) with two or three mismatches. Left panel, the volcano plot and statistical analysis are based on the integrated peak areas in four technical replicates (±4 μM Str) and a one tailored t-test. Right panel, pie diagrams: ratio of near- and non-cognates on the basis of the EF-Tu peptides included in the DDA analysis. Bar graph: number of near-cognate substitutions based on the EF-Tu peptides included in the DDA analysis. (B) Estimation of error frequencies in cells in the absence of Str. Integrated areas for amino acid subsitutions were normalized by the median of the integrated areas of the correct tryptic EF-Tu peptides. Identical time windows after retention time alignment between the runs were chosen for integration. For strong Str-induction this can lead to integration over noise in the absence of Str leading to error frequencies beyond the dynamic range of the mass spectrometer (see figure C). Left box: unregulated identifications that are isobaric to common artefacts. Right box: Amino acid substitutions that are consistently upregulated by Str. (C) Extracted molecular ion isotope peaks of selected missense peptides after MS1 filtering: with and without Str as indicated; M (blue), M+1 (violet), M+2 (brown).
Figure 2.
Figure 2.
QRAS workflow. (A) Schematic of QRAS workflow. (B) Quantification of correct peptides. Four tryptic peptides are quantified using highly quantified AQUA peptides (guaranteed concentration error <5%). Their mean concentration and the volume of the digest are used to calculate the amount of proteolysed EF-Tu. (C) Reduction of sample complexity. MS runs of the digest and K249Q missense peptide containing fractions after each enrichment step (left panel). Total ion current (TIC) is shown in grey, extracted ion chromatograms (XIC) of the enriched AQUA are in red and the endogenous peptide is in blue (two most abundant charge states with their 3 most abundant ions, extracted with 10ppm resolution). Bar graph (right panel) shows the contribution of the integrated XICs to the integrated TIC. Error bars represent the standard deviation of three technical replicates. (D) Quantification of missense peptide in the sample relative to the AQUA peptide by SRM analysis. The perfect co-elution and identical fragmentation pattern as the missense AQUA peptide are reflected in the ratio dot product (the vector product of the elution pattern of endogenous and AQUA peptides). (E) High resolution MS/MS spectra of the endogenous missense peptide; inset: corresponding MS spectrum. (F) Linear dynamic range of the K249Q quantification. To determine the dynamic range, a second quantifier AQUA peptide (dark green) sharing same sequence but having an additional isotope-label was titrated. Injected amounts of AQUA peptides as indicated.
Figure 3.
Figure 3.
Error frequencies of near-cognate misreading at three individual positions. Green bars, wild type chromosome-encoded EF-Tu from MRE600; blue bars, chromosome-encoded EF-Tu carrying a C-terminal His-tag (K12 strain); teal bars, plasmid-encoded EF-Tu overexpressed in BL21(DE3). Error bars represent the standard deviation of 3–5 biological replicates. For some amino acid substitutions a quantification was not possible and the bars represent an upper limit: * the endogenous peptide was too rare to be detected; # contaminations in the AQUA peptide masked the endogenous peptide; or § there were interferences even after multidimensional enrichment.
Figure 4.
Figure 4.
Error frequencies of non-cognate decoding at R231 in plasmid-encoded EF-Tu overexpressed in E. coli BL21(DE3). Error bars represent the standard deviation of three biological replicates.
Figure 5.
Figure 5.
Position dependence of R to H substitutions in EF-Tu. Left panel: Error frequencies. Green bars, wild type chromosome-encoded EF-Tu from MRE600; blue bars, chromosome-encoded EF-Tu carrying a C-terminal His-tag (K12 strain); teal bars, plasmid-encoded EF-Tu overexpressed in BL21(DE3). Error bars represent the standard deviation of 3–6 biological replicates. Most of the R→H errors included in the analysis result from reading the 5′-CGT-3′Arg codon except for R45H and R234H substitutions (underlined) that occur on the 5′-CGC-3′ codon. Right panel: The positions of the substitutions are shown in the structure of EF-Tu in the complex with tRNAPhe (PDB file 1OB2).

References

    1. Drummond D.A., Wilke C.O.. The evolutionary consequences of erroneous protein synthesis. Nat. Rev. Genet. 2009; 10:715–724. - PMC - PubMed
    1. Frederico L.A., Kunkel T.A., Shaw B.R.. A sensitive genetic assay for the detection of cytosine deamination: Determination of rate constants and the activation energy. Biochemistry. 1990; 29:2532–2537. - PubMed
    1. Pakula A.A., Sauer R.T.. Genetic analysis of protein stability and function. Annu. Rev. Genet. 1989; 23:289–310. - PubMed
    1. Tokuriki N., Tawfik D.S.. Chaperonin overexpression promotes genetic variation and enzyme evolution. Nature. 2009; 459:668–673. - PubMed
    1. Stefani M., Dobson C.M.. Protein aggregation and aggregate toxicity: New insights into protein folding, misfolding diseases and biological evolution. J Mol. Med. (Berl.). 2003; 81:678–699. - PubMed

Publication types

MeSH terms