. 2019 Feb 28;47(4):1653-1670.
doi: 10.1093/nar/gkz007.

Single cell analysis reveals the involvement of the long non-coding RNA Pvt1 in the modulation of muscle atrophy and mitochondrial network

Affiliations

Single cell analysis reveals the involvement of the long non-coding RNA Pvt1 in the modulation of muscle atrophy and mitochondrial network

Enrico Alessio et al. Nucleic Acids Res. .

Abstract

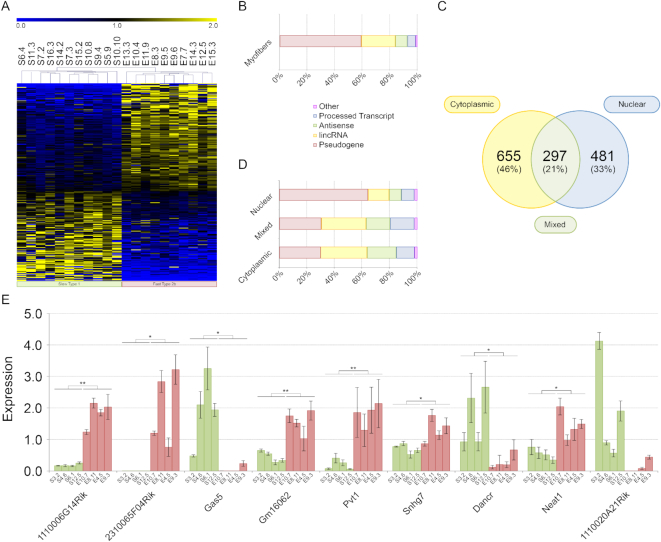
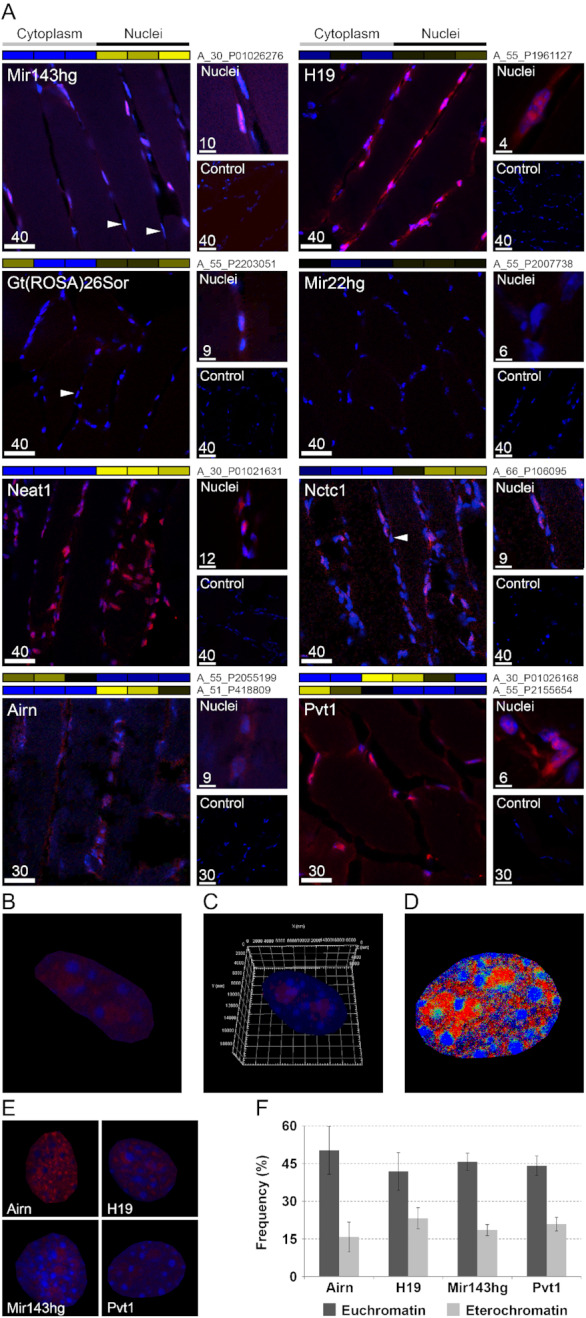
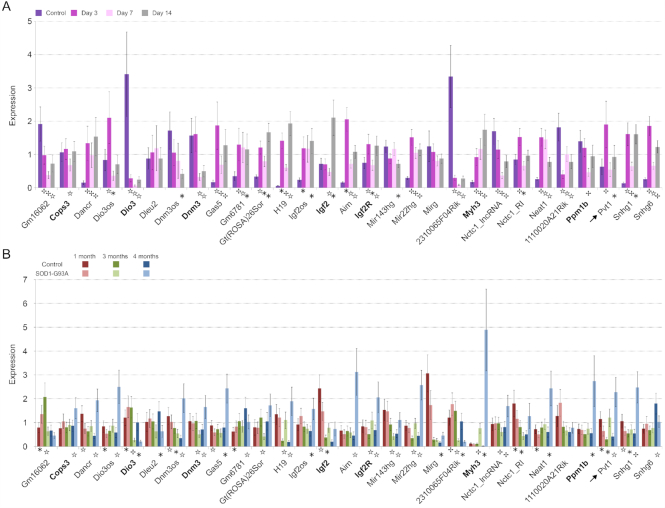
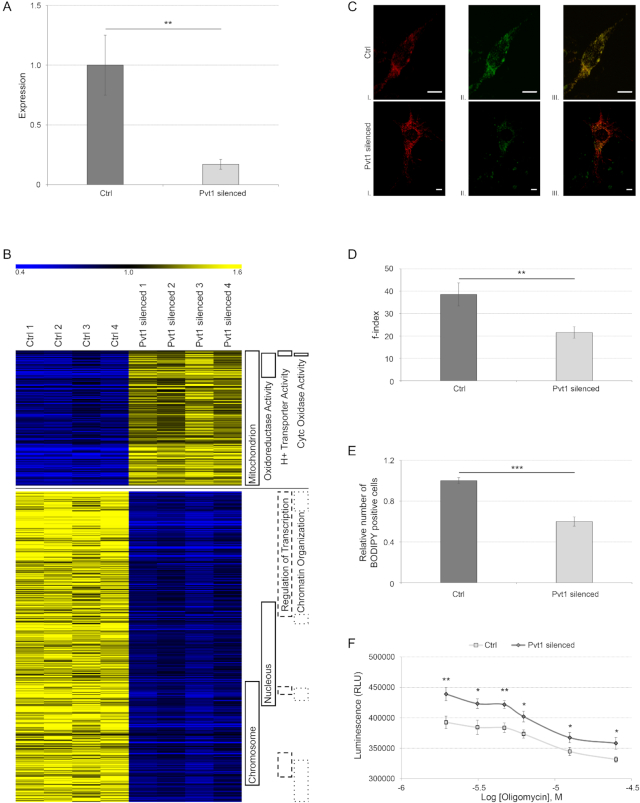
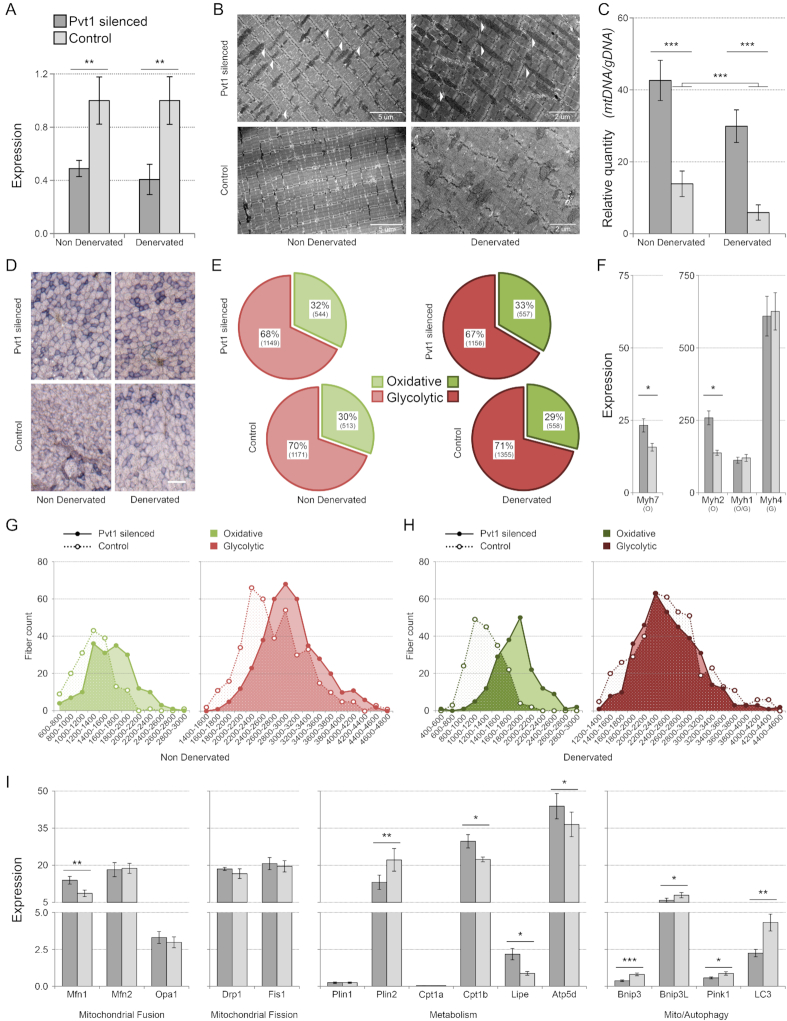
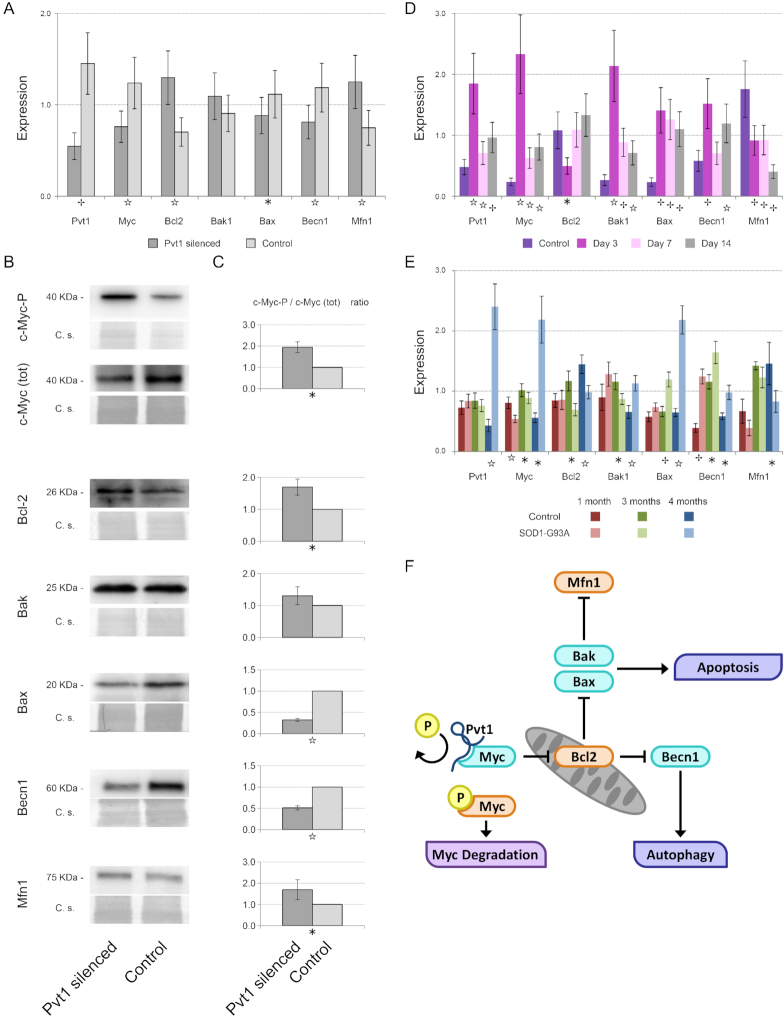
Long non-coding RNAs (lncRNAs) are emerging as important players in the regulation of several aspects of cellular biology. For a better comprehension of their function, it is fundamental to determine their tissue or cell specificity and to identify their subcellular localization. In fact, the activity of lncRNAs may vary according to cell and tissue specificity and subcellular compartmentalization. Myofibers are the smallest complete contractile system of skeletal muscle influencing its contraction velocity and metabolism. How lncRNAs are expressed in different myofibers, participate in metabolism regulation and muscle atrophy or how they are compartmentalized within a single myofiber is still unknown. We compiled a comprehensive catalog of lncRNAs expressed in skeletal muscle, associating the fiber-type specificity and subcellular location to each of them, and demonstrating that many lncRNAs can be involved in the biological processes de-regulated during muscle atrophy. We demonstrated that the lncRNA Pvt1, activated early during muscle atrophy, impacts mitochondrial respiration and morphology and affects mito/autophagy, apoptosis and myofiber size in vivo. This work corroborates the importance of lncRNAs in the regulation of metabolism and neuromuscular pathologies and offers a valuable resource to study the metabolism in single cells characterized by pronounced plasticity.


Figures

Figure 1.
Figure 1.
Genome wide analysis of lncRNAs. (A) Heat map of lncRNA expression in single myofibers. Initials for myofibers indicate: the muscle source (S = soleus; E = EDL), the myofiber number and the mouse number (separated by a dot). (B) Categorization of differentially expressed lncRNAs between fast and slow myofibers. About 80% were pseudogenes and lincRNAs. (C) Subcellular localization of lncRNAs extracted from nuclear or cytoplasmic fractions of myofibers from soleus, EDL and TA. A total of 46% of lncRNAs were cytoplasmic, 33% nuclear and 21% showed a specific localization that changes in relation to the muscle source or lncRNA isoform. (D) Categorization of lncRNAs localized in the nucleous or in the cytoplasm of myofibers purified from soleus, EDL and TA. Most lncRNAs with cytoplasmic or mixed localization were pseudogenes (∼30%) or (lincRNAs; ∼33%). Nuclear fraction was enriched with pseudogenes while lincRNAs represented ∼15% and antisense ∼9%. (E) qPCR for nine lncRNAs. Histograms represent expression value relative to the average expression of the gene among samples. Standard deviation for three technical replicates is indicated. Txn1 was used as control gene. Symbols for myofibers are as described in (A) such as color coding for fast and slow myofibers. The statistical significance between the two groups of myofibers was computed using analysis of variance Student t-test for two-tailed distribution and unequal variance. * P ≤ 5 × 10⁻², ** P ≤ 1 × 10⁻².
Figure 2.
Figure 2.
FISH of lncRNAs. (A) FISH on TA slices for selected lncRNAs. Labeled antisense strands of lncRNA probes were used as controls. Heat maps associated to each FISH images represent the results of genome wide analysis of lncRNA subcellular localization in TA myofibers. Names of microarray probes are listed near the heat map, where two names are present, it means that two different probes identified the same lncRNA in the microarray. Labels ‘Cytoplasm’ and ‘Nuclei’ indicate the cellular compartment where the signal of the probe was measured (blue = low expression; yellow = high expression). Arrows indicate examples of nuclei in the same myofiber that respond differently for the staining of some lncRNAs. Scale bar lengths are expressed in μm. (B) Enlarged FISH image of myonucleus positive for Pvt1 probe. (C) 3D reconstruction of a nucleus labeled for Pvt1 (red) and with DAPI (blue) (see also Supplemental Video S1). (D) Co-localization map. Pixels were colored in red where Pvt1 showed high expression, in blue when DAPI produced strong staining and in green when both had high staining. Co-localization (green) is underrepresented compared to individual Pvt1 or DAPI staining indicating that Pvt1 localizes in euchromatic regions. (E) Example of nuclei positively responding to probes for the lncRNAs Airn, H19, Mir143hg and Pvt1. (F) Frequency of high staining for lncRNA (red) in association with chromatin state (blue intensity). Chromatin state can be evidenced by DAPI staining. Dense areas of condensed chromatin (heterochromatin) correspond to DAPI-brighter regions. Airn, H19, Mir143hg and Pvt1 prevalently localized in euchromatic regions. Standard deviation was calculated on ∼20 nuclei per lncRNA.
Figure 3.
Figure 3.
Expression of lncRNAs during muscle atrophy. Histograms represent expression values relative to the average expression of the gene among samples. Tbp was used as control gene. (A) Expression during denervation. Analyses were performed on gastrocnemius and a pool of RNAs extracted from controlateral non-denervated muscle was used as control. (B) Expression during ALS progression. As for denervated muscles gastrocnemius was used and transgenic mice with non-mutated human SOD1 gene were used as controls. Coding genes sharing the genomic location of the lncRNAs that are reported on their right side in the graph are indicated in bold. Arrows indicate Pvt1. Standard deviation among three biological and two technical replicates is indicated. The statistical significance between considered time points was computed using analysis of variance Student t-test for two-tailed distribution and unequal variance. * P ≤ 5 × 10⁻², ☆ P ≤ 1 × 10⁻², P ≤ 1 × 10⁻³.
Figure 4.
Figure 4.
In vitro analysis of Pvt1 function. (A) Relative gene expression of Pvt1 in C2C12 cells transfected with control GapmeRs or with Pvt1 specific GapmeRs. Standard deviation is calculated among four biological replicates represented on the part B of this figure and two technical replicates per biological sample. Statistical significance was calculated according Student’s t-test between the two groups of cells with a two-tailed distribution and unequal variance; ** P ≤ 1 × 10⁻². (B) Heat map of differentially expressed genes after Pvt1 silencing in C2C12 cells. On the right are indicated functional categories for genes represented. Up-regulated genes in Pvt1 silenced cells were involved in mitochondrial metabolism and respiration, while down-regulated genes were associated to transcription regulation. (C) Representative microscopy images of single C2C12 cells with different levels of mitochondrial fragmentation (I). Mitochondria were stained with Mito-RFP and imaged by confocal fluorescence microscopy. Images of each cell were captured at different focal depths and then processed. Cells were also stained with BODIPY (II) evidencing that after Pvt1 silencing BODIPY staining is less intense than control. Mito-RFP and BODIPY staining were merged (III). Scale bar represents 8 μm. (D) Quantization of mitochondrial fragmentation index. After Pvt1 silencing, mitochondrial fragmentation decreases indicating that mitochondria are more interconnected. Standard deviation was calculated from at least 50 different cells; ** P ≤ 1 × 10⁻³. (E) Relative cell count stained with BODIPY. A lower number of cells (50%) was stained with BODIPY when Pvt1 was down-regulated. Standard deviation was calculated from four different biological replicates; *** P ≤ 1 × 10⁻⁴. (F) ATP production in C2C12 cells treated with decreasing concentration of oligomycin. After Pvt1 silencing the ATP production was higher than in controls; * P ≤ 3 × 10⁻², ** P ≤ 6 × 10⁻³. Statistical significance for f-index, BODIPY staining and ATP production was calculated using Student’s t-test between the two groups with a one tailed distribution and unequal variance.
Figure 5.
Figure 5.
In vivo analysis of Pvt1 function. (A) Relative expression of Pvt1 after silencing with GapmeRs. Standard deviation was calculated among three biological and two technical replicates per biological sample. (B) Electron microscopy of TA slices. White arrows indicate elongated mitochondria in samples where Pvt1 was low (in both normal and denervated muscles). When Pvt1 was down-regulated, the number of mitochondria increased. (C) Quantization of mitochondrial mass. Mitochondrial mass was expressed as relative quantity of mitochondrial DNA coding for Cox compared with nuclear DNA coding for Sdh. It increased when Pvt1 was down-regulated. The genomic region coding for TBP was used as reference. Four biological replicates were analyzed. Standard error is represented. (D) Representative images for Sdh staining in gastrocnemius muscles. Scale bar represents 100 μm. (E) Percentage of oxidative and glycolytic myofibers is represented. χ² tests reveal that the increase in oxidative fibers after Pvt1 silencing is not significant for non-denervated muscles (χ2 = 1.09, P-value = 0.296) while it is significant for denervated muscles (χ2 = 4.75, P-value = 0.029). About 3500 myofibers for each condition were counted. (F) Histograms represent expression values relative to control gene (Tbp), obtained by qPCR for transcripts for myosin heavy chain. After Pvt1 silencing, myosin heavy chain genes expressed in oxidative metabolic myofibers (Myh2 and Myh7) increased their expression. On the contrary, genes expressed in glycolytic myofibers (Myh1 expressed in oxidative/glycolytic and Myh4 in glycolytic) were not affected. Standard deviation was calculated from three biological and two technical replicates per biological sample. O = Oxidative; G = Glycolytic (G) Cross-section area (CSA) was measured for ∼1200 fibers. Values are expressed in μm2. Fibers were divided in groups having similar area and their frequency was plotted. In non-denervated muscles the CSA of oxidative and glycolytic myofibers slightly increased when Pvt1 was down-regulated. (H) In denervated muscles the CSA of oxidative myofibers does not decrease when Pvt1 was down-regulated while it was unaffected for glycolytic myofibers. (I) Histograms represent expression values relative to control gene (Tbp) and normalized against the average expression of the gene among samples. Among tested genes involved in the mitochondrial dynamics only Mfn1 was up-regulated after Pvt1 silencing. Metabolic related genes showed instead the up-regulation of Cpt1b, Lipe and Atp5d and the down-regulation of Plin2. All genes associated to mito/autophagy were down-regulated in muscle where Pvt1 was down-regulated. Standard deviation was calculated among three biological and two technical replicates Statistical significance was calculated according to Student’s t-test between the two groups considering a two-tailed distribution and samples having unequal variance. * P ≤ 5 × 10⁻², ** P ≤ 1 × 10⁻², *** P ≤ 1 × 10⁻³.
Figure 6.
Figure 6.
Mechanism of action of Pvt1 to prevent muscle atrophy. (A) Histograms represent expression value relative to the average expression of the gene among samples. Tbp was used as reference gene. After Pvt1 down-regulation, c-Myc, Bax, Beclin 1 were under-expressed while Bcl-2 and Mfn1 were over-expressed. (B) Western blots performed on target proteins of C2C12 cells where Pvt1 was silenced. Both immunoreactive bands (upper) and the corresponding Coomassie blue staining (C.s., lower) are shown (C) Densitometric analysis of western blots in which the optical density of immunoreactive bands was normalized to the optical density of the corresponding Coomassie-stained lane. Reported data are mean ± SEM, calculated among at least four biological replicates, and the statistical significance was assessed using one-tailed Student’s t-test between paired samples. (D) Histograms represent expression values relative to the average expression of the gene among samples. Gastrocnemius was used as muscle and Tbp as reference gene. During Denervation Pvt1 increases its expression at day 3 like c-Myc, Bak1, Bax and Beclin 1. On the contrary, Bcl-2 and Mfn1 were under-expressed. (E) Histograms represent expression value relative to the average expression of the gene among samples. Gastrocnemius was used as muscle and Tbp as reference gene. During ALS progression, Pvt1 expression is increased in 4-month-old ALS mice. c-Myc, Bak1, Bax and Beclin 1 expression concomitantly increases. On the contrary, Bcl-2 and Mfn1 were under-expressed. Statistical significance of qPCR experiments was calculated using a Student’s t-test between control and the considered time point or treatment for Pvt1 down-regulation with a two-tailed distribution and unequal variance. Standard deviation of qPCR was calculated among three biological and two technical replicates. (F) Cartoon representing the mechanism of action of Pvt1 during muscle atrophy. During muscle atrophy Pvt1 is up-regulated blocking c-Myc phosphorylation and degradation. In turn, Bcl-2 results up-regulated impinging on autophagy and apoptosis through the regulation of Beclin 1 and Bax. For the entire figure * P ≤ 5 × 10⁻², ☆ P ≤ 1 × 10⁻², P ≤ 1 × 10⁻³.

References

    1. Hon C.C., Ramilowski J.A., Harshbarger J., Bertin N., Rackham O.J., Gough J., Denisenko E., Schmeier S., Poulsen T.M., Severin J. et al. . An atlas of human long non-coding RNAs with accurate 5′ ends. Nature. 2017; 543:199–204. - PMC - PubMed
    1. Hezroni H., Koppstein D., Schwartz M.G., Avrutin A., Bartel D.P., Ulitsky I.. Principles of long noncoding RNA evolution derived from direct comparison of transcriptomes in 17 species. Cell Rep. 2015; 11:1110–1122. - PMC - PubMed
    1. Cabili M.N., Dunagin M.C., McClanahan P.D., Biaesch A., Padovan-Merhar O., Regev A., Rinn J.L., Raj A.. Localization and abundance analysis of human lncRNAs at single-cell and single-molecule resolution. Genome Biol. 2015; 16:20–35. - PMC - PubMed
    1. Cabili M.N., Trapnell C., Goff L., Koziol M., Tazon-Vega B., Regev A., Rinn J.L.. Integrative annotation of human large intergenic noncoding RNAs reveals global properties and specific subclasses. Genes Dev. 2011; 25:1915–1927. - PMC - PubMed
    1. Liu S.J., Nowakowski T.J., Pollen A.A., Lui J.H., Horlbeck M.A., Attenello F.J., He D., Weissman J.S., Kriegstein A.R., Diaz A.A. et al. . Single-cell analysis of long non-coding RNAs in the developing human neocortex. Genome Biol. 2016; 17:67–83. - PMC - PubMed

Publication types

Substances

LinkOut - more resources