. 2019 Apr 8;47(6):2793-2806.
doi: 10.1093/nar/gky1322.

Conformational changes and catalytic inefficiency associated with Mot1-mediated TBP-DNA dissociation

Affiliations

Conformational changes and catalytic inefficiency associated with Mot1-mediated TBP-DNA dissociation

Gregor Heiss et al. Nucleic Acids Res. .

Abstract

The TATA-box Binding Protein (TBP) plays a central role in regulating gene expression and is the first step in the process of pre-initiation complex (PIC) formation on promoter DNA. The lifetime of TBP at the promoter site is controlled by several cofactors including the Modifier of transcription 1 (Mot1), an essential TBP-associated ATPase. Based on ensemble measurements, Mot1 can use adenosine triphosphate (ATP) hydrolysis to displace TBP from DNA and various models for how this activity is coupled to transcriptional regulation have been proposed. However, the underlying molecular mechanism of Mot1 action is not well understood. In this work, the interaction of Mot1 with the DNA/TBP complex was investigated by single-pair Förster resonance energy transfer (spFRET). Upon Mot1 binding to the DNA/TBP complex, a transition in the DNA/TBP conformation was observed. Hydrolysis of ATP by Mot1 led to a conformational change but was not sufficient to efficiently disrupt the complex. SpFRET measurements of dual-labeled DNA suggest that Mot1's ATPase activity primes incorrectly oriented TBP for dissociation from DNA and additional Mot1 in solution is necessary for TBP unbinding. These findings provide a framework for understanding how the efficiency of Mot1's catalytic activity is tuned to establish a dynamic pool of TBP without interfering with stable and functional TBP-containing complexes.


Figures

Figure 1.
Figure 1.
Conformation of the DNA/TBP complex in the absence and presence of Mot1 observed by intermolecular spFRET. (A and B) Structure and labeling positions within the investigated Mot1/DNA/TBP complex visualized by Pymol. TBP is depicted in dark blue, the Mot1 N-terminal domain (NTD) in beige. The TATA sequence is marked in orange. Fluorescent labels are located within their sterically accessible volumes shown as red and green half cycles. The model structure is based on PDB structures 5FMF and 4WZS. For technical details, see ‘Supplementary Materials and Methods’ section. (A) Structures of single-labeled double-stranded DNA (dsDNA) in complex with TBP and Mot1. The DNA is labeled upstream at position +13 with respect to the transcription start site. TBP is labeled at residue 61. In complexes with DNA2, the DNA is labeled with Atto532 and TBP with Atto647N. In complexes with DNA1, the dyes are switched. (B) Immobilization strategy for single-molecule FRET imaging on DNA/TBP by TIRF microscopy. (C) A single-molecule time trace of a static DNA/TBP/Mot1 complex. Upper panel: the donor and acceptor intensities are shown in green and red, respectively. The donor intensity increases after single step acceptor photobleaching. Lower panel: the calculated FRET efficiency is shown in blue. (D) Molecule-wise FRET efficiency histograms of TBP complexes on H2B promoter DNA 1. Black: pre-assembled DNA/TBP complexes. Green: pre-assembled DNA/TBP/Mot1 complexes. Red: ternary DNA/TBP/Mot1 complexes after addition of 1 mM ATP. The ATP addition was performed in the same flow-chamber under the same buffer conditions as the measurements of the DNA/TBP/Mot1 complex. For parameters of the Gaussian fit, see Table 1. (E) Molecule-wise FRET efficiency histogram of TBP/Mot1 complexes on H2B promoter DNA 1. The complexes were pre-incubated at concentrations of 10 nM DNA 1 and 10 nM TBP, 12 nM Mot1 and then diluted to final concentrations of ∼50 pM. Green: pre-assembled DNA/TBP/Mot1 complexes. Black: DNA/TBP/Mot1 complexes after addition of 1 mM ATPγS. Red: DNA/TBP/Mot1 complexes after addition of 1 mM ATP following the addition of ATPγS. The number of molecules in each experiment is given in Supplementary Table S1. For parameters of the Gaussian fit used to guide the eye, see Supplementary Table S3.
Figure 2.
Figure 2.
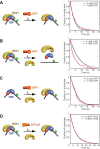
Kinetics of Mot1-catalyzed dissociation of TBP from the H2B promoter (DNA 2). (A–D) Time-resolved histograms of detected complexes: number of fluorescent TBP molecules observed over the course of the measurement without ATP addition due to photobleaching (blue) or due to dissociation and photobleaching after addition of 1 mM ATP (red). (A) Addition of 1 mM ATP to pre-assembled DNA/TBP/Mot1 ternary complexes. (B) Combined addition of 1 mM ATP and 3.4 nM Mot1 to preformed DNA/TBP/Mot1 ternary complexes. (C) Addition of 1 mM ATP and 3.4 nM Mot1 to DNA/TBP binary complexes. (D) Combined addition of 1 mM ATPγS and 3.4 nM Mot1 to DNA/TBP/Mot1 ternary complexes. Results of the fits are shown in Supplementary Table S4.
Figure 3.
Figure 3.
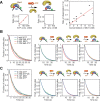
Mot1- and ATP hydrolysis-dependent dissociation of TBP from the H2B promoter (DNA 2). (A) The rate of TBP dissociation corrected for photobleaching as a function of ATP concentration (left panel), ADP concentration (middle panel), and Mot1 concentration (right panel) when Mot1 and ATP/ADP were added to immobilized DNA/TBP/Mot1 ternary complexes. (B) Sequential addition of ATP and Mot1 to DNA/TBP/Mot1 ternary complexes. The dwell-time histograms of DNA/TBP complexes under all conditions are shown in the left panel. Histograms of the normalized number of fluorescently labeled TBP molecules after addition of 1 mM ATP (second from left), sequential addition of 6 nM Mot1 (second from right) and, after washing out free Mot1, new addition of 1 mM ATP (right panel). (C) Sequential addition of ATPγS, Mot1, and ATP to DNA/TBP/Mot1 complexes. The dwell-time histogram of DNA/TBP complexes under all conditions is shown on the left. Histograms of TBP dissociation and photobleaching after addition of 1 mM ATPγS (second from left), sequential addition of 3 nM Mot1 (second from right) and, after removal of Mot1, addition of 1 mM ATP (right panel). Results of the fits are displayed in Supplementary Tables S4 and S5.
Figure 4.
Figure 4.
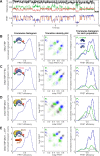
TBP induced conformational dynamics of a dual-labeled H2B promoter (DNA 3) observed by changes in FRET efficiency. (A) An exemplary time trace of a dynamic DNA/TBP complex. Donor and acceptor fluorescence are shown in green and red, respectively. The γ-corrected total intensity, scaled by a factor of 1.6 for clarity, is displayed in black. The FRET efficiency is shown in blue. The most likely sequence of FRET states obtained by training an HMM model is shown in red. (B–E) Normalized frame-wise FRET efficiency histograms of all dynamic DNA molecules (left column) including a schematic representation of the measured complex (inset), TDP of dynamic complexes with color coded subpopulations (middle column) and normalized frame-wise FRET efficiency histograms of the individual subpopulations (right column) for (B) DNA/TBP complexes, (C) DNA/TBP/TFIIA complexes, (D) DNA/TBP/Mot1 complexes, and (E) DNA/TBP/Mot1 complexes upon addition of 1 mM ATP. The number of molecules in each experiment is given in Supplementary Table S1. Different subpopulations of molecules (P1, P2, and P3) are displayed in the TDP and frame-wise histogram in green, blue and gray, respectively.
Figure 5.
Figure 5.
Scheme of the TBP/DNA conformational cycle upon Mot1 and ATP addition. Step 1: TBP (blue) binds to dsDNA and induces a bent state. Binding of TBP to the TATA box can occur in two orientations. TBP is depicted in light blue when bound correctly (outer circle), and depicted in dark blue when bound in the inverted orientation (inner circle, light gray background). Step 2: Mot1 (yellow) binds to the binary TBP/DNA complex and forms a stable ternary TBP/DNA/Mot1 complex. This binding step induces an additional bending and conformational change in the TBP/DNA interactions. Step 3: Addition of ATP leads to partial dissociation and ‘primes’ the complex in an unbent DNA conformation. Complexes where TBP is bound in the inverted binding orientation are the primary target for priming (dark blue/yellow, inner circle). Step 4: Addition of additional Mot1 in solution together with ATP liberates TBP from the primed TBP/DNA complex.

References

    1. Becker P.B., Horz W.. ATP-dependent nucleosome remodeling. Annu. Rev. Biochem. 2002; 71:247–273. - PubMed
    1. Clapier C.R., Cairns B.R.. The biology of chromatin remodeling complexes. Annu. Rev. Biochem. 2009; 78:273–304. - PubMed
    1. Hopfner K.P., Gerhold C.B., Lakomek K., Wollmann P.. Swi2/Snf2 remodelers: hybrid views on hybrid molecular machines. Curr. Opin. Struct. Biol. 2012; 22:225–233. - PMC - PubMed
    1. Narlikar G.J., Fan H.Y., Kingston R.E.. Cooperation between complexes that regulate chromatin structure and transcription. Cell. 2002; 108:475–487. - PubMed
    1. Singleton M.R., Dillingham M.S., Wigley D.B.. Structure and mechanism of helicases and nucleic acid translocases. Annu. Rev. Biochem. 2007; 76:23–50. - PubMed

Publication types

MeSH terms

Substances