

Measuring the rate of manual transcription error in outpatient point-of-care testing
- PMID: 30649499
- PMCID: PMC6351970
- DOI: 10.1093/jamia/ocy170
Measuring the rate of manual transcription error in outpatient point-of-care testing
Abstract
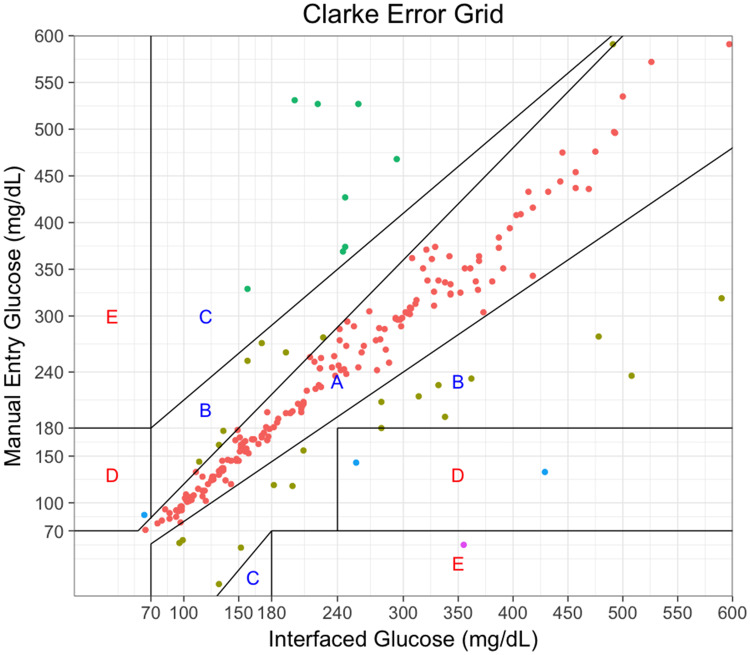
Many point-of-care laboratory tests are manually entered into the electronic health record by ambulatory clinic staff, but the rate of manual transcription error for this testing is poorly characterized. Using a dataset arising from a duplicated workflow that created a set of paired interfaced and manually entered point-of-care glucose measurements, we found that 260 of 6930 (3.7%) manual entries were discrepant from their interfaced result. Thirty-seven of the 260 (14.2%) errors were discrepant by more than 20% and included potentially dangerous mistranscriptions. An additional 37 (14.2%) errors were due to inclusion of non-numeric characters. Staff-entered result flags deviated from the result flag generated in the laboratory information system in 5121 of 6930 (73.9%) pairs. These data demonstrate that clinically significant discrepancies for clinic-entered point of care results occurred at a rate of approximately 5 per 1000 results and they underline the importance of interfacing instruments when feasible.
Figures
References
-
- McSwiney RR, Woodrow DA. Types of error within a clinical laboratory. J Med Lab Technol 1969; 26 (4): 340. - PubMed
-
- Tuckerman JF, Henderson AR. The clinical biochemistry laboratory computer system and result entry: validation of analytical results. Comput Methods Programs Biomed 1985; 20 (1): 103–16. - PubMed
-
- Snyder ML, Carter A, Jenkins K, Fantz CR. Patient misidentifications caused by errors in standard bar code technology. Clin Chem 2010; 56 (10): 1554–60. - PubMed
