. 2019 Mar 1;30(5):703-716.
doi: 10.1091/mbc.E18-08-0534. Epub 2019 Jan 16.

Dual binding motifs underpin the hierarchical association of perilipins1-3 with lipid droplets

Affiliations

Dual binding motifs underpin the hierarchical association of perilipins1-3 with lipid droplets

Dalila Ajjaji et al. Mol Biol Cell. .

Abstract

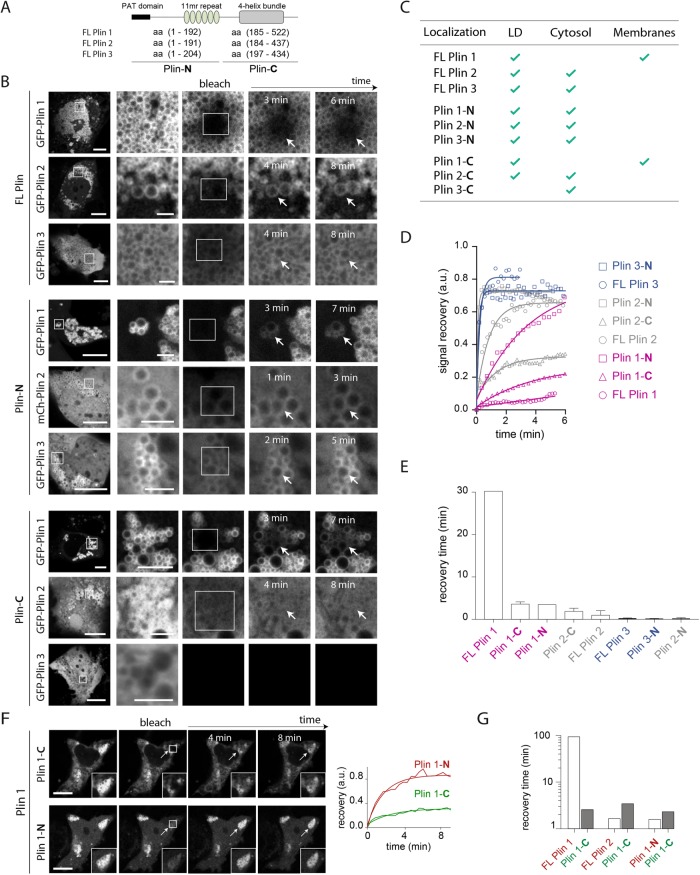
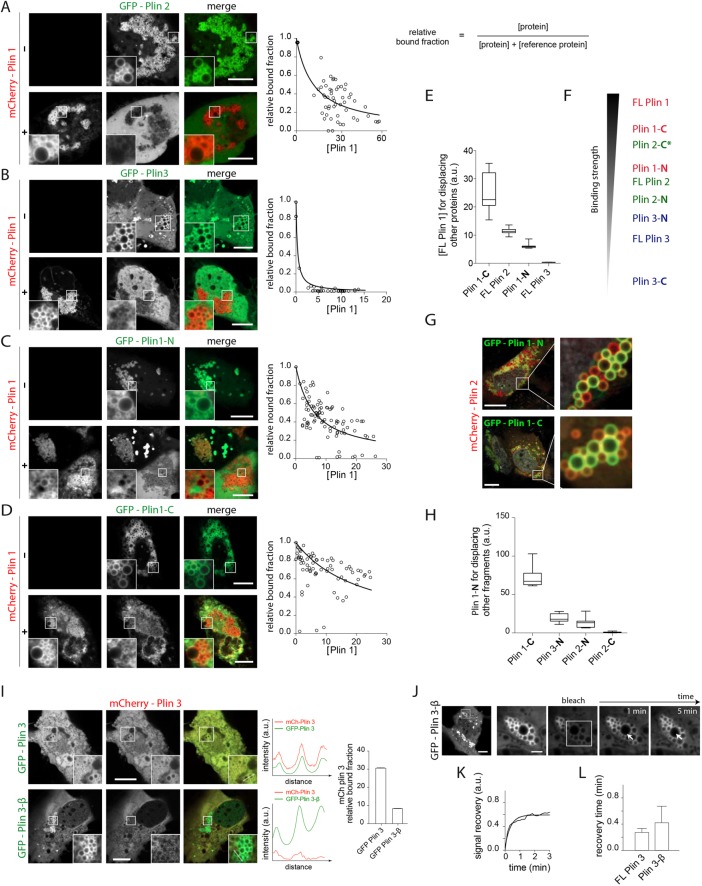
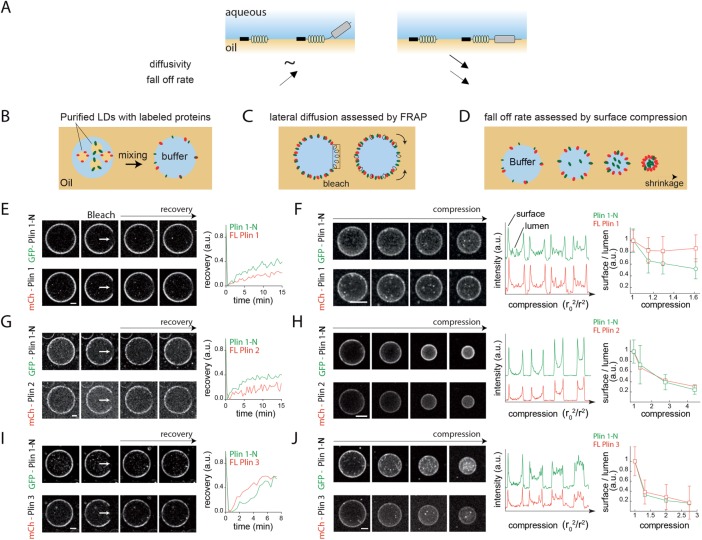
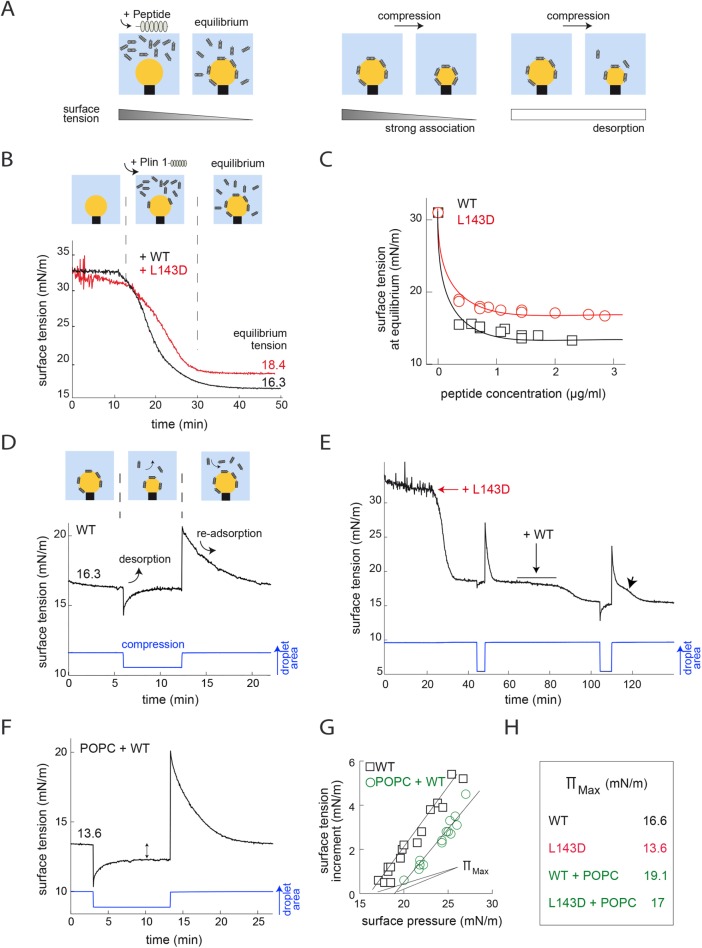
Lipid droplets (LDs) in all eukaryotic cells are coated with at least one of the perilipin (Plin) family of proteins. They all regulate key intracellular lipases but do so to significantly different extents. Where more than one Plin is expressed in a cell, they associate with LDs in a hierarchical manner. In vivo, this means that lipid flux control in a particular cell or tissue type is heavily influenced by the specific Plins present on its LDs. Despite their early discovery, exactly how Plins target LDs and why they displace each other in a "hierarchical" manner remains unclear. They all share an amino-terminal 11-mer repeat (11mr) amphipathic region suggested to be involved in LD targeting. Here, we show that, in vivo, this domain functions as a primary highly reversible LD targeting motif in Plin1-3, and, in vitro, we document reversible and competitive binding between a wild-type purified Plin1 11mr peptide and a mutant with reduced binding affinity to both "naked" and phospholipid-coated oil-water interfaces. We also present data suggesting that a second carboxy-terminal 4-helix bundle domain stabilizes LD binding in Plin1 more effectively than in Plin2, whereas it weakens binding in Plin3. These findings suggest that dual amphipathic helical regions mediate LD targeting and underpin the hierarchical binding of Plin1-3 to LDs.


Figures

FIGURE 1:
FIGURE 1:
(A) Simplified schematic illustration of the 11mr and 4HB domains of Plin1–3 alongside their respective amino acid numbers. PAT domain refers to the conserved amino-terminal region of the protein (black rectangle). Amino acids from 1 to 192, 191, and 204, respectively, in Plin1–3 are termed Plin(1–3)-N. Amino acids from 193, 192, and 205 to the end of each protein, respectively, in Plin1–3 are termed Plin(1–3)-C. (B) FRAP analysis of FL Plins and their complementary fragments containing the predicted 11mr and 4HB domains in a mammalian Huh7 cell line. The protein constructs were fused to GFP on the amino-terminus, except for Plin2-N, which had an mCherry tag instead. The left-hand panel shows the steady-state localization of each protein before photobleaching. The inset squares indicate the bleached region in the second panel from the left, and then subsequent panels show this region at the indicated times thereafter. Representative image sequence is shown. Each experiment was repeated at least three times. Scale bars: 10 µm. (C) Relative steady-state localization (LD/cytosol/membranes) of tagged Plin1–3 and fragments in Huh7 cells. We considered proteins to be 1) present on LDs when they formed a fluorescent ring around LDs; 2) cytosolic when they were associated with a diffuse fluorescence signal in the cytoplasm; and 3) membrane associated when they were associated with a reticular fluorescence signal in the cytoplasm—subsequent analyses showed that the reticular fluorescence signal colocalized with the ER marker Sec61. A minimum of 20 cells was analyzed for each construct to validate localization of the proteins. (D) Quantitative analysis of the recovery kinetics of Plins and fragments thereof to the LD surface following FRAP. Data are normalized to both pre- and postbleach intensities. Curves are exponential fits of the data. Each FRAP experiment was repeated three times, and representative recovery rates are shown. (E) Histogram of characteristic recovery times of the different peptides for experiments in B and D. The characteristic time “tau,” referred to herein as “recovery time,” is obtained by the following exponential fit: 1 − exp(−t/tau). The value of tau is the average value of all experiments performed in B and D. (F) Representative images of a FRAP image sequence of the GFP-tagged Plin1-C and mCherry-tagged Plin1-N when coexpressed in Huh7 cells. Scale bars: 10 µm. The normalized fluorescence recovery of the bleached LD cluster is shown over time. Curves correspond to exponential fits. (G) Histogram of the characteristic recovery times of the coexpressed GFP-Plin1-C, respectively, with mCherry-Plin1 and 2 and Plin 1-N. Black bars correspond to the recovery time of Plin 1-C in dual FRAP analysis against FL Plin1, FL Plin2, and Plin1-N that correspond to white bars. This experiment was repeated three times, and the value of tau corresponds to the representative images/quantification shown.
FIGURE 2:
FIGURE 2:
mCherry-FL Plin1 coexpression and LD colocalization with GFP-tagged versions of (A) FL Plin2, (B) FL Plin3, and (C, D) Plin1 fragments in Huh7 cells. The inset squares indicate the colocalization region of corresponding proteins to the LD surface. Scale bars: 10 µm. This experiment was repeated at least three times with more than 15 cells analyzed for each condition. The relative bound fraction level is reported in the right panel and indicates the relative amount of a protein bound to LDs when mCherry-FL Plin1 (the reference protein) is expressed at a given level; it is calculated as follows: [protein]/([protein] + [reference protein]), and represented against [reference protein]. Each experimental dot corresponds to an average of the signal on 10–20 LDs. (E) The critical concentration of FL Plin1 required for displacing half of the competing proteins is reported. Plin1-C required much more FL Plin1 to be displaced, as compared with FL Plin2 and 3 or Plin1-N. Results are presented as box-and-whisker plots of the critical concentration assessed from at least three different sets of data. The central box represents the interquartile ranges (25th to 75th percentile), the middle line represents the median, and the horizontal lines represent the minimum and the maximum value of observation range. Values are expressed as median ± IR. (F) Classification of the relative binding strength to the LD surface of Plins and fragments thereof based on their recovery rates from FRAP and competition experiments. Plin 2-C, labeled with the asterisk, constitutes a particular case, as it has a low LD on rate, suggested from coexpression experiments, and a high off rate, observed from the FRAP experiment. (G) mCherry-FL Plin2 coexpression and colocalization with GFP-tagged versions of the Plin1 fragments. Plin2 is not fully displaced by the fragments and displays frequent differential LD enrichment with the fragments. The experiments were repeated twice and three times, respectively. Scale bars: 10 µm. (H) Critical concentrations for the displacement of proteins competing against mCherry-Plin1-N, shown in Supplemental Figure S3H. Plin2-N and Plin3-N were displaced by similar concentrations, whereas Plin1-C required considerably more Plin1-N to displace it. Plin2-C was barely detected on LDs in this coexpression experiment. Results are presented as box-and-whisker plots of the critical concentration obtained from at least three sets of data. (I) GFP-Plin3-β (without β-sheets) coexpression and LD colocalization with mCherry-FL Plin3 in Huh7 cells. FL Plin3 is readily displaced from LDs when coexpressed with GFP-Plin3-β. The inset squares indicate the colocalization region of corresponding proteins to the LD surface. In control experiments, GFP-Plin3 did not displace mCherry-Plin3 as observed with GFP-Plin3-β. Right panel shows the intensity profile of each line section drawn in the inset. Signal on LDs is displayed as peaks; mCherry-Plin3 is almost absent on LDs only when coexpressed with GFP-Plin3-β. Far right panel compares the relative bound fraction of mCherry-Plin3 when coexpressed at similar level with GFP-Plin3 or GFP-Plin3-β. Scale bars: 10 µm. (J) FRAP analysis of GFP-Plin3-β in a Huh7 cell. A representative image sequence is shown with typical recovery kinetic (K). FRAP experiment was repeated three times. Scale bars: 10 µm. (L) Histogram of characteristic recovery times of FL Plin3 and Plin3-β in individual FRAP experiments. The characteristic recovery times correspond to means ± SD.
FIGURE 3:
FIGURE 3:
(A) Schematic illustration of Plin binding to LDs. The FL protein contains a membrane binding domain and a second soluble domain that potentially interacts with the membrane, which would slow down diffusion and the fall-off rate. (B) Schematic illustration of the in vitro system. Purified LDs in buffer are mixed with TO to generate buffer in oil emulsion droplets. LD protein content is relocated in this manner to the resulting oil–water interface. (C) Schematic illustration of the lateral mobility of the proteins studied by photobleaching. (D) Schematic illustration of membrane fall-off in shrinking buffer in oil droplets containing two differently labeled proteins at the droplet interface. (E) Lateral recovery of mCherry-FL Plin1 and GFP-Plin1-N at the oil–water interface of an artificial droplet as sketched in C. Representative image sequences are shown. Scale bar: 30 µm. Mean fluorescence recovery of the bleached drop surface area over time is shown (right). The experiment was reproduced three times, and a representative situation is shown. (F) Representative images of mCherry-FL Plin1 and GFP-Plin1-N fall-off from the oil–water interface during shrinkage of the artificial drop (as sketched in D). Scale bar: 30 µm. Fluorescence intensity profiles (middle) in the equatorial focal plane of the artificial droplet are plotted against the droplet compression factor, (r2 (time 0)/r2 (respective time point); r = drop radius). In the far right panel, the mean ± SD surface/lumen signal during compression is reported. The experiment was reproduced three times, and a representative situation is shown. (G) Lateral recovery rates of mCherry-FL Plin2 or mCherry-FL Plin3 (I) compared with the GFP-Plin1-N at the oil–water interface are reported. Representative images are shown. Scale bar: 30 µm. Mean fluorescence recovery on the droplet bleached surface area over time is shown (right). The experiments were reproduced three times for G and twice for I. (H) mCherry-FL Plin2 or mCherry-FL Plin3 (J) and GFP-Plin1-N fall-off during shrinkage are shown. Scale bars: 30 µm. Fluorescence intensity profiles are plotted against the drop compression factor (middle). In the far right panel, the mean surface/lumen signal ± SD during compression is reported. The experiments were reproduced more than three times for H and at least twice for J.
FIGURE 4:
FIGURE 4:
(A) Schematic illustration of oil droplet tensiometry showing an oil droplet, whose volume can be adjusted, at the end of a J-tube in an aqueous buffer. When added to the buffer, purified peptide reduces surface tension. Shrinking the droplet reduces its surface area and increases the concentration of surface peptide, further altering surface tension and/or forcing the peptide off the surface. (B) Plin1 11mr-containing domain (aa 93–192) WT (black line) and mutant (L143D, red line) peptides decrease the interfacial tension of a TO–water (TO–W) interface, but less for the mutant. (C) Equilibrium surface tension vs. the concentration of peptide in the bulk phase. WT produces a lower surface tension than the L143D mutant at all concentrations. At the lowest concentrations (less than 0.5 µg/ml), the values may be too low, because equilibrium probably had not been reached. (D) Having reached a stable equilibrium (∼16.3 mN/M) following injection of the Plin1 WT peptide, the droplet area (size) was rapidly reduced to produce a surface compression and reexpanded after a few minutes. Changes in surface tension are displayed during this procedure. After the rapid compression, surface tension comes back to the initial equilibrium tension. Data from further compressions are included in Supplemental Figure S5A. (E) Competition for the TO–W interface between Plin1 93–192 WT and mutant L143D. Initial (red arrow) addition of 10 µg of mutant L143D to the TO–W interface promptly reduced surface tension to ∼18.6 mN/m (γeq). The area was then reduced by ∼30%, causing the tension to fall rapidly to ∼17.6 mN/m. It then quickly returned to equilibrium. The area was then reexpanded, and tension spiked to ∼27.1 mN/m before falling back to γeq. An equivalent amount of Plin1 WT peptide was then also injected within a few minutes (+WT arrow), and surface tension slowly fell further to a new γeq of ∼15.6 mN/m, indicating that WT displaced the mutant peptide. The surface tension profile following a repeat compression and reexpansion was somewhat different from that recorded during a similar compression in the presence of mutant peptide alone, insofar as there was a “shoulder” (arrowhead) in the recovery period—we interpret this as reflecting initial rapid reassociation of both mutant and WT peptides with the interface, with the mutant then entirely displaced by the WT peptide over time. (F) This image is similar to D, but here phospholipid (POPC) has been added to the buffer before addition of Plin1 WT peptide and then a compression/reexpansion perturbation. Note that the equilibrium surface tension is lower when POPC is added, that is, ∼13.6 mN/m. After the rapid compression, the new equilibrium surface tension is lower than the initial equilibrium tension, in contrast to D. Data from further compressions for both the WT and L143D mutant peptide are included in Supplemental Figure S5B. (G, H) The maximum pressure the peptide can withstand without being ejected from the interface is referred to as Πmax. Data from a number of rapid-compression experiments plotting the maximum Π (Πo) obtained for a given compression are plotted against the change in (Δγ) after compression. The extrapolations to Δγ = 0 give Πmax for each peptide on the two interfaces. (G) The Πmax for the WT peptide is shown for the TO–W and POPC–TO–W interfaces. Πmax is higher on the POPC–TO–W interface, suggesting that the presence of POPC helps to retain the peptide at the interface. Exclusion pressure is calculated by extrapolating the regression lines to a surface tension increment of zero. These data are reported in H.

References

    1. Arimura N, Horiba T, Imagawa M, Shimizu M, Sato R. (2004). The peroxisome proliferator-activated receptor gamma regulates expression of the perilipin gene in adipocytes. J Biol Chem , 10070–10076. - PubMed
    1. Beller M, Bulankina AV, Hsiao HH, Urlaub H, Jackle H, Kuhnlein RP. (2010). PERILIPIN-dependent control of lipid droplet structure and fat storage in Drosophila. Cell Metab , 521–532. - PubMed
    1. Ben M’barek K, Ajjaji D, Chorlay A, Vanni S, Foret L, Thiam AR. (2017). ER membrane phospholipids and surface tension control cellular lipid droplet formation. Dev Cell , 591–604 e597. - PubMed
    1. Bersuker K, Olzmann JA. (2017). Establishing the lipid droplet proteome: mechanisms of lipid droplet protein targeting and degradation. Biochim Biophys Acta , 1166–1177. - PMC - PubMed
    1. Brasaemle DL. (2007). Thematic review series: adipocyte biology. The perilipin family of structural lipid droplet proteins: stabilization of lipid droplets and control of lipolysis. J Lipid Res , 2547–2559. - PubMed

Publication types