

Uncoupling of transcriptomic and cytological differentiation in mouse spermatocytes with impaired meiosis
- PMID: 30649999
- PMCID: PMC6589690
- DOI: 10.1091/mbc.E18-10-0681
Uncoupling of transcriptomic and cytological differentiation in mouse spermatocytes with impaired meiosis
Abstract
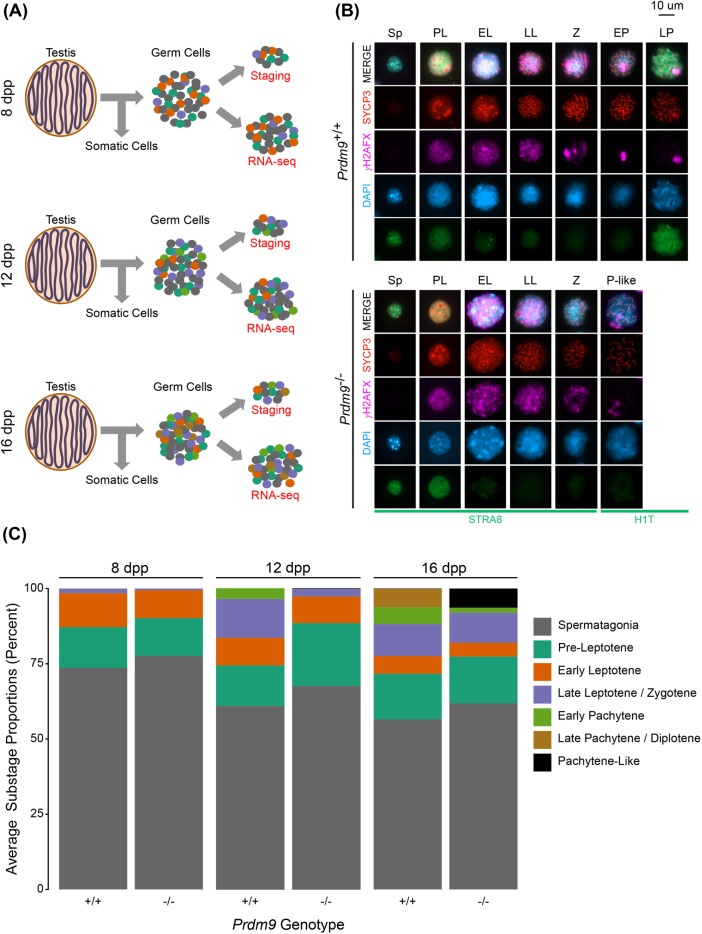
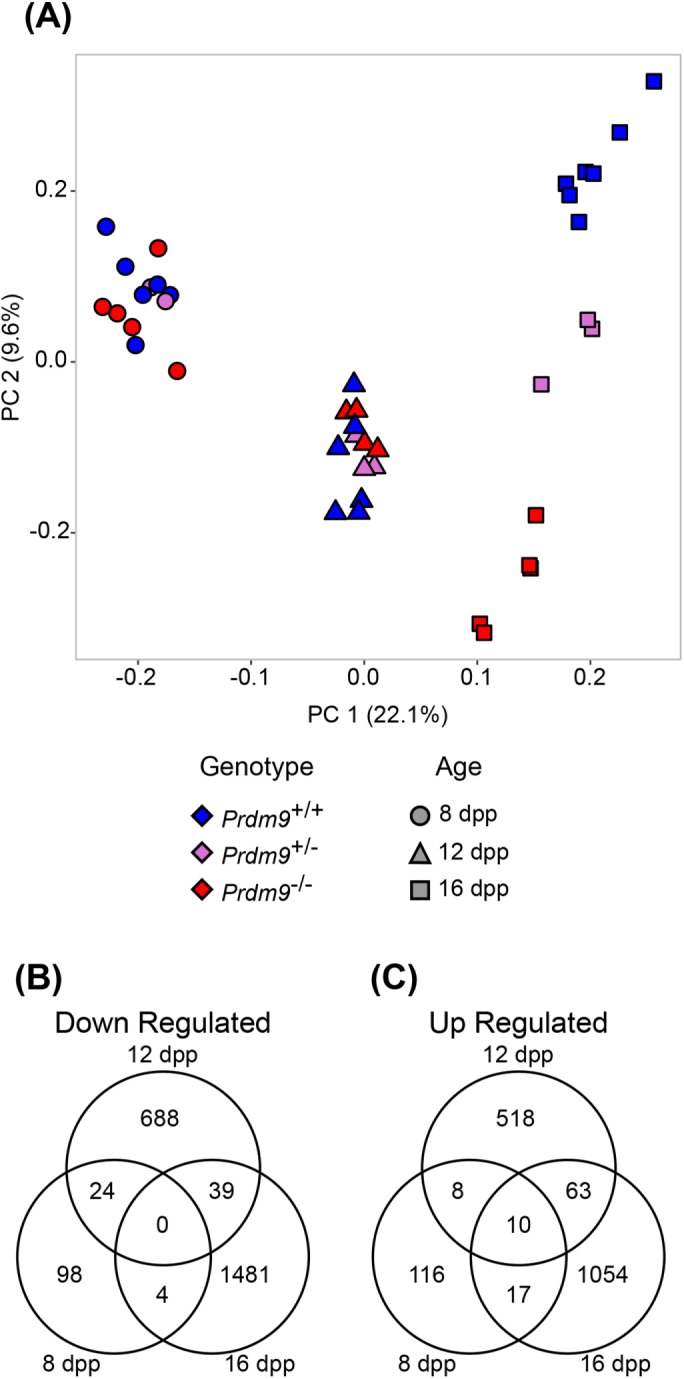
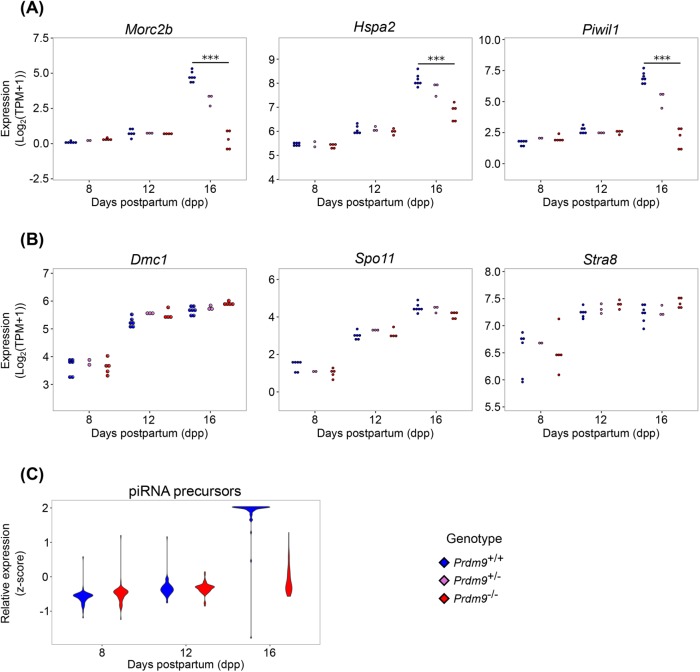
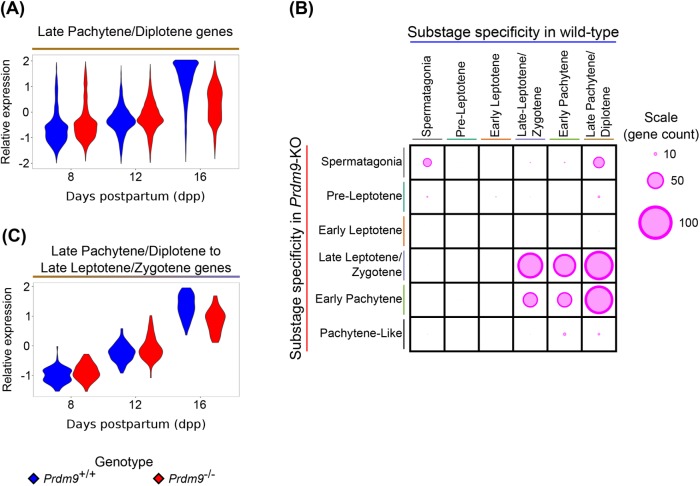
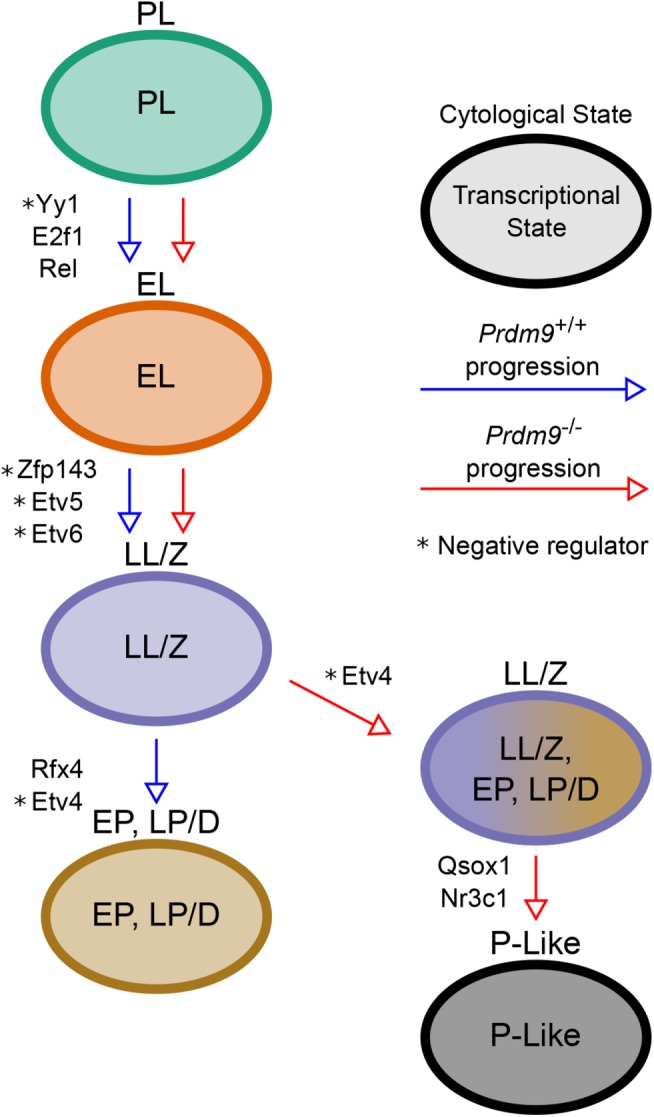
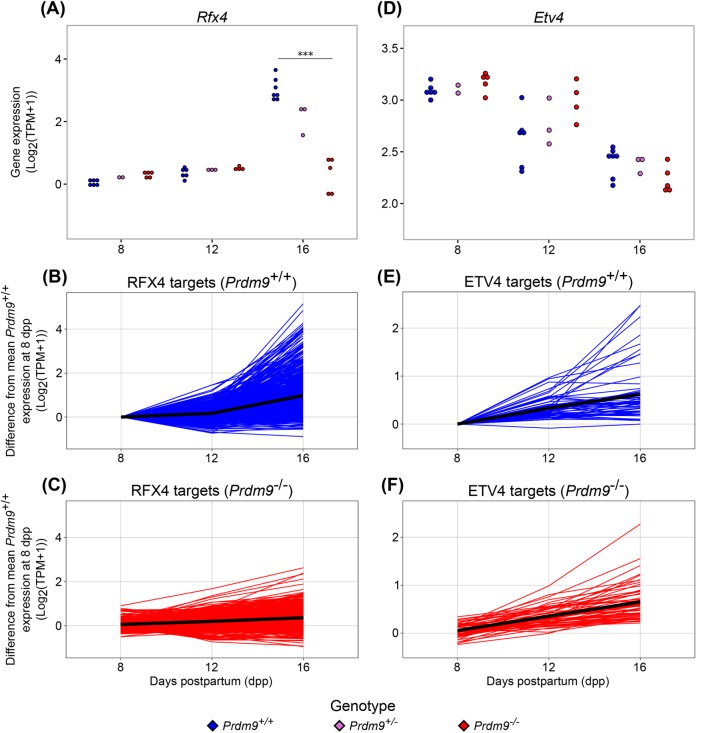
Cell differentiation is driven by changes in gene expression that manifest as changes in cellular phenotype or function. Altered cellular phenotypes, stemming from genetic mutations or other perturbations, are widely assumed to directly correspond to changes in the transcriptome and vice versa. Here, we exploited the cytologically well-defined Prdm9 mutant mouse as a model of developmental arrest to test whether parallel programs of cellular differentiation and gene expression are tightly coordinated, or can be disassociated. By comparing cytological phenotype markers and transcriptomes in wild-type and mutant spermatocytes, we identified multiple instances of cellular and molecular uncoupling in Prdm9-/- mutants. Most notably, although Prdm9-/- germ cells undergo cytological arrest in a late-leptotene/zygotene stage, they nevertheless develop gene expression signatures characteristic of later developmental substages. These findings suggest that transcriptomic changes may not reliably map to cellular phenotypes in developmentally perturbed systems.
Figures
Similar articles
-
Regulatory complexity revealed by integrated cytological and RNA-seq analyses of meiotic substages in mouse spermatocytes.BMC Genomics. 2016 Aug 12;17(1):628. doi: 10.1186/s12864-016-2865-1. BMC Genomics. 2016. PMID: 27519264 Free PMC article.
-
Surveillance of different recombination defects in mouse spermatocytes yields distinct responses despite elimination at an identical developmental stage.Mol Cell Biol. 2005 Aug;25(16):7203-15. doi: 10.1128/MCB.25.16.7203-7215.2005. Mol Cell Biol. 2005. PMID: 16055729 Free PMC article.
-
STRA8-deficient spermatocytes initiate, but fail to complete, meiosis and undergo premature chromosome condensation.J Cell Sci. 2008 Oct 1;121(Pt 19):3233-42. doi: 10.1242/jcs.035071. J Cell Sci. 2008. PMID: 18799790
-
A histone H3 methyltransferase controls epigenetic events required for meiotic prophase.Nature. 2005 Nov 17;438(7066):374-8. doi: 10.1038/nature04112. Nature. 2005. PMID: 16292313
-
A novel eIF4G homolog, Off-schedule, couples translational control to meiosis and differentiation in Drosophila spermatocytes.Development. 2007 Aug;134(15):2851-61. doi: 10.1242/dev.003517. Epub 2007 Jul 4. Development. 2007. PMID: 17611222
Cited by
-
Transcriptomics of Meiosis in the Male Mouse.Front Cell Dev Biol. 2021 Mar 5;9:626020. doi: 10.3389/fcell.2021.626020. eCollection 2021. Front Cell Dev Biol. 2021. PMID: 33748111 Free PMC article. Review.
-
Regulation of meiotic progression by Sertoli-cell androgen signaling.Mol Biol Cell. 2020 Dec 1;31(25):2841-2862. doi: 10.1091/mbc.E20-05-0334. Epub 2020 Oct 7. Mol Biol Cell. 2020. PMID: 33026960 Free PMC article.
-
The First Analysis of Synaptonemal Complexes in Jawless Vertebrates: Chromosome Synapsis and Transcription Reactivation at Meiotic Prophase I in the Lamprey Lampetra fluviatilis (Petromyzontiformes, Cyclostomata).Life (Basel). 2023 Feb 11;13(2):501. doi: 10.3390/life13020501. Life (Basel). 2023. PMID: 36836858 Free PMC article.
-
The birth of piRNAs: how mammalian piRNAs are produced, originated, and evolved.Mamm Genome. 2022 Jun;33(2):293-311. doi: 10.1007/s00335-021-09927-8. Epub 2021 Nov 1. Mamm Genome. 2022. PMID: 34724117 Free PMC article. Review.
-
Sexual dimorphism in the meiotic requirement for PRDM9: A mammalian evolutionary safeguard.Sci Adv. 2020 Oct 23;6(43):eabb6606. doi: 10.1126/sciadv.abb6606. Print 2020 Oct. Sci Adv. 2020. PMID: 33097538 Free PMC article.
References
Publication types
MeSH terms
Substances
Grants and funding
LinkOut - more resources
Full Text Sources
Molecular Biology Databases
