. 2019 Jan 16:8:e39595.
doi: 10.7554/eLife.39595.

Fine-mapping cis-regulatory variants in diverse human populations

Affiliations

Fine-mapping cis-regulatory variants in diverse human populations

Ashley Tehranchi et al. Elife. .

Abstract

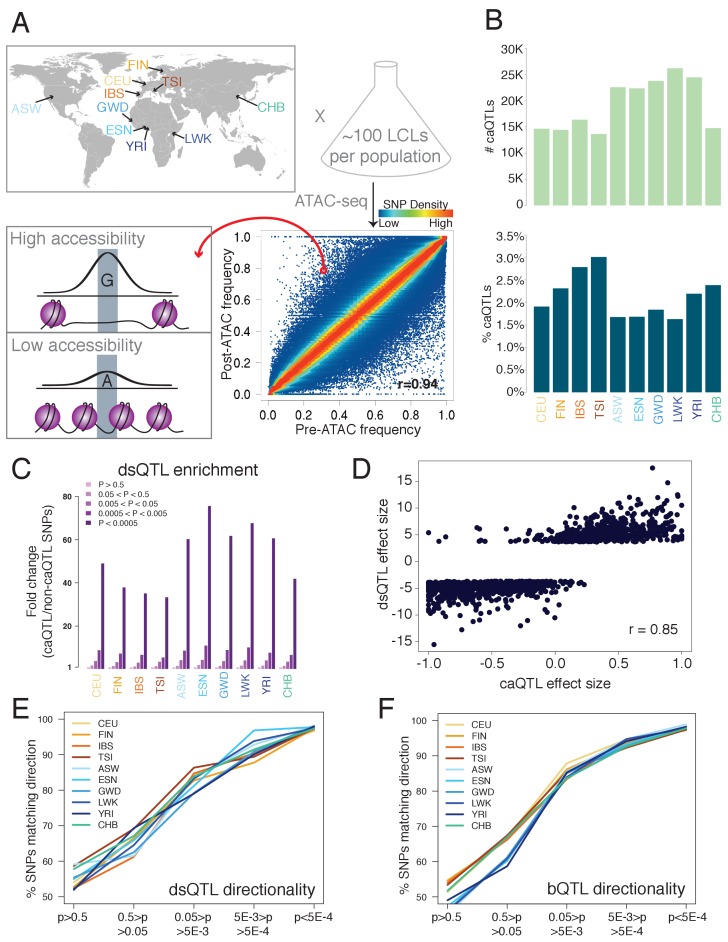
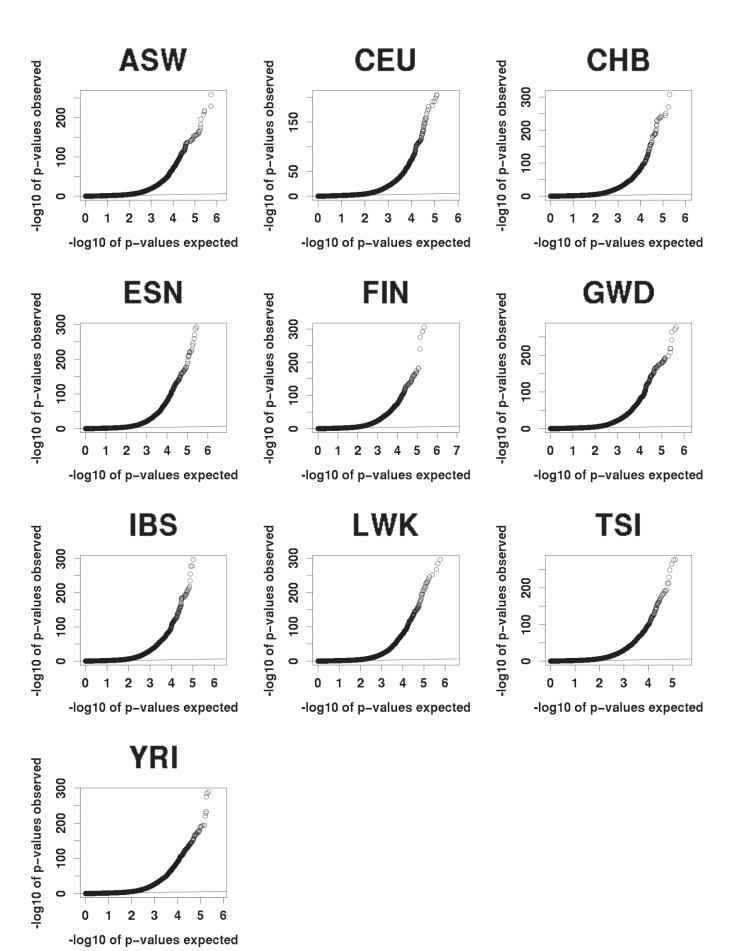
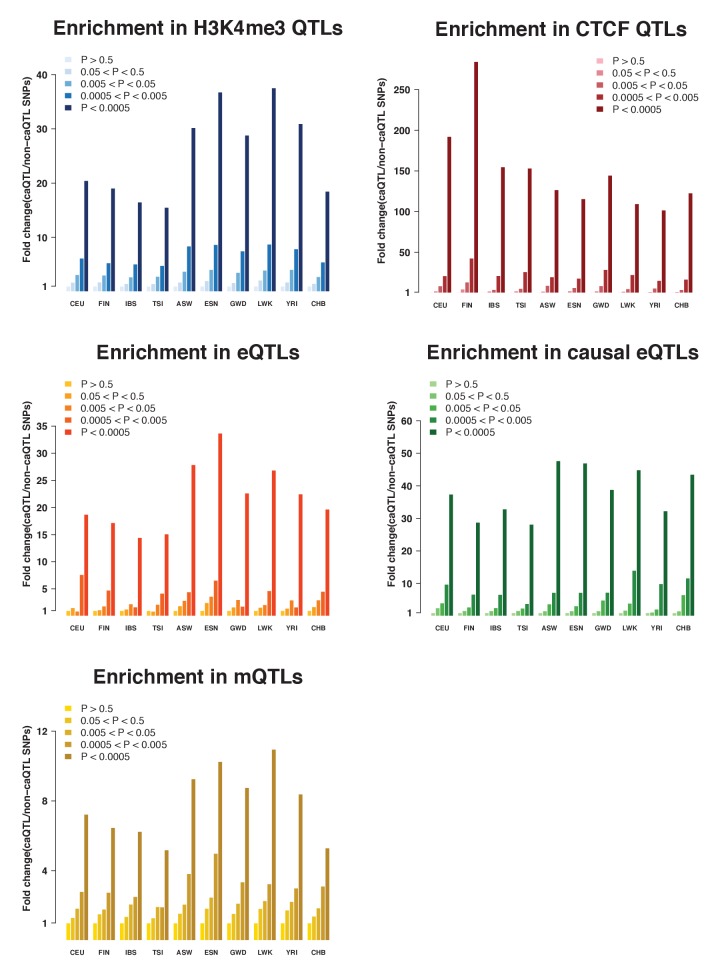
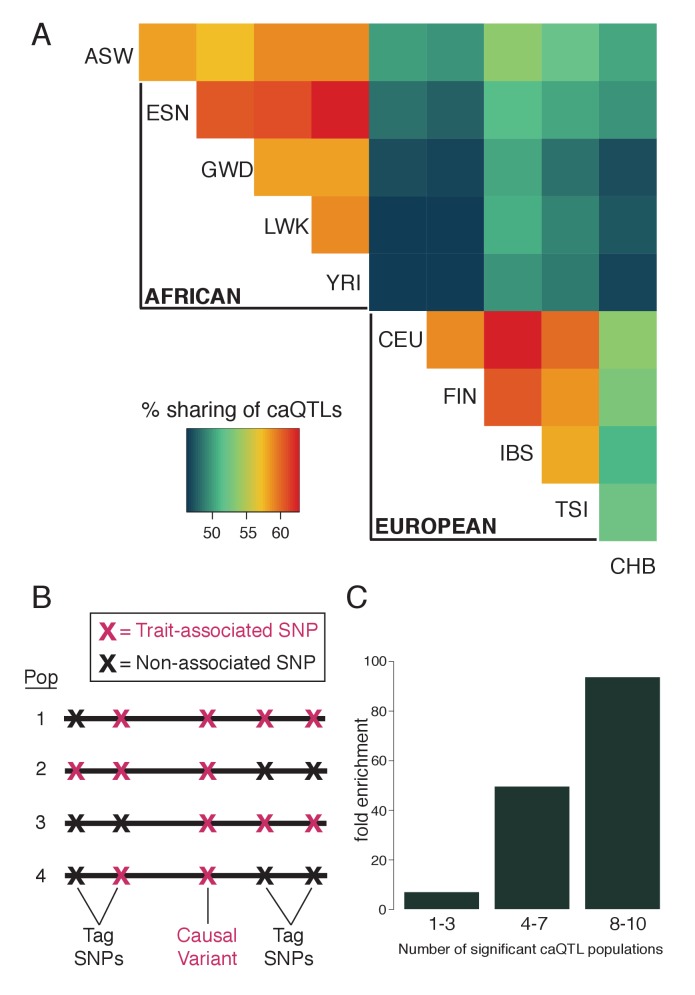
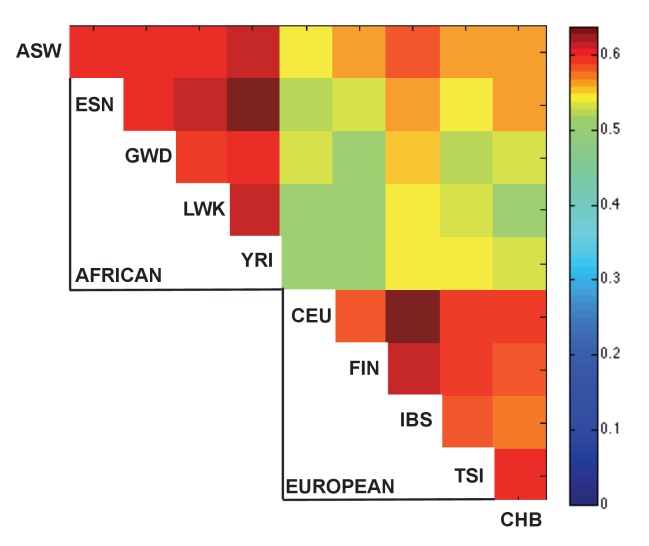
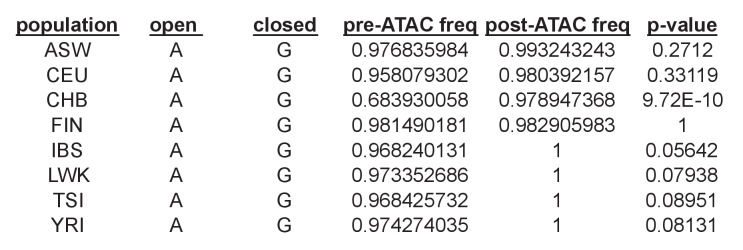
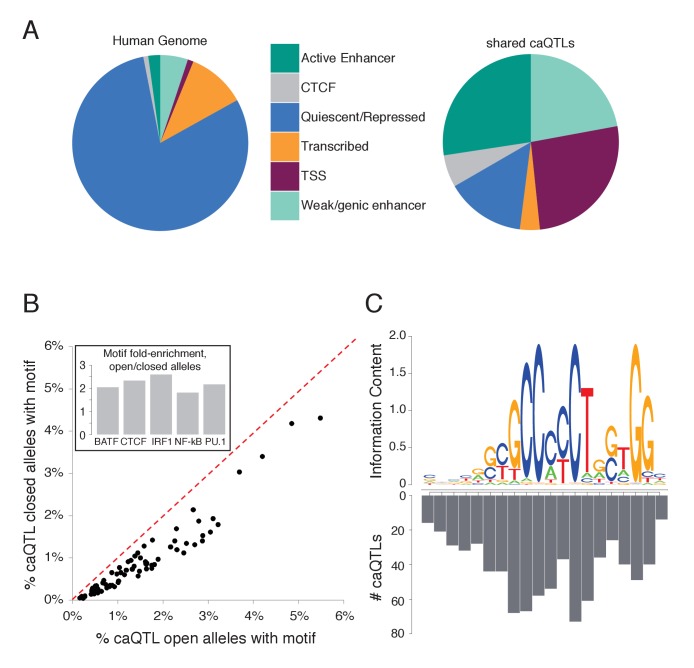
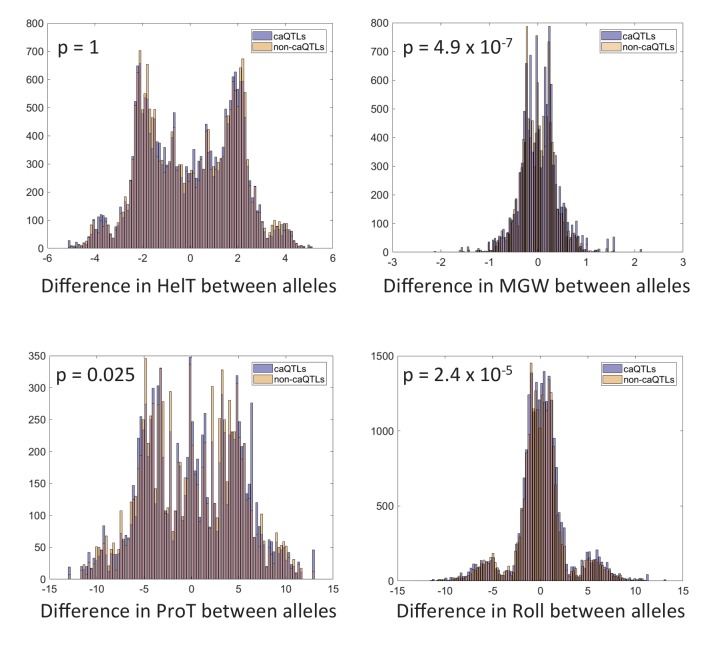
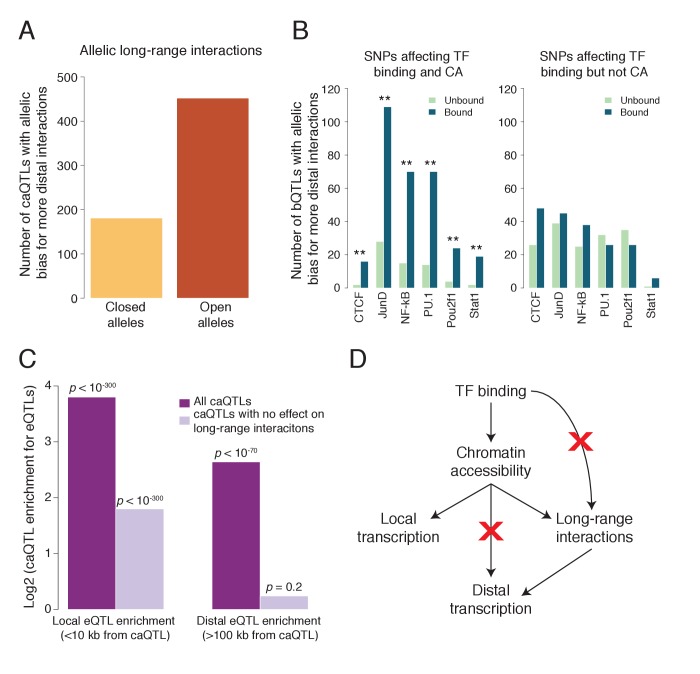
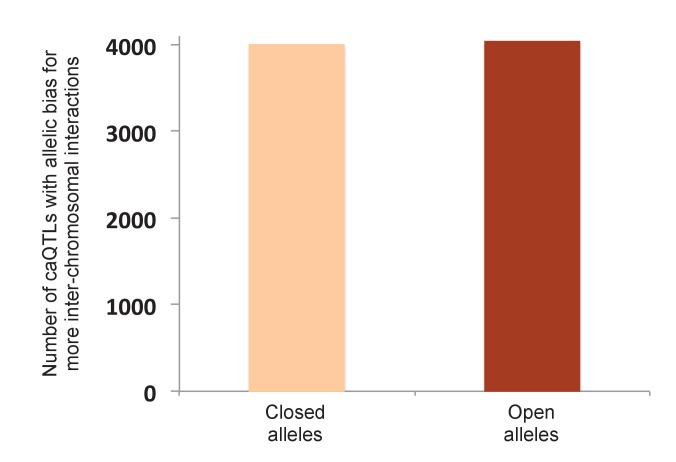
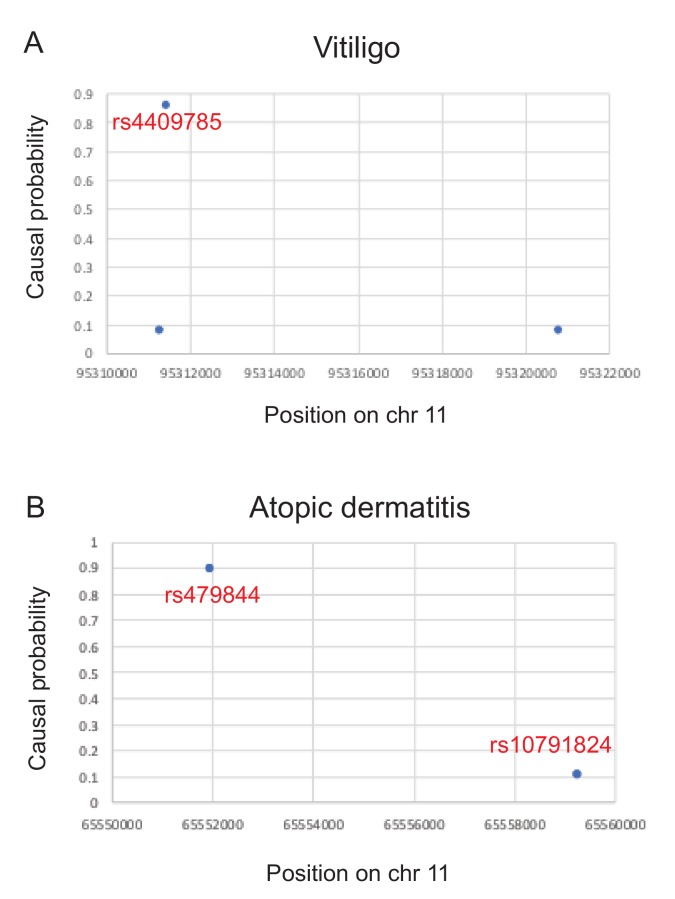
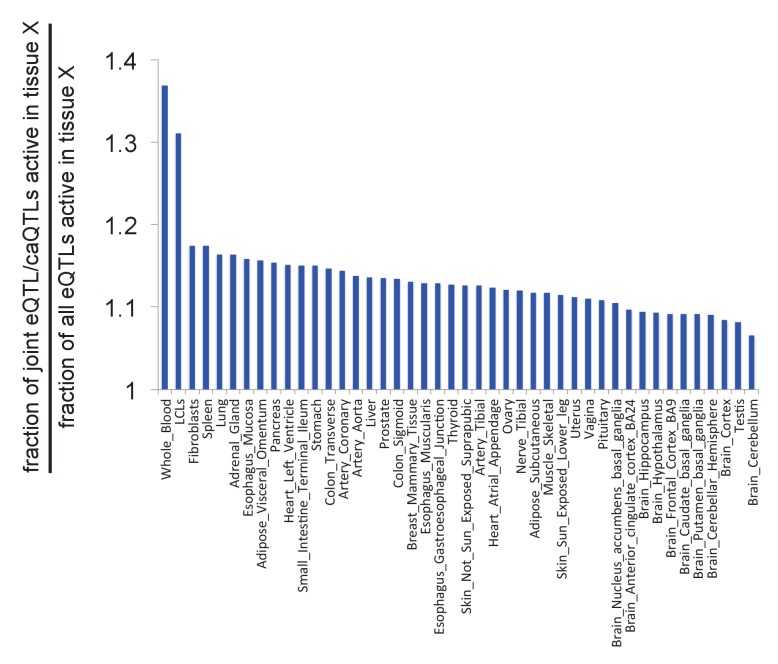
Genome-wide association studies (GWAS) are a powerful approach for connecting genotype to phenotype. Most GWAS hits are located in cis-regulatory regions, but the underlying causal variants and their molecular mechanisms remain unknown. To better understand human cis-regulatory variation, we mapped quantitative trait loci for chromatin accessibility (caQTLs)-a key step in cis-regulation-in 1000 individuals from 10 diverse populations. Most caQTLs were shared across populations, allowing us to leverage the genetic diversity to fine-map candidate causal regulatory variants, several thousand of which have been previously implicated in GWAS. In addition, many caQTLs that affect the expression of distal genes also alter the landscape of long-range chromosomal interactions, suggesting a mechanism for long-range expression QTLs. In sum, our results show that molecular QTL mapping integrated across diverse populations provides a high-resolution view of how worldwide human genetic variation affects chromatin accessibility, gene expression, and phenotype.

Editorial note: This article has been through an editorial process in which the authors decide how to respond to the issues raised during peer review. The Reviewing Editor's assessment is that minor issues remain unresolved (see decision letter).

Keywords: chromatin; chromosomes; fine-mapping; gene expression; genetics; genomics; gwas; human; qtl; transcription.


Conflict of interest statement

AT, BH, MD, IK, KP, PC, HF No competing interests declared

Figures

Figure 1.
Figure 1.. Outline and results of pooled ATAC-seq.
(A) Performing ATAC-seq in a pool of individuals selects DNA molecules with higher CA, thus enriching for more accessible alleles. In this example (ASW population), the G allele has a low pre-ATAC frequency but a high post-ATAC frequency, due to its increased CA. The ten population abbreviations refer to: CEU, Utah residents with North European ancestry; FIN, Finnish; TSI, Tuscan; IBS, Iberian; ASW, African-American from Southwest US; YRI, Yoruban; ESN, Esan; LWK, Luhya; GWD, Gambian; and CHB, Han Chinese. (B) The number of caQTLs (top), and the percent of all tested SNPs called as caQTLs (bottom). (C) Enrichment of caQTLs among dsQTLs (Degner et al., 2012), at a range of caQTL p-value cutoffs. (D) Quantitative effect sizes of caQTLs and dsQTLs are highly correlated (scales of each axis are not comparable, and do not affect the correlation coefficient).( E–F) The degree of allelic concordance between our caQTLs and: (E) dsQTLs (Degner et al., 2012). (F) bQTLs aggregated for five TFs (Tehranchi et al., 2016). Full results available in Figure 1—source data 1.
Figure 1—figure supplement 1.
Figure 1—figure supplement 1.. Comparison of post-ATAC reference allele frequencies between biological replicates of each population pool.
All replicates have 0.94 < r < 0.96.
Figure 1—figure supplement 2.
Figure 1—figure supplement 2.. Pre-ATAC vs post-ATAC reference allele frequencies for nine populations, similar to ASW plot in Figure 1A.
Most SNPs fall close to the diagonal, as expected if most SNPs are not caQTLs. All populations have 0.90 < r < 0.94.
Figure 1—figure supplement 3.
Figure 1—figure supplement 3.. Top row: caQTL p-values for SNPs on chr one in ASW and CEU, shown separately for each biological replicate.
Bottom row: median –log10(p-value) as a function of IDR, plotted using a moving window of IDR values (window width = 0.01). Dashed red lines indicate the p-value cutoff of 5 × 10⁻⁴, corresponding to IDR ≈ 0.01.
Figure 1—figure supplement 4.
Figure 1—figure supplement 4.. QQ plots of expected (under the null) vs observed caQTLs p-values.
All populations show a similar excess of significant p-values.
Figure 1—figure supplement 5.
Figure 1—figure supplement 5.. caQTLs enrichments among other molecular QTLs (Ding et al., 2014, Lappalainen et al. (2013), Waszak et al., 2015, Tewhey et al., 2016, Banovich et al., 2014).
Figure 2.
Figure 2.. Fine-mapping shared caQTLs.
(A) Heatmap showing the overlap in caQTLs for every pair of populations (only for variants that were testable in all ten). To avoid issues related to arbitrary p-value cutoffs, we used the shift in p-value distribution, known as π1 (Storey et al., 2004), to assess overlap. (B) Mapping a trait in multiple populations differing in LD structure allows fine-mapping of causal variants, which will show the most consistent associations. (C) caQTLs shared across many populations (at p<5×10⁻⁴) are more highly enriched for experimentally-determined causal eQTL variants (Tewhey et al., 2016). Full results available in Figure 2—source data 1.
Figure 2—figure supplement 1.
Figure 2—figure supplement 1.. Sharing of caQTLs across populations, as in Figure 2A, but excluding comparisons with divergent allele frequencies.
One possible explanation for the increase sharing of caQTLs between closely related population (Figure 2A) is that since the allele frequency can affect power to detect QTLs, more similar allele frequencies could lead to greater levels of sharing. To test this possibility, for each SNP, we calculated the sharing as in Figure 2A after excluding any population that had a pre-ATAC allele frequency >5% away from the mean frequency across all 10 populations. Although this excluded 75% of pairwise comparisons, we still observed a similar pattern of sharing, suggesting that patterns of sharing are unlikely to be driven solely by allele frequency differences.
Figure 2—figure supplement 2.
Figure 2—figure supplement 2.. Example of a shared caQTL (rs79979970) that is individually significant in only one population (CHB) out of eight tested, but reaches a shared caQTL p=5.6×10⁻⁷ because it has p<0.1 in an additional four populations.
In this case, CHB had the greatest power to detect an effect since it had a pre-ATAC allele frequency of 0.68 for the open allele, whereas the other seven all had frequencies > 0.95 and thus very little range for the open allele to increase in frequency post-ATAC.
Figure 3.
Figure 3.. Characterizing shared caQTLs.
(A) The fraction of the genome (left) and of shared caQTLs (right) in each of four classes, annotated based on chromatin signatures (Ernst and Kellis, 2012). TSS includes TSS flanking regions; full results in Supplementary file 2. (B) Searching for motifs enriched specifically among open alleles (using closed alleles from the same caQTLs as the background comparison set), we found 80 motifs enriched among open alleles (points below the diagonal). Repeating the analysis for closed alleles, we found no motifs enriched (above diagonal). Note that many motifs are partially overlapping, and thus not independent. Inset: fold-enrichment in open/closed alleles for five selected TFs. Full results in Figure 3—source data 1. (C) The number of caQTLs overlapping each position within the CTCF motif strongly mirrors the information content (i.e. the importance for binding) of that position, as expected if these caQTLs are causal variants affecting CA via CTCF binding. Full results available in Figure 3—source data 1.
Figure 3—figure supplement 1.
Figure 3—figure supplement 1.. Effect of shared caQTLs on DNA shape.
P-values are Bonferroni-corrected for four tests. See Materials and methods for details.
Figure 4.
Figure 4.. TF binding and chromatin accessibility.
(A) Using allele-specific 3D chromosomal interaction (Hi-C) data from an LCL (Rao et al., 2014), we found that open alleles of caQTLs tend to have more long-range interactions than do the closed alleles, establishing a role for CA in polymorphic chromosomal interactions.(B) Splitting bQTLs into two groups (Figure 4—figure supplement 2), we found that bQTLs were strongly associated with the extent of long-range interactions only when they also affect CA (left panel; ** indicates Bonferroni-corrected binomial p<0.008 for all six TFs); for bQTLs that do not affect CA, no allelic bias was observed (right panel; Bonferroni-corrected binomial p>0.08 for all six TFs). (C) caQTLs are strongly enriched for both local and distal eQTLs; however among those that do not affect long-range chromosomal interactions, only local eQTLs are enriched. (D) Model summary: our results suggest that bQTLs generally cannot affect long-range chromosomal interactions without an effect on CA, and caQTLs generally cannot affect distal transcription without an effect on long-range interactions. The model shown represents a plausible interpretation, but is not the only possible causal scenario. Full results available in Figure 4—source data 1.
Figure 4—figure supplement 1.
Figure 4—figure supplement 1.. Allelic bias of shared caQTLs for inter-chromosomal interactions.
To test the possibility that our result in Figure 4A could be due to a nonspecific bias in the Hi-C method—such as open chromatin alleles having higher efficiency of shearing, ligation, or some other step—we reasoned that any such bias should also be reflected in the pattern of allele-specific inter-chromosomal interactions (such inter-chromosomal interactions are typically considered to be ‘noise’, but should still be affected by any nonspecific biases in the method, making them an ideal control). Using the same Hi-C data (Rao et al., 2014), we found only three caQTLs with significant allelic bias in inter-chromosomal reads (two favoring open alleles and one favoring the closed allele at Bonferroni-corrected p<0.05). Moreover, plotting all shared caQTLs with allele-specific Hi-C data from GM12878 (Rao et al., 2014), shown in this figure, we observed no significant difference (4041 caQTLs favoring open alleles vs 3990 favoring closed alleles; binomial p=0.58).
Figure 4—figure supplement 2.
Figure 4—figure supplement 2.. Venn diagram indicating three possible combinations of caQTL/bQTL overlaps, and how we used these to infer their downstream effects in Figure 4B.
Figure 4—figure supplement 3.
Figure 4—figure supplement 3.. Causal probabilities of SNPs affecting disease risk (Farh et al., 2015) for two examples discussed in the main text.
A third example for multiple sclerosis could not be plotted because only SNPs with probabilities > 2.75% were reported.
Figure 4—figure supplement 4.
Figure 4—figure supplement 4.. Likelihood of caQTLs from LCLs acting as eQTLs in other tissues.
See Supplemental Note for details.

References

    1. Asimit JL, Hatzikotoulas K, McCarthy M, Morris AP, Zeggini E. Trans-ethnic study design approaches for fine-mapping. European Journal of Human Genetics. 2016;24:1330–1336. doi: 10.1038/ejhg.2016.1. - DOI - PMC - PubMed
    1. Auton A, Brooks LD, Durbin RM, Garrison EP, Kang HM, Korbel JO, Marchini JL, McCarthy S, McVean GA, Abecasis GR, 1000 Genomes Project Consortium A global reference for human genetic variation. Nature. 2015;526:68–74. doi: 10.1038/nature15393. - DOI - PMC - PubMed
    1. Banovich NE, Lan X, McVicker G, van de Geijn B, Degner JF, Blischak JD, Roux J, Pritchard JK, Gilad Y. Methylation QTLs are associated with coordinated changes in transcription factor binding, histone modifications, and gene expression levels. PLOS Genetics. 2014;10:e1004663. doi: 10.1371/journal.pgen.1004663. - DOI - PMC - PubMed
    1. Battle A, Brown CD, Engelhardt BE, Montgomery SB, GTEx Consortium. Laboratory, Data Analysis &Coordinating Center (LDACC)—Analysis Working Group. Statistical Methods groups—Analysis Working Group. Enhancing GTEx (eGTEx) groups. NIH Common Fund. NIH/NCI. NIH/NHGRI. NIH/NIMH. NIH/NIDA. Biospecimen Collection Source Site—NDRI. Biospecimen Collection Source Site—RPCI. Biospecimen Core Resource—VARI. Brain Bank Repository—University of Miami Brain Endowment Bank. Leidos Biomedical—Project Management. ELSI Study. Genome Browser Data Integration &Visualization—EBI. Genome Browser Data Integration &Visualization—UCSC Genomics Institute, University of California Santa Cruz. Lead analysts: Laboratory, Data Analysis &Coordinating Center (LDACC) NIH program management. Biospecimen collection. Pathology: eQTL manuscript working group Genetic effects on gene expression across human tissues. Nature. 2017;550:204–213. doi: 10.1038/nature24277. - DOI - PMC - PubMed
    1. Buenrostro JD, Wu B, Chang HY, Greenleaf WJ. ATAC-seq: a method for assaying chromatin accessibility Genome-Wide. Current Protocols in Molecular Biology. 2015;109:1–9. doi: 10.1002/0471142727.mb2129s109. - DOI - PMC - PubMed

Publication types