. 2019 Jan 15;26(3):652-669.e6.
doi: 10.1016/j.celrep.2018.12.093.

N-Cadherin-Expressing Bone and Marrow Stromal Progenitor Cells Maintain Reserve Hematopoietic Stem Cells

Affiliations

N-Cadherin-Expressing Bone and Marrow Stromal Progenitor Cells Maintain Reserve Hematopoietic Stem Cells

Meng Zhao et al. Cell Rep. .

Abstract

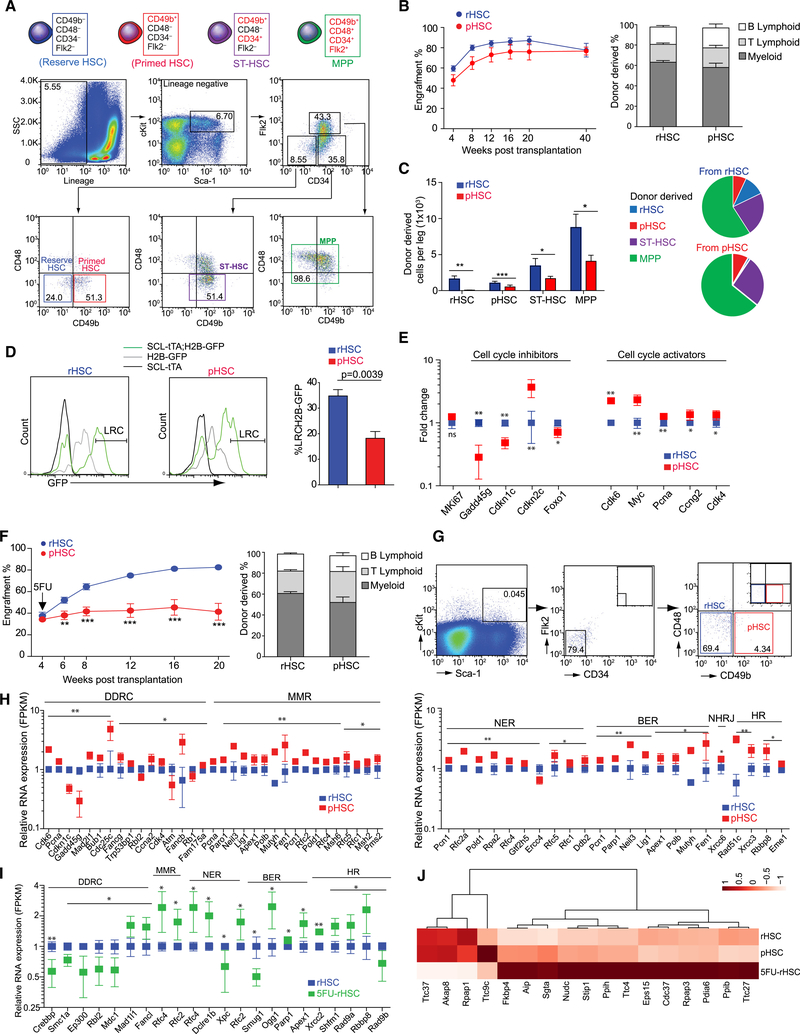
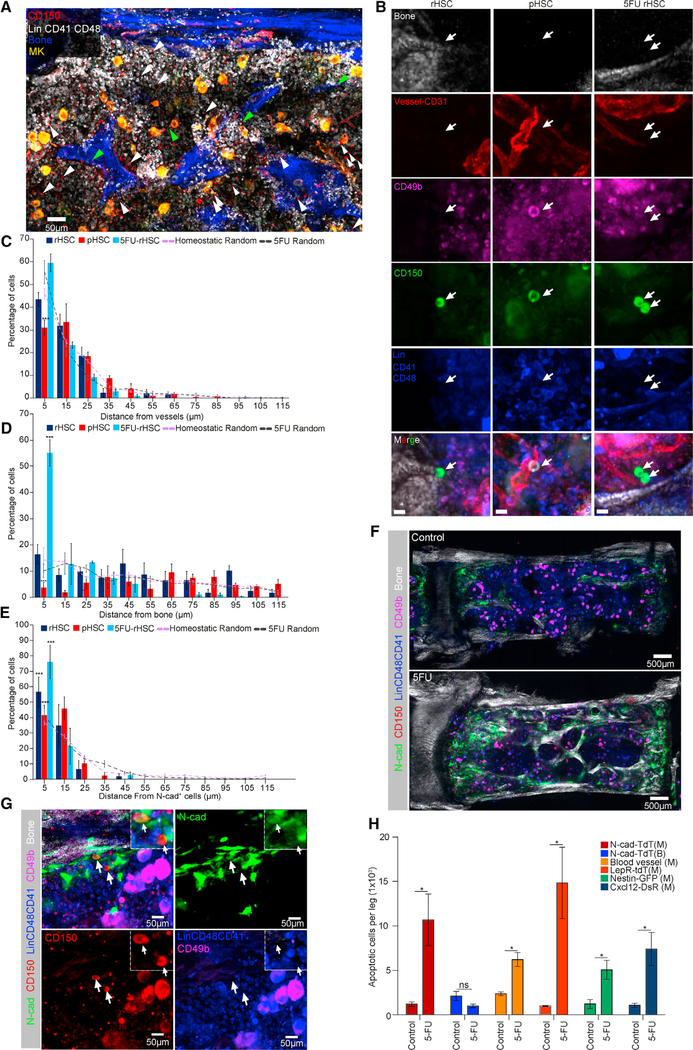
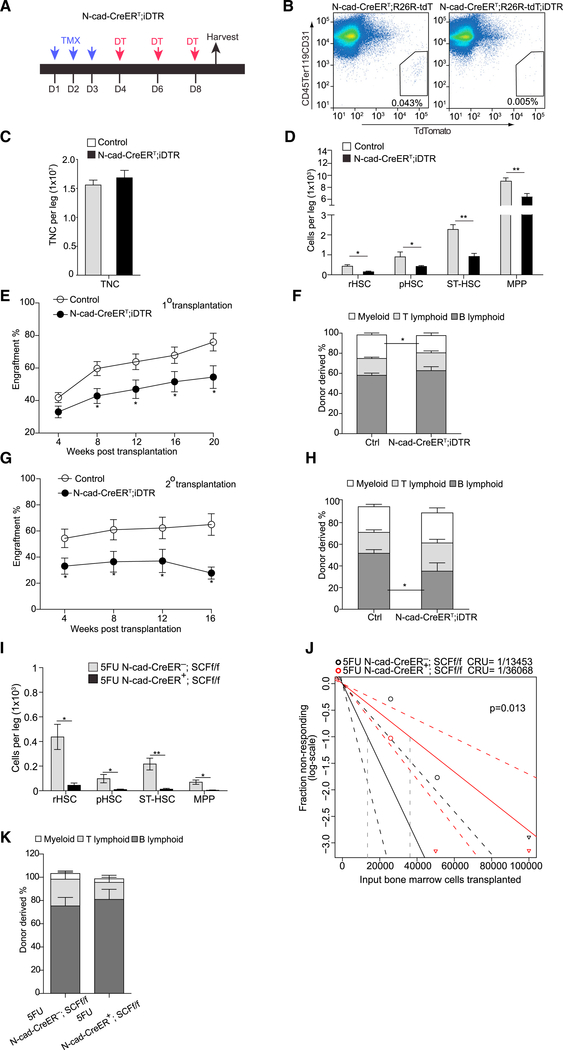
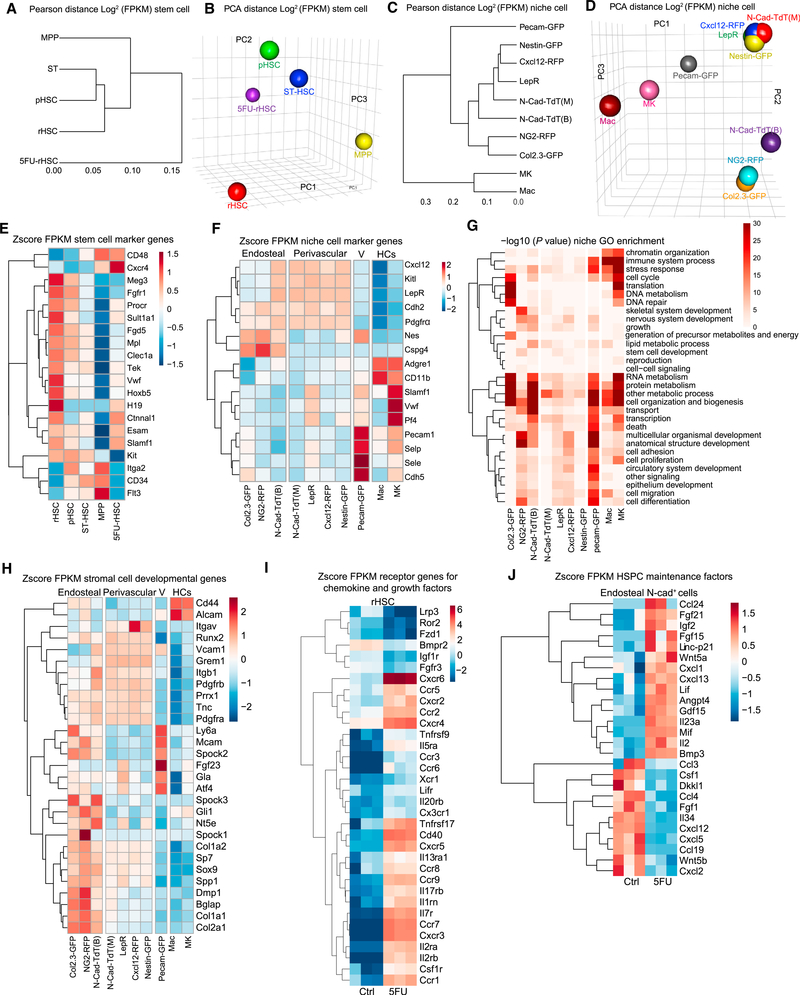
Regulation of hematopoietic stem cells (HSCs) by bone marrow (BM) niches has been extensively studied; however, whether and how HSC subpopulations are distinctively regulated by BM niches remain unclear. Here, we functionally distinguished reserve HSCs (rHSCs) from primed HSCs (pHSCs) based on their response to chemotherapy and examined how they are dichotomously regulated by BM niches. Both pHSCs and rHSCs supported long-term hematopoiesis in homeostasis; however, pHSCs were sensitive but rHSCs were resistant to chemotherapy. Surviving rHSCs restored the HSC pool and supported hematopoietic regeneration after chemotherapy. The rHSCs were preferentially maintained in the endosteal region that enriches N-cadherin+ (N-cad+) bone-lining cells in homeostasis and post-chemotherapy. N-cad+ cells were functional bone and marrow stromal progenitor cells (BMSPCs), giving rise to osteoblasts, adipocytes, and chondrocytes in vitro and in vivo. Finally, ablation of N-cad+ niche cells or deletion of SCF from N-cad+ niche cells impaired rHSC maintenance during homeostasis and regeneration.

Keywords: MSC; N-cadherin; endosteum; niche; reserve stem cell; stress response.


Conflict of interest statement

DECLARATION OF INTERESTS

The authors declare no competing interests.

Figures

Figure 1.
Figure 1.. Functional Identification of rHSC Population
(A) Fluorescence-activated cell sorting (FACS) of rHSCs, primed HSCs (pHSCs), ST-HSCs, and MPPs. (B) Transplantation of rHSCs and pHSCs. Peripheral blood (PB) analysis for donor engraft cells shown at indicated weeks post-transplantation. The percentage of donor-derived B, T, and myeloid lineage cells shown at 20 weeks post-transplantation (n = 10). (C) Donor-derived cells in recipient mice at 40 weeks post-transplantation from rHSCs or pHSCs. (D) H2B-GFP LRCs in rHSCs and pHSCs at 130 days post-chasing (n = 4). (E) Cell-cycle gene expression in rHSCs and pHSCs (n = 3 replicates from 20 mice). (F) rHSCs and pHSCs transplanted mice received 5FU at 4 weeks post-transplantation. PB analysis for donor engraft cells shown at indicated weeks post-transplantation. The percentage of donor-derived B, T, and myeloid lineage cells shown at 20 weeks post-transplantation (n = 10). (G) rHSCs and pHSCs at day 3 post-5FU (pool from 15 mice). (H) DNA damage gene expression in rHSCs and pHSCs (n = 3 replicates from 20 mice). (I) DNA damage genes in rHSCs (n = 20) and 5FU-rHSCs (n = 40). *p < 0.05, **p < 0.01, ***p < 0.001. Error bars, SEM. (J) Heatmap of stress-response genes in rHSCs, pHSCs, and 5FU rHSCs.
Figure 2.
Figure 2.. rHSCs Located by N-Cad+ Endosteal Region in BM Niche
(A) Representative whole-mount images of sternum, with bone (white by SHG) and megakaryocytes (MKs) (yellow, distinguished by size, morphology, and CD41 expression). Green and white arrowheads denote phenotypic rHSCs (LinCD48CD41CD150+CD49b) and pHSCs (LinCD48CD41CD150+CD49b+). (B) Representative images of rHSCs, pHSCs, and 5FU rHSCs (arrows). Scale bar, 10 μm. (C–E) Relative distance between rHSCs, pHSCs, and 5FU rHSCs to BVs (C), bone (D), or N-cad+ cells (E) (n = 51 rHSCs, n = 144 pHSCs, n = 102 5FU rHSCs in distance quantification of HSCs from BVs and bone; n = 40 rHSCs, n = 50 pHSCs, n = 34 5FU rHSCs in distance quantification of HSCs from N-cad+ cells). n = 3 mice for each distance quantification dataset. (F) Representative whole-mount images of N-cad-CreERT; R26-ZsG mice induced by TMX for 24 h, co-stained with CD150, Lin, CD41, CD48, and CD49b as well as SHG signal (control and day 3 after 5FU). (G) The rHSCs (arrows) localized near the N-cad+ bone surface after 5FU. Dashed-lined higher-power image (inset) shows one N-cad+ rHSC and one N-cad rHSC. (H) Absolute numbers of AnnexinV+ SytoxG stromal cells in control and day 3 post-5FU (n = 3). *p < 0.05, **p < 0.01, ***p < 0.001. Error bars, SEM.
Figure 3.
Figure 3.. N-Cad+ Cells Maintain Functional HSCs in BM Niche
(A) Protocol for DT injection to N-cad-CreERT; iDTR mice shown in (B)–(G). D, day. (B) Efficiency of ablating N-cad+ cells. (C and D) Absolute number of total nucleated cells (TNC) (C) and HSPCs (D) in the BM from N-cad-CreERT; iDTR mice post-TMX and DT injections (n = 5). (E–H) Total engrafted donor cells measured in PB in 1° (E) and 2° (G) transplantation. Percentage of donor-derived B, T, and myeloid lineage cells in 1° (F) and 2° (H) transplantation measured at 16 weeks (n = 10). (I) Absolute numbers of HSPCs in the BM from N-cad-CreERT; SCFf/f (n = 5) at 1 month post-TMX and 3 days after 5FU. (J) CRU frequency determined using ELDA (extreme limiting dilution analysis). (K) Percentage of donor-derived B, T, and myeloid lineage cells at 16 weeks post-transplantation (n = 10). *p < 0.05, **p < 0.01, ***p < 0.001. Error bars, SEM.
Figure 4.
Figure 4.. Transcriptome Analysis for Hematopoietic Cells and Niche Cells
(A–D) Pearson distance tree and PCA analysis for HSPCs (A and B) and niche cells (C and D). (E) HSC signature gene expression in HSPCs. (F) Niche signature gene expression in niche cells. (G) GO term analysis for niche cells. (H) Stromal cell development gene expression in niche cells from endosteal and perivascular zones. (I) Differential expression of chemokine and growth factor receptors in rHSCs and 5FU-rHSCs. Fold change (FC) >2; false discovery rate (FDR) <0.05. (J) Expression of selected cytokine, chemokine, and growth factors in endosteal N-cad+ cells in homeostasis and day 3 after 5FU from N-cad-CreERT; R26-tdT mice post-TMX induction.
Figure 5.
Figure 5.. In Vitro Differentiation and Localization of N-Cad+ Stromal Cells
(A) Protocol. (B) CFU-F colonies stained with Cell Trace with Tom+ cells in high magnification. (C–E) In vitro differentiation culture of stromal cells from N-cad-CreERT; R26-tdT mice at day 21: (C) live Tom+ cells and AP staining; (D) live Tom+ cells and oil red O lipid staining; (E) Aggrecan and toluidine-blue-stained chondrocytes. (F) Protocol for TMX induction. (G) Diagram of TB and CB in femur. (H) Tom+ cells (arrows) at indicated time post TMX. Black background area is outside the microscope tiling regions in stitched composite images. Scale bar, 50μm. (I) Percentage of Tom+ cells in TB, CB, and CM at indicated time post-TMX (n = 2 in 1- and 2-week groups, n = 3 in 4- and 6-week groups). *p < 0.05, **p < 0.01, ***p < 0.001. Error bars, SEM.
Figure 6.
Figure 6.. N-Cad+ Stromal Cells Give Rise to Osteoblasts and Adipocytes in Adult Mice
(A) Representative images of N-cad-CreERT; R26-tdT; Col2.3-GFP mice at indicated time post-TMX showing Tom+Col2.3-GFP+ osteoblasts. Scale bar, 100 μm. (B and C) High-power images of N-cad-CreERT; R26-tdT; Col2.3-GFP mice shown at 6 (B) and 14 h (C) post-TMX. Hollow arrows denote Tom+Col2.3GFP+ osteoblasts (yellow); solid arrows indicate that N-cad recombined in TB (i, ii, iv, v) and CB (iii, vi) (red) and cells potentially undifferentiated (Col2.3-GFP). Scale bar, 50 μm. (D and E) Image quantification of percentage of Tom+Col2.3-GFP+ and Tom+Col2.3-GFP cells in TB (D) and CB (E) at indicated time post-TMX (n = 2). (F) Image quantification of potentially undifferentiated Tom+Col2.3-GFP cells in TB and CB (n = 2). (G) Representative images of TB and CB in N-cad-CreERT; R26-tdT; Col2.3-GFP mice at 4 weeks post-TMX. Scale bar, 20 μm. (H) Representative images of femur section in N-cad-CreERT; R26-tdT mice with Perilipin staining in periosteal region (i), TB (ii), and CM (iii) (arrows) at 4 weeks post-TMX. (I) BODIPY staining showed the adiposome (green) inside the Tom+ Perilipin+ adipocyte (arrows). Scale bar, 20 μm. (J and K) Image quantification of Tom+Perilipin+ adipocytes in TB (J) and periosteal region (K) at 6, 14, and 24 h and 2 and 4 weeks post-TMX (n = 2). *p < 0.05, **p < 0.01, ***p < 0.001. Error bars, SEM.
Figure 7.
Figure 7.. N-Cad+ BMSPCs Give Rise to Chondrocytes during Development and Post-Injury
(A) Protocol. (B) Tom+ Aggrecan+ chondrocytes in rib at E14.5. (C) Chondrocyte development in femur. (D) Representative images of femur from 2-day-old N-cad-CreERT; R26-tdT mice with E12.5 TMX induction. Note the Tom+Aggrecan+ chondrocytes (arrows) in the articular surface (i) and the developing secondary ossification center (ii). (E and F) Representative images of femur from 10- and 2-month-old N-cad-CreERT; R26-tdT mice with E12.5 TMX induction. N-cad+ cells differentiated to Perilipin+ adipocytes (E), Osteopontin+ hypertrophic chondrocytes (F) (i and ii), and osteoblasts (iii, iv, v, and vi). (G) Protocol for femoral groove injury. (H) Quantification of Tom+ chondrocytes in control and 3 weeks after injury. (I) Representative images of distal femur from N-cad-CreERT; R26-tdT mice. Note the clustered Tom+ Aggrecan+ cells (arrows) at the knee surface of control (i) and 3 weeks after injury (ii). (J) Alcian blue-hematoxylin-Orange G staining showing the Alcian blue+ chondrocytes in control (i) and at the injury site (ii).

Comment in

References

    1. Acar M, Kocherlakota KS, Murphy MM, Peyer JG, Oguro H, Inra CN, Jaiyeola C, Zhao Z, Luby-Phelps K, and Morrison SJ (2015). Deep imaging of bone marrow shows non-dividing stem cells are mainly perisinusoidal. Nature 526, 126–130. - PMC - PubMed
    1. Anders S, Pyl PT, and Huber W. (2015). HTSeq—a Python framework to work with high-throughput sequencing data. Bioinformatics 31, 166–169. - PMC - PubMed
    1. Arai F, Hirao A, Ohmura M, Sato H, Matsuoka S, Takubo K, Ito K, Koh GY, and Suda T. (2004). Tie2/angiopoietin-1 signaling regulates hematopoietic stem cell quiescence in the bone marrow niche. Cell 118, 149–161. - PubMed
    1. Arnold MA, Kim Y, Czubryt MP, Phan D, McAnally J, Qi X, Shelton JM, Richardson JA, Bassel-Duby R, and Olson EN (2007). MEF2C transcription factor controls chondrocyte hypertrophy and bone development. Dev. Cell 12, 377–389. - PubMed
    1. Baldridge MT, King KY, Boles NC, Weksberg DC, and Goodell MA (2010). Quiescent haematopoietic stem cells are activated by IFN-gamma in response to chronic infection. Nature 465, 793–797. - PMC - PubMed

Publication types