. 2019 Jan 15;50(1):137-151.e6.
doi: 10.1016/j.immuni.2018.11.013.

Fever Promotes T Lymphocyte Trafficking via a Thermal Sensory Pathway Involving Heat Shock Protein 90 and α4 Integrins

Affiliations

Fever Promotes T Lymphocyte Trafficking via a Thermal Sensory Pathway Involving Heat Shock Protein 90 and α4 Integrins

ChangDong Lin et al. Immunity. .

Abstract

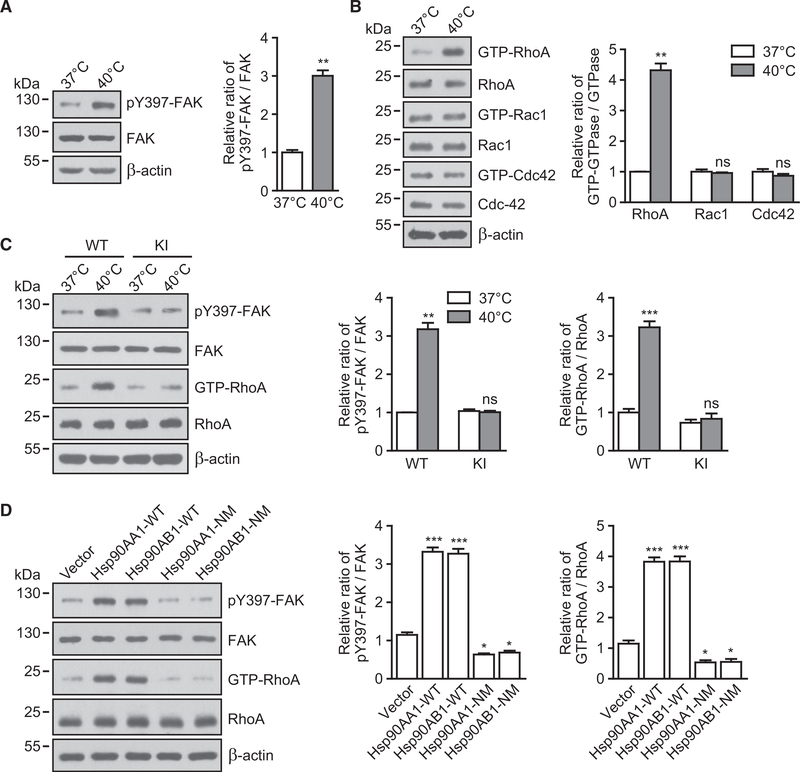
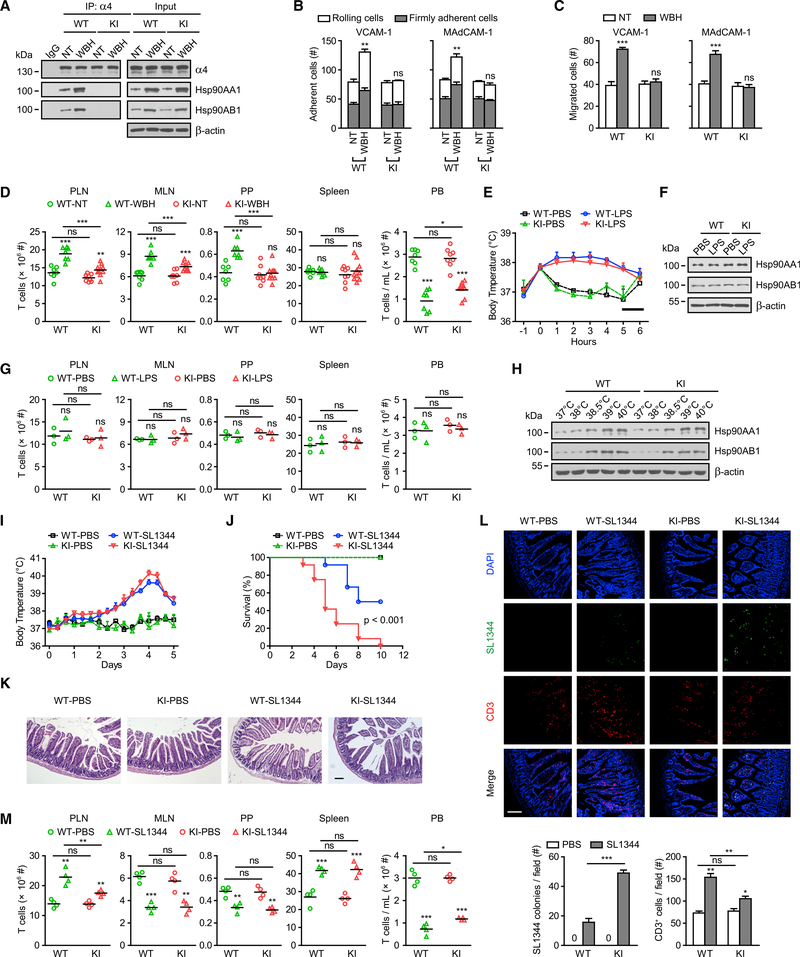
Fever is an evolutionarily conserved response that confers survival benefits during infection. However, the underlying mechanism remains obscure. Here, we report that fever promoted T lymphocyte trafficking through heat shock protein 90 (Hsp90)-induced α4 integrin activation and signaling in T cells. By inducing selective binding of Hsp90 to α4 integrins, but not β2 integrins, fever increased α4-integrin-mediated T cell adhesion and transmigration. Mechanistically, Hsp90 bound to the α4 tail and activated α4 integrins via inside-out signaling. Moreover, the N and C termini of one Hsp90 molecule simultaneously bound to two α4 tails, leading to dimerization and clustering of α4 integrins on the cell membrane and subsequent activation of the FAK-RhoA pathway. Abolishment of Hsp90-α4 interaction inhibited fever-induced T cell trafficking to draining lymph nodes and impaired the clearance of bacterial infection. Our findings identify the Hsp90-α4-integrin axis as a thermal sensory pathway that promotes T lymphocyte trafficking and enhances immune surveillance during infection.

Keywords: Hsp90; fever; lymphocyte trafficking; thermal stress; α4 integrins.


Conflict of interest statement

DECLARATION OF INTERESTS

The authors declare no competing interests.

Figures

Figure 1.
Figure 1.. Effect of Fever-Range Thermal Stress on Integrin-Mediated T Cell Adhesion and Transmigration
T cells from C57BL/6J mouse spleens were pre-treated at 37°C or 40°C in culture medium with or without 100 ng/mL PTX for 12 hr. α4β7-VCAM-1 binding was disrupted by cell pre-treatment with 10 μg/mL α4β7-blocking antibody DATK32 during examination of α4β1-mediated cell adhesion and migration on VCAM-1 substrate in (B) and (C). (A) Cell-surface expression of α4 and β2 integrins was determined by flow cytometry. Numbers within the table show the specific mean fluorescence intensities and p values. (B) Adhesion of T cells to the immobilized VCAM-1-Fc (5 μg/mL), MAdCAM-1-Fc (5 μg/mL), or ICAM-1-Fc (5 μg/mL) substrate in the presence of 1 mM Ca2+ + Mg2+ under flow condition. The numbers of rolling and firmly adherent cells were measured at a wall shear stress of 1 dyn/cm2. Cells pre-treated with α4-blockingantibody PS/2 (10 μg/mL), α4β7-blocking antibody DATK32 (10 μg/mL), or β2-blocking-antibody 2E6 (10 μg/mL) were used as controls. (C) Transmigration of T cells across membranes coated in VCAM-1-Fc (5 μg/mL), MAdCAM-1-Fc (5 μg/mL), or ICAM-1-Fc (5 μg/mL) in the absence and presence of CCL21 (500 ng/mL) in the lower chamber. Data represent the mean ± SEM (n ≥ 3). **p < 0.01; ***p < 0.001; ns, not significant (Student’s t test). The asterisk in (B) indicates the changes in total adherent cells.
Figure 2.
Figure 2.. Fever-Range Thermal Stress Upregulates the Expression of Hsp90 and Promotes Its Binding to α4 Integrins in T Cells
(A) Immunoblot analysis of integrin α4, integrin β2, and Hsps in whole-cell lysate (WCL) of T cells pre-treated at 37°C or 40°C and co-immunoprecipitation of Hsps with integrin α4 or β2 in the cell-membrane fractions. (B–D) T cells were transiently transfected with vector, Hsp90AA1, or Hsp90AB1. α4β7-VCAM-1 binding was disrupted by cell pre-treatment with 10 μg/mL α4β7-blocking antibody DATK32 during examination of α4β1-mediated cell adhesion and migration on VCAM-1 substrate in (C) and (D). Co-immunoprecipitation of Hsp90AA1 or Hsp90AB1 with integrin α4 in the membrane fractions of T cells is shown in (B). Adhesion of T cells to immobilized VCAM-1-Fc (5 μg/mL), MAdCAM1-Fc (5 μg/mL), or ICAM-1-Fc (5 μg/mL) substrate in 1 mM Ca2+ + Mg2+ at a wall shear stress of 1 dyn/cm2 is shown in (C). Transmigration of T cells across membranes coated in VCAM-1-Fc (5 μg/mL), MAdCAM-1-Fc (5 μg/mL), or ICAM-1-Fc (5 μg/mL) in the presence of CCL21 (500 ng/mL) in the lower chamber is shown in (D). One representative result of three independent experiments is shown in (A) and (B). Data represent the mean ± SEM (n ≥ 3) in (C) and (D). **p < 0.01; ***p < 0.001; ns, not significant (one-way ANOVA with Dunnett post-tests). The asterisk in (C) indicates the changes in total adherent cells. See also Figures S1 and S2 and Table S1.
Figure 3.
Figure 3.. The Binding of Hsp90 to the α4 Tail Is Crucial for Fever-Induced T Cell Adhesion and Transmigration
(A–C) Precipitation of Hsp90AA1 and Hsp90AB1 from T cell lysate by Ni2+-charged resins loaded with the indicated integrin-tail model proteins. Coomassie blue staining of gels was used for assessing the loading of each integrin-tail model protein. WT α4, β1, and β7 tails were used in (A); α4-tail truncations were tested in (B), and the schematic diagram shows WT and truncated α4-tail constructs; and single-point mutants of the α4 tail were tested in (C). (D) Schematic diagram of Hsp90 structures. Abbreviations are as follows: NTD, N-terminal domain; MD, middle domain; and CTD, C-terminal domain. (E) The HA-tagged NTD, MD, or CTD of Hsp90AA1 or Hsp90AB1 was overexpressed in T cells and then co-immunoprecipitated with integrin α4 in the cell-membrane fractions. (F) Precipitation of recombinant GST-tagged NTD and CTD proteins of Hsp90AA1 or Hsp90AB1 by Ni2+-charged resins loaded with α4-tail model protein. (G–K) WT T cells or Itga4R985A/R985A (KI) T cells were pre-treated at 37°C or 40°C in culture medium for 12 hr. α4β7-VCAM-1 binding was disrupted by cell pre-treatment with 10 μg/mL α4β7-blocking antibody DATK32 during examination of α4β1-mediated cell adhesion and migration on VCAM-1 substrate in (H) and (I). Hsp90AA1 and Hsp90AB1 were co-immunoprecipitated with integrin α4 in the cell-membrane fractions (G). Adhesion of T cells to immobilized VCAM-1-Fc (5 μg/mL) or MAdCAM-1-Fc (5 μg/mL) substrate in 1 mM Ca2+ + Mg2+ at a wall shear stress of 1 dyn/cm2 is shown in (H). Transmigration of T cells across membranes coated in VCAM-1-Fc (5 μg/mL) or MAdCAM-1-Fc (5 μg/mL) in the presence of CCL21 (500 ng/mL) in the lower chamber is shown in (I). Intravital microscopy of the interactions between calcein-labeled WT or KI T cells and the inguinal lymph node venular tree of WT recipient mice is shown. Transient tethering, rolling, and sticking fractions of WT and KI T cells are shown. Cells pre-treated with α4-blocking-antibody PS/2 (10 μg/mL) were used as controls (J). In vivo short-term homing of calcein-labeled WT or KI T cells to inguinal lymph nodes of WT mice is shown. Cells pre-treated with α4-blocking-antibody PS/2 (10 μg/mL) were used as controls. The homing index was calculated as the percentage of the homed T cells in inguinal lymph nodes in relation to that of WT T cells pre-treated at 37°C without PS/2 antibody treatment (K). One representative result of three independent experiments is shown in (A)–(C) and (E)–(G). Data represent the mean ± SEM (n ≥ 3) in (H)–(K). *p < 0.05; **p < 0.01; ***p < 0.001; ns, not significant (Student’s t test). The asterisk in (H) indicates the changes in total adherent cells. See also Figure S3.
Figure 4.
Figure 4.. Hsp90 Induces α4 Integrin Activation
(A and B) Binding of soluble VCAM-1-Fc and MAdCAM-1-Fc to WT and KI T cells pre-treated at 37°C or 40°C (A) or to T cells transfected with vector, Hsp90AA1, or Hsp90AB1 (B) was calculated with the specific mean fluorescence intensity and quantified as a percentage of α4 expression. α4β7-VCAM-1 binding was disrupted by cell pre-treatment with 10 μg/mL α4β7-blocking antibody DATK32 during examination of α4β1-mediated soluble VCAM-1 binding. Cells pre-treated with the α4-blocking-antibody PS/2 (10 μg/mL) or α4β7-blocking antibody DATK32 (10 μg/mL) were used as a negative control for VCAM-1 or MAdCAM-1 binding, respectively, in (A). (C and D) Effect of fever-range thermal stress (C) or Hsp90 overexpression (D) on the conformation of α4 ectodomain in WT or KI T cells. FRET efficiency between integrin α4 β-propeller domain and the plasma membrane was calculated. (E and F) Co-immunoprecipitation of talin or kindlin-3 with α4 integrins in T cells pre-treated at 37°C or 40°C (E) or T cells transfected with vector, Hsp90AA1, or Hsp90AB1 (F). (G–L) T cells with talin or kindlin-3 silencing were pre-treated at 37°C or 40°C in culture medium for 12 hr. Co-immunoprecipitation of talin (G) or kindlin-3 (H) with α4 integrins in T cells is shown in (G) and (H). Binding of soluble VCAM-1-Fc and MAdCAM-1-Fc to T cells with talin (I) or kindlin-3 (J) silencing was calculated with the specific mean fluorescence intensity and quantified as a percentage of α4 expression. α4β7-VCAM-1 binding was disrupted by cell pre-treatment with 10 μg/mL α4β7-blocking antibody DATK32 during examination of α4β1-mediated soluble VCAM-1 binding (I and J). The conformation of α4 ectodomain in T cells with talin (K) or kindlin-3 (L) silencing is shown. FRET efficiency between integrin α4 β-propeller domain and the plasma membrane was calculated (K and L). One representative result of three independent experiments is shown in (E)–(H). Data represent the mean ± SEM (n ≥ 3) in (A)–(D) and (I)–(L). *p < 0.05; **p < 0.01; ***p < 0.001; ns, not significant (Student’s t test in A, C, and I–L; one-way ANOVA with Dunnett post-tests in B and D).
Figure 5.
Figure 5.. Hsp90 Induces α4 Integrin Dimerization and Clustering on the Plasma Membrane via Its NTD and CTD
(A) Design of a reporter of integrin α4 dimerization on the plasma membrane according to the BiFC-split GFP system. (B and C) Relative GFP fluorescence of T cells expressing WT α4 integrin-split GFP or α4(R985A) integrin-split GFP and pre-treated at 37°C or 40°C (B) or transfected with vector, Hsp90AA1, or Hsp90AB1 (C) was calculated with the mean fluorescence intensity of GFP and quantified as a percentage of α4 integrin expression. (D) Confocal microscopy visualization of the integrin clustering on the plasma membrane. White arrowheads indicate the representative integrin clusters. Scalebars, 3 μm. (E) Schematic diagram of WT and mutant Hsp90. Abbreviations are as follows: NM, CTD truncation; MC, NTD truncation; and NC5, deletion of C-terminal 49 amino acids in the CTD to disrupt Hsp90 homodimerization. (F) Cell lysates of T cells transiently expressing HA-tagged Hsp90 WT, NM, or MC mutant were loaded onto a native-PAGE, and then HA-tagged proteins were detected by immunoblot. (G) Relative GFP fluorescence of T cells expressing WT α4-integrin-split GFP and transfected with vector, Hsp90 WT, or NM or MC mutant was calculated with the mean fluorescence intensity of GFP and quantified as a percentage of α4 integrin expression. (H) Cell lysates of T cells transiently expressing HA-tagged Hsp90 WT or NC5 mutant were loaded onto a native-PAGE, and then HA-tagged proteins weredetected by immunoblot. (I) Relative GFP fluorescence of T cells expressing WT α4-integrin-split GFP and transfected with vector, Hsp90 WT, or NC5 mutant was calculated with the mean fluorescence intensity of GFP and quantified as a percentage of α4 integrin expression. One representative result of three independent experiments is shown in (D), (F), and (H). Data represent the mean ± SEM (n = 3) in (B), (C), (G), and (I). *p < 0.05; **p < 0.01; ***p < 0.001; ns, not significant (Student’s t test in B, G, and I; one-way ANOVA with Dunnett post-tests in C, G, and I). See also Figures S4 and S5.
Figure 6.
Figure 6.. Hsp90-α4 Binding Activates the FAK-RhoA Pathway
(A) Immunoblot analysis of FAK phosphorylation (pY397) in T cells pre-treated at 37°C or 40°C. The relative pY397-FAK/FAK ratio was normalized to the value of cells pre-treated at 37°C. (B) Effect of fever-range thermal stress on Rho GTPase activation. GTP-bound RhoA, Rac1, and Cdc42 were detected by binding to recombinant GST-RBD orGST-PBD in T cells pre-treated at 37°C or 40°C by GST precipitation assays. The relative GTP-GTPase/GTPase ratio was normalized to the value of cells pre-treated at 37°C. (C) Immunoblot analysis of FAK phosphorylation (pY397) and RhoA activation in WT or KI T cells pre-treated at 37°C or 40°C. The relative pY397-FAK/FAK and GTP-RhoA/RhoA ratios were normalized to the values of WT T cells pre-treated at 37°C. (D) Immunoblot analysis of FAK phosphorylation (pY397) and RhoA activation in T cells transfected with vector, Hsp90 WT, or NM mutants. The relative pY397-FAK/FAK and GTP-RhoA/RhoA ratios were normalized to the values of cells transfected with vector. One representative result of three independent experiments is shown. Data represent the mean ± SEM (n = 3). *p < 0.05; **p < 0.01; ***p < 0.001; ns, not significant (Student’s t test in A–C; one-way ANOVA with Dunnett post-tests in D).
Figure 7.
Figure 7.. Disruption of Hsp90-α4 Interaction Inhibits Fever-Induced T Cell Trafficking In vivo and Impairs the Clearance of Bacterial Infection
(A–D) WT and KI C57BL/6J mice were treated with normothermia (NT; core temperature 36.8°C ± 0.2°C) or fever-range whole-body hyperthermia (WBH; core temperature 39.5°C ± 0.5°C) for 6 hr (n = 7–10 mice per group) and then were sacrificed. T cells were isolated from the spleen. α4β7-VCAM-1 binding was disrupted by cell pre-treatment with 10 μg/mL α4β7-blocking antibody DATK32 during examination of α4β1-mediated cell adhesion and migration on VCAM-1 substrate in (B) and (C). Co-immunoprecipitation of Hsp90AA1 and Hsp90AB1 with integrin α4 in the cell-membrane fractions is shown in (A). Adhesion of T cells to immobilized VCAM-1-Fc (5 μg/mL) or MAdCAM-1-Fc (5 μg/mL) substrate in 1 mM Ca2+ + Mg2+ at a wall shear stress of 1 dyn/cm2 is shown in (B). Transmigration of T cells across membranes coated in VCAM-1-Fc (5 μg/mL) or MAdCAM-1-Fc (5 μg/mL) in the presence of CCL21 (500 ng/mL) in the lower chamber is shown in (C). The total numbers of T cells in PLNs, MLNs, PPs, spleen, and PB were quantified (D). (E–G) WT and KI mice were injected with LPS (10 μg/kg) or PBS at time zero (n = 3 mice per group). Body temperature was monitored every hour. The bar shows the dark period (E). Immunoblot analysis of Hsp90AA1 and Hsp90AB1 in T cells isolated from PLNs in mice is shown in (F). The total numbers of T cells in PLNs, MLNs, PPs, spleen, and PB were quantified (G). (H) Effect of different temperatures on the expression of Hsp90. T cells were isolated from PLNs in WT mice and then treated at 37°C, 38°C, 38.5°C, 39°C, or 40°C for 12 hr. Immunoblot analysis of Hsp90AA1 and Hsp90AB1 in T cells is shown. (I–M) WT and KI mice were orally injected with PBS or S. typhimurium strain SL1344 (108 CFU per mouse; n = 4–12 mice per group). Body temperature was monitored for 5 days (I). The survival rates of WT and KI mice are shown in (J), and significance was calculated as given. H&E staining of the small intestine at day 5 after infection is shown in (K) (scale bar, 100 mm). Immunofluorescence analysis of the small intestine sections at day 5 after infection is shown. Stain coloring is as follows: DAPI, blue; S. typhimurium expressing GFP, green; and CD3, red. Quantifications of S. typhimurium colonies and CD3+ cells are shown below in (L) (scale bar, 100 mm). The total numbers of T cells in PLNs, MLNs, PPs, spleen, and PB were quantified at day 5 after infection (M). One representative result of three independent experiments is shown in (A), (F), (H), (K), and (L). Data represent the mean ± SEM in (B)–(E), (G), (I), (L), and (M). *p < 0.05; **p < 0.01; ***p < 0.001; ns, not significant (Student’s t test). The asterisk in (B) indicates the changes in total adherent cells. See also Figures S6 and S7.

Comment in

  • T cells feel the heat.
    Bird L. Bird L. Nat Rev Immunol. 2019 Mar;19(3):139. doi: 10.1038/s41577-019-0134-7. Nat Rev Immunol. 2019. PMID: 30728475 No abstract available.

References

    1. Berlin-Rufenach C, Otto F, Mathies M, Westermann J, Owen MJ, Hamann A, and Hogg N (1999). Lymphocyte migration in lymphocyte function-associated antigen (LFA)-1-deficient mice. J. Exp. Med 189, 1467–1478. - PMC - PubMed
    1. Boscacci RT, Pfeiffer F, Gollmer K, Sevilla AI, Martin AM, Soriano SF, Natale D, Henrickson S, von Andrian UH, Fukui Y, et al. (2010). Comprehensive analysis of lymph node stroma-expressed Ig superfamily members reveals redundant and nonredundant roles for ICAM-1, ICAM-2, and VCAM-1 in lymphocyte homing. Blood 116, 915–925. - PMC - PubMed
    1. Butcher EC, and Picker LJ (1996). Lymphocyte homing and homeostasis. Science 272, 60–66. - PubMed
    1. Cabantous S, and Waldo GS (2006). In vivo and in vitro protein solubility assays using split GFP. Nat. Methods 3, 845–854. - PubMed
    1. Calderwood DA, Campbell ID, and Critchley DR (2013). Talins and kindlins: partners in integrin-mediated adhesion. Nat. Rev. Mol. Cell Biol 14, 503–517. - PMC - PubMed

Publication types

MeSH terms