. 2019 Jan 15;50(1):212-224.e4.
doi: 10.1016/j.immuni.2018.12.015.

Microbiotas from Humans with Inflammatory Bowel Disease Alter the Balance of Gut Th17 and RORγt+ Regulatory T Cells and Exacerbate Colitis in Mice

Affiliations

Microbiotas from Humans with Inflammatory Bowel Disease Alter the Balance of Gut Th17 and RORγt+ Regulatory T Cells and Exacerbate Colitis in Mice

Graham J Britton et al. Immunity. .

Abstract

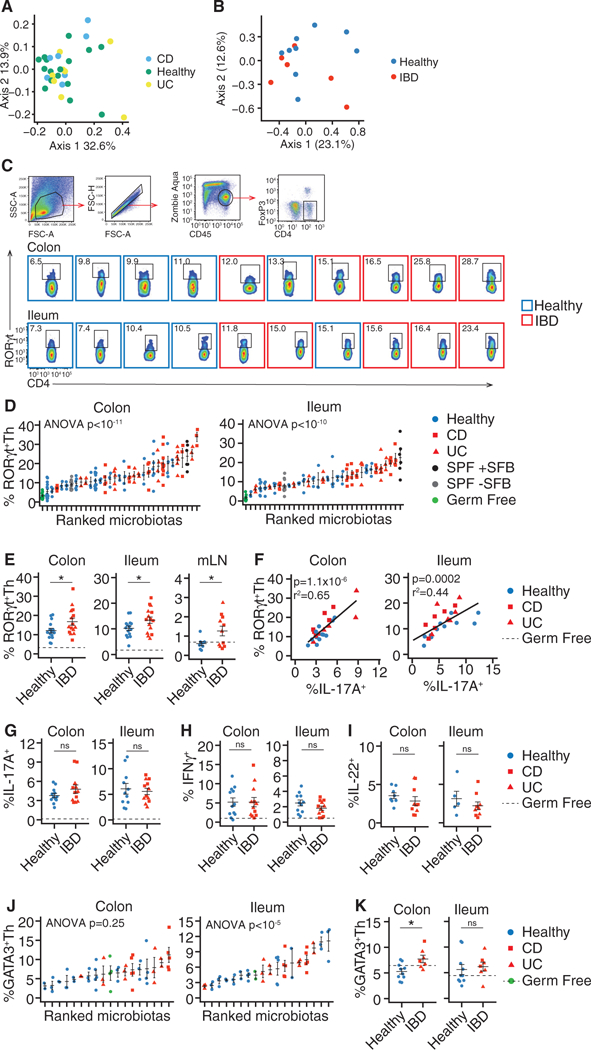
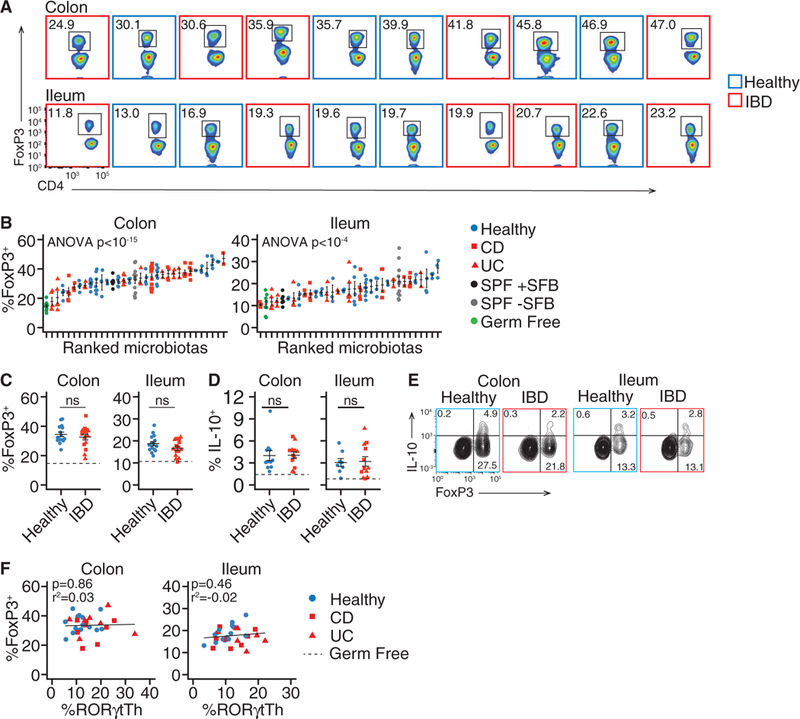
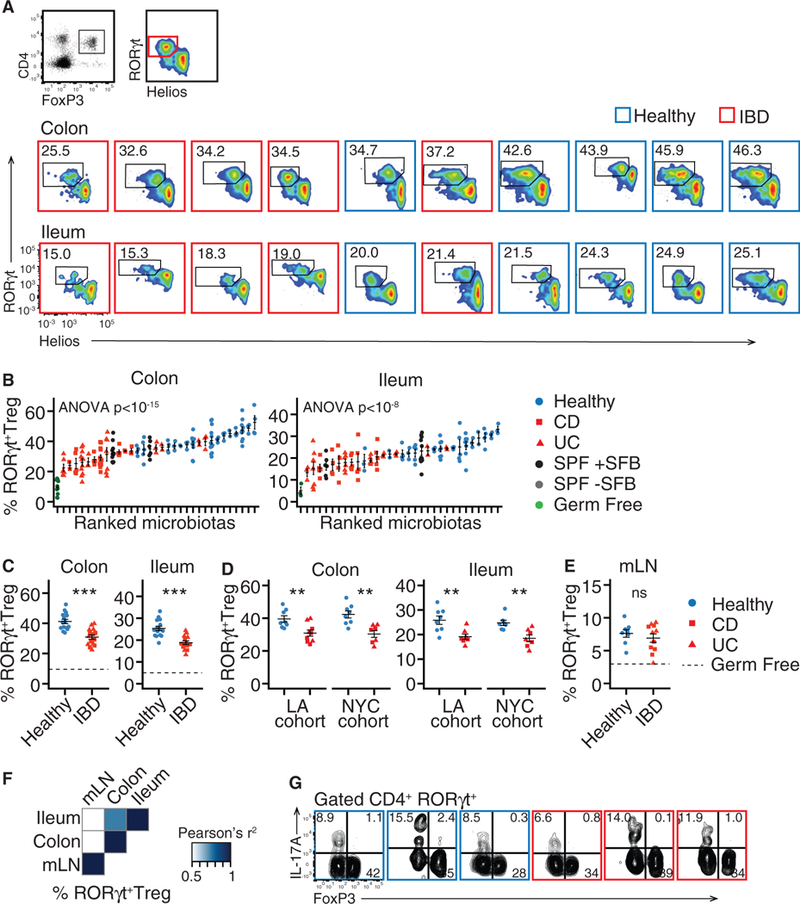
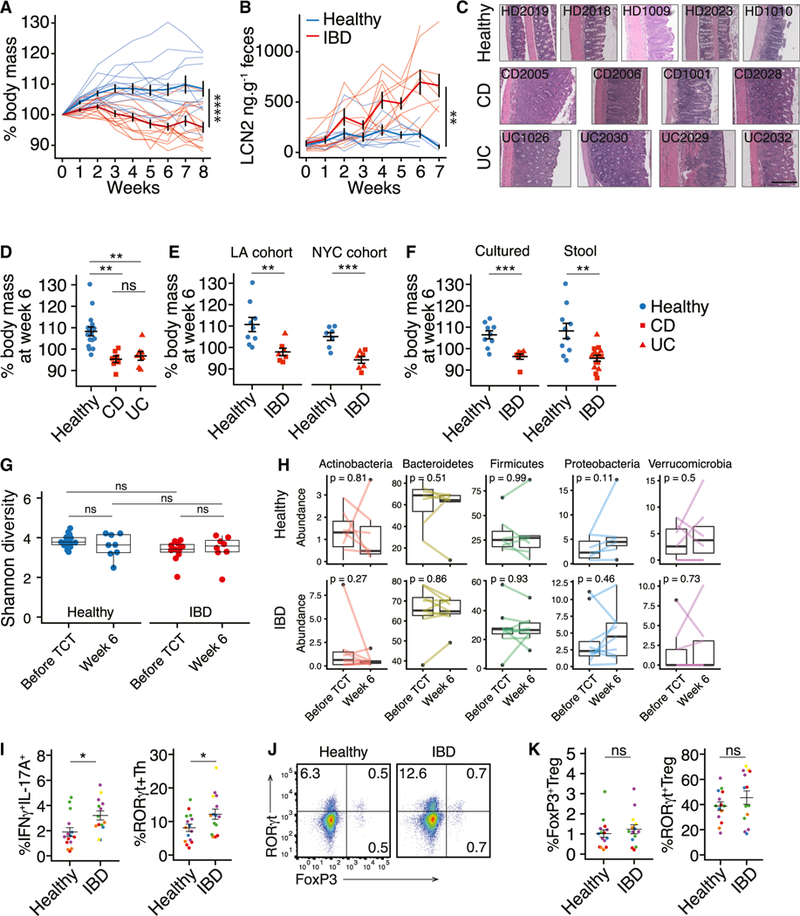
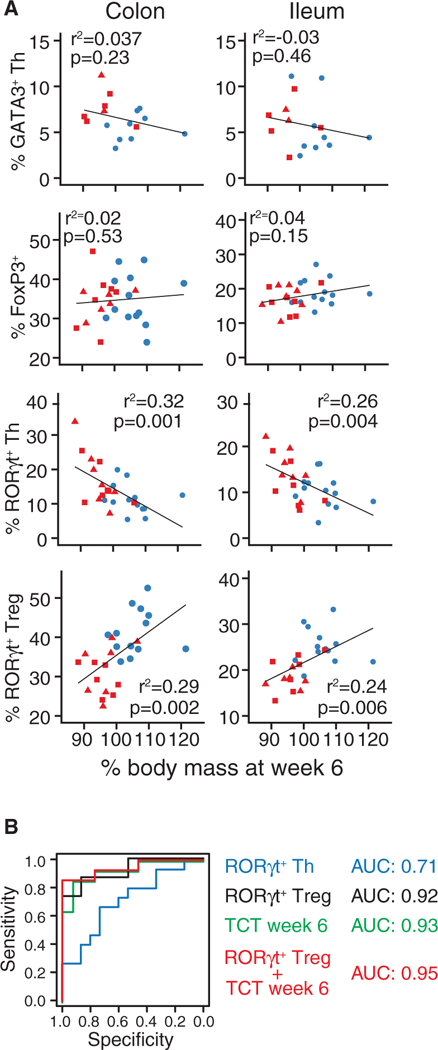
Microbiota are thought to influence the development and progression of inflammatory bowel disease (IBD), but determining generalizable effects of microbiota on IBD etiology requires larger-scale functional analyses. We colonized germ-free mice with intestinal microbiotas from 30 healthy and IBD donors and determined the homeostatic intestinal T cell response to each microbiota. Compared to microbiotas from healthy donors, transfer of IBD microbiotas into germ-free mice increased numbers of intestinal Th17 cells and Th2 cells and decreased numbers of RORγt+ Treg cells. Colonization with IBD microbiotas exacerbated disease in a model where colitis is induced upon transfer of naive T cells into Rag1-/- mice. The proportions of Th17 and RORγt+ Treg cells induced by each microbiota were predictive of human disease status and accounted for disease severity in the Rag1-/- colitis model. Thus, an impact on intestinal Th17 and RORγt+ Treg cell compartments emerges as a unifying feature of IBD microbiotas, suggesting a general mechanism for microbial contribution to IBD pathogenesis.


Conflict of interest statement

DECLARATION OF INTERESTS

D.G. and A.D. are employees of Janssen Research & Development LLC. J.B. is on the scientific advisory boards of Prolacta Bioscience, Inc. and Janssen Research & Development LLC. J.J.F. is on the scientific advisory board of Vedanta and is a consultant for Janssen Research & Development LLC.

Figures

Figure 1.
Figure 1.. Increased Frequencies of RORγt+ Th Cells in Mice Colonized with IBD-Associated Microbiotas as Compared to Mice Colonized with Healthy Donor Microbiotas
Germ-free B6 mice were colonized with fecal microbiotas from human donors with and without IBDwhose composition was assayed by16S rRNA amplicon sequencing. Effector CD4+ T cells from the colon, ileum, and mLN of these mice were analyzed by flow cytometry. (A) PCoA based on unweighted UniFrac distances of 16S rRNA amplicon sequencing of the human donor fecal microbiotas used in this study. (B) PCoA based on Jaccard distances comparing the species-level composition of the arrayed culture collections of microbes used in the study. (C and D) Colon and ileum RORγt+ Th cells in individual mice. (E) The mean proportion of RORγt+ Th cells in the colon, ileum, and mLN ofgroupsofmice colonized with the same microbiotas. (F) Correlation between the proportions of RORγt+ Th cells and IL-17A+CD4+ T cells. (G–I) The mean proportion of (G) IL-17A+CD4+ Tcells, (H) IFN-γ+CD4+Tcells, and (I) IL-22+Tcells in colon and ileum. (J) Colon and ileum GATA3+ Th cells in individual mice. (K) The mean proportion of GATA3+ Th cells in the colon and ileum of groups of mice colonized with the same microbiotas. The numbers of RORγt+ Th and GATA3+ Th cells are presented as the proportion of live, CD45+, CD4+, FoxP3 cells. The numbers of cytokine+ cells are presented as a proportion of live, CD45+, CD4+ cells. Flow cytometry plots include data acquired at different times, thus gating differs between plots. (C–K) n = 15 healthy, 8 UC, and 7 CD microbiotas (RORγt), n = 11 healthy, 6 UC, and 7 CD microbiotas (IFN-γ and IL-17A), n = 8 healthy, 4 UC, and 6 CD microbiotas (IL-22), n = 10 healthy, 5 UC, and 2 CD microbiotas (GATA3). (D and J) Each point represents data from one mouse, in all other plots each point representsthe mean value ofagroup of 2–12 mice colonized with a single microbiota. ns, not significant; *p < 0.05, Student’s t test; solid horizontal lines indicate mean ± SEM, dashed horizontal lines represent the mean proportion of the cell type in germ-free mice. Regression p values in (F) calculated by f-test. See also Figure S1.
Figure 2.
Figure 2.. Similar Frequencies of FoxP3+ Treg Cells in Mice Colonized with IBD Microbiotas and Those Colonized with Healthy Microbiotas
Germ-free B6 mice were colonized with fecal microbiotas from human donors with and without IBD. Regulatory T cells from the colon and ileum of these mice were analyzed by flow cytometry. (A and B) The proportion of FoxP3+ Treg cells in each mouse colonized with different donor microbiotas. (C and D) The mean proportion of(C) FoxP3+Treg cells and (D) IL-10+CD4+T cells in the colon and ileum of groups of mice colonized with the same microbiotas. (E) Co-expression of FoxP3 and IL-10 in CD4+ T cells from colon and ileum. (F) Correlation between RORγt+ Th cells and FoxP3+ Treg cells from colon and ileum. The numbers of FoxP3+ and IL-10+ cells are presented as a proportion of live, CD45+, CD4+ cells. Flow cytometry plots include data acquired at different times, thus gating differs between plots. (A–D) n = 11 healthy, 6 UC, and 7 CD microbiotas; (E) representative data from three healthy and three IBD microbiotas. (B) Each point represents data from one mouse, in all other dot plots each point represents the mean value of a group of 3–12 mice colonized with a single microbiota. ns, not significant, Student’s t test; solid horizontal lines indicate mean ± SEM, dashed horizontal lines represent the mean proportion of the cell type in germ-free mice. Regression p values in (F) calculated by f-test.
Figure 3.
Figure 3.. Transfer of Microbiotas from Healthy Donors Increases Gut RORγt+ Treg Cells
Germ-free B6 mice were colonized with fecal microbiotas from human donors with and without IBD. Regulatory T cell subsets in the colon and ileum of these mice were analyzed by flow cytometry. (A and B) The proportion of gut RORγt+ Treg cells varies in individual mice. (C and D) The mean proportion of RORγt+ Treg cells the colon and ileum of groups of mice colonized with the same microbiotas. The data separated according to cohort shown in (D). (E) The mean proportion of RORγt+ Treg cells the mLN of groups of mice colonized with the same microbiotas. (F) Correlation between the proportion of RORγt+ Treg cells in different tissues in mice colonized with the same microbiotas. (G) Co-expression of FoxP3 and IL-17A in CD4+ T cells. Each plot shows data from a different microbiota. The numbers of RORγt+ Treg cells are presented as a proportion of live, CD45+, CD4+, FoxP3+ cells. Flow cytometry plots include data acquired at different times, thus gating differs between plots. (A–F) n = 15healthy, 8 UC, and 7 CD microbiotas; (B) each point represents data from one mouse, in all other dot plots each point represents the mean value of a group of 2–12 mice colonized with a single microbiota. Data in (G) is representative of three mice colonized per microbiota. ns, not significant; *p < 0.05, **p < 0.01, ***p < 0.001, Student’s t est; solid horizontal lines indicate mean ± SEM, dashed horizontal lines represent the mean proportion of the cell type in germ free mice. Regression p values calculated by f-test. See also Figure S2.
Figure 4.
Figure 4.. IBD-Associated Microbiotas Transmit Enhanced Colitis Severity to Susceptible Mice
Colitis was induced by transferring naive CD4+ T cells into Ragl-deficient mice colonized with healthy or IBD donor microbiotas. (A and B) Loss of body mass and fecal lipocalin2 (LCN2) in RagTCT mice colonized with IBD and healthy microbiotas. Thin lines represent the mean data from a group of5–15 mice colonized with a single microbiota and bold lines represent the mean ± SEM of all groups of mice colonized with either healthy donor or IBD donor microbiotas. (C) Representative H&E-stained colon sections from RagTCT mice colonized with different human donor microbiotas 5–7 weeks after T cell transfer. Scale bar = 200 μm. (D) Change in body mass at week 6 in RagTCT mice colonized with healthy, UC, or CD microbiotas. (E and F) Colitis severity in RagTCT mice colonized with microbiotas from (E) two cohorts and (F) with stool and cultured IBD microbiotas. (G) Shannon diversity of RagTCT mouse fecal microbiotas before and after colitis induction, based on 16S rRNA gene amplicon sequencing. (D-G) Each point shows the mean weight change of a group of5–15 mice 6 weeks after T cell transfer (n=16 healthy donors, n = 6 CD donors, n = 6 UC donors [of which 2 UC and 2 CD had active disease]). (H) Relative abundance of major phyla in RagTCT mouse fecal microbiotas before and after colitis induction. Lines connect the mean abundances from groups of mice colonized with the same microbiota, before and after colitis induction. (I) The proportion of RORγt+ Th cells and IFNγ+IL-17A+CD4+ T cells in the colon of RagTCT mice 4 weeks after TCT. Each point represents data from one mouse, each color represents mice colonized with different microbiotas. (J) RORγt+ and Foxp3+ cells in the colon lamina propria 4 weeks after TCT. (K) The proportion of FoxP3+ Treg cells and RORγt+ Treg cells in the colon of RagTCT mice4weeks after TCT. Each point represents data from one mouse; each color represents a different microbiota. The numbers of FoxP3+ and cytokine+ cells are presented as a proportion of live, CD45+, CD4+ cells. The numbers of RORγt+ Treg cells are presented as a proportion of live, CD45+, CD4+, FoxP3+ cells. Boxplots show the median and interquartile range. P values are calculated using ANOVA with Tukey’s correction for multiple comparisons(D and G), paired t test (H), or unpaired Student’s t test (all other panels). ns, not significant, **p < 0.01, ***p < 0.001, ****p < 0.0001; Student’s t test. See also Figures S3, S4G, and S4I. Each point represents data from one mouse, each color represents a different microbiota.
Figure 5.
Figure 5.. Homeostatic Induction of RORγt+ Treg and RORγt+ Th Cells Predicts Experimental Colitis Severity and Human Microbiota Donor Health
Data on the effect of the donor microbiotas on T cell populations in B6 mouse gut and on colitis severity in RagTCT mice were combined and used to generate a logistic model that accurately predicted the health of the microbiota donor. (A) Correlations between colitis severity in RagTCT mice and the proportion of gut T cell subsets in unchallenged B6 mice colonized with the same microbiota.(B) Receiver operating characteristic (ROC) curves assessing the value of logistic models based on measurements made in humanized microbiota mice as binary classifiers to predict the health of the microbiota donor. “TCT week 6” refers to body mass data from RagTCT mice 6 weeks after T cell transfer. Other data used in the models are the proportions of RORγt+ Treg and RORγt+ Th cells measured in the colon of B6 mice. The body weight data represent the mean measurements of groups of 5–15 RagTCT mice colonized with a single human donor microbiota and the phenotyping data is the mean value of a group of 2–12 B6 mice colonized with the same single microbiota. p values are calculated by f-test. See also Figure S5.

Comment in

Similar articles

Cited by

References

    1. Ahern PP, Schiering C, Buonocore S, McGeachy MJ, Cua DJ, Maloy KJ, and Powrie F (2010). Interleukin-23 drives intestinal inflammation through direct activity on T cells. Immunity 33, 279–288. - PMC - PubMed
    1. Allen JE, and Sutherland TE (2014). Host protective roles of type 2 immunity: parasite killing and tissue repair, flip sides of the same coin. Semin. Immunol. 26, 329–340. - PMC - PubMed
    1. Atarashi K, Tanoue T, Shima T, Imaoka A, Kuwahara T, Momose Y, Cheng G, Yamasaki S, Saito T, Ohba Y, et al. (2011). Induction of colonic regulatory T cells by indigenous Clostridium species. Science 331, 337–341. - PMC - PubMed
    1. Atarashi K, Tanoue T, Ando M, Kamada N, Nagano Y, Narushima S, Suda W, Imaoka A, Setoyama H, Nagamori T, et al. (2015). Th17 cell induction by adhesion of microbes to intestinal epithelial cells. Cell 163, 367–380. - PMC - PubMed
    1. Atarashi K, Suda W, Luo C, Kawaguchi T, Motoo I, Narushima S, Kiguchi Y, Yasuma K, Watanabe E, Tanoue T, et al. (2017). Ectopic colonization oforal bacteria inthe intestine drivesTH 1 cell induction and inflammation. Science 358, 359–365. - PMC - PubMed

Publication types

Substances